R E S E A R C H
Open Access
Computer-aided diagnosis of breast
microcalcifications based on dual-tree complex
wavelet transform
Wushuai Jian, Xueyan Sun and Shuqian Luo
** Correspondence:[email protected] College of Biomedical Engineering, Capital Medical University, Beijing 100069, People's Republic of China
Abstract
Background:Digital mammography is the most reliable imaging modality for breast carcinoma diagnosis and breast micro-calcifications is regarded as one of the most important signs on imaging diagnosis. In this paper, a computer-aided diagnosis (CAD) system is presented for breast micro-calcifications based on dual-tree complex wavelet transform (DT-CWT) to facilitate radiologists like double reading.
Methods:Firstly, 25 abnormal ROIs were extracted according to the center and diameter of the lesions manually and 25 normal ROIs were selected randomly. Then micro-calcifications were segmented by combining space and frequency domain techniques. We extracted three texture features based on wavelet (Haar, DB4, DT-CWT) transform. Totally 14 descriptors were introduced to define the
characteristics of the suspicious micro-calcifications. Principal Component Analysis (PCA) was used to transform these descriptors to a compact and efficient vector expression. Support Vector Machine (SVM) classifier was used to classify potential micro-calcifications. Finally, we used the receiver operating characteristic (ROC) curve and free-response operating characteristic (FROC) curve to evaluate the performance of the CAD system.
Results:The results of SVM classifications based on different wavelets shows DT-CWT has a better performance. Compared with other results, DT-CWT method achieved an accuracy of 96% and 100% for the classification of normal and abnormal ROIs, and the classification of benign and malignant micro-calcifications respectively. In FROC analysis, our CAD system for clinical dataset detection achieved a sensitivity of 83.5% at a false positive per image of 1.85.
Conclusions:Compared with general wavelets, DT-CWT could describe the features more effectively, and our CAD system had a competitive performance.
Keywords:Micro-calcifications, Computer-aided diagnosis, Dual-tree complex wavelet transform
Background
Breast cancer is one of the most common cancers among female diseases all over the world. As the causes are unknown, early diagnosis and treatment is particularly im-portant in reducing the mortality rate. Currently, the most effective method for early detection of breast cancer is mammography [1,2], and micro-calcifications are import-ant sign of early-stage breast cancer, which are tiny deposits of calcium that appear on
the mammograms as bright spots. Because of subtle findings, radiologist distraction or complex architecture the number of false negative mammograms are higher during evaluating screening mammograms. Consequently, about 10-30% cases are missed dur-ing the routine check [1]. With the development of computer technology, a computer-aided diagnosis system comes into being, which can be useful for the radiologists as a second reader. Balleyguier et al. [3] showed that the use of CAD is more useful for the junior radiologist with an improvement in sensitivity from 61.9% to 84.6% compared to a slight improvement from 76.9% to 84.6% for the experienced radiologist.
Generally, a typical CAD system consists of four stages including image preproces-sing, extraction of ROIs, detection of micro-calcifications, feature extraction and classification.
Detection of micro-calcifications
There are many methods of micro-calcifications detection in mammograms, mainly including traditional image processing methods, filtering, threshold algorithm, neural network, SVM, etc. Boccignone G et al. [4] proposed a method combining multi-resolution analysis based on wavelet transform and threshold segmentation based on Renyi entropy. Nakayama R et al. [5] decomposed the mammograms using orthogonal 2-D wavelet transform to obtain Hessian matrix of every pixel, and then micro-calcifications were detected by computing the Eigen values of matrixes. In [6] the breast area was first segmented using morphological filtering and threshold method, then the difference image was obtained by subtracting the noise-suppressed image from the enhanced image of the breast area. Finally, micro-calcifications were segmented by clas-sification of difference images based on the neural network classifier. Melloul M et al. [7] described a threshold segmentation algorithm using entropy to select the threshold automatically and freely. All algorithms mentioned above had their advantages and drawbacks respectively.
Feature extraction and classification
rule-based detection methods, decision tree, etc. [11]. Besides, many studies used the mixed classification [12].
DT-CWT
DT-CWT, proposed by Kingsbury [13] is a recent enhancement to the Discrete Wavelet Transform (DWT). Compared to DWT, it is nearly shift-invariant, good multi-direction analysis and limited data redundancy which make it appropriate for feature extraction. High directional selectivity is useful for texture analysis.
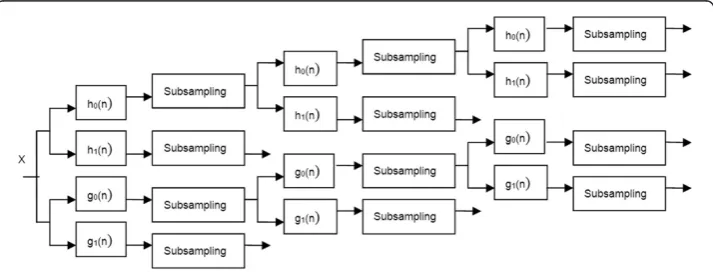
DT-CWT employs two real DWTs; the first gives the real part of the transform while the second gives the imaginary part [14]. Figure 1 shows the framework scheme of DT-CWT for 1-D signal. In the figure, Xstands for the input signal.h0(n) andh1(n)
repre-sent the low-pass and high-pass filter pair for the upper filter bank, g0 (n) andg1(n)
represents the low-pass and high-pass filter pair for the lower filter bank, respectively. 2-D CWT is the extension of 1-D CWT. It is essentially performs 1-D DT-CWT on rows and columns of the image in parallel. After 2-D DT-DT-CWT, consisting of four parallel 2-D DWT, we can get six directional sub-bands (±150, ±450, ±750) and the first and latter two parallel transforms produce the real and imaginary part of the six sub-bands, respectively.
The idea behind DT-CWT is inspired from Fourier Transform (FT) which does not suffer from shift variance. This property of FT is based on complex-valued oscillating signals which form a Hilbert pair out of phase components.
Kingsbury proposed to construct a complex-valued wavelet basis which also forms a Hilbert pair.
ψcð Þ ¼x ψrð Þ þx jψið Þx ð1Þ
Therefore, DT-CWT can decompose a signal into real and imaginary components as FT. these components are obtained separately using different filter banks. The pro-posed wavelets in [15] were used in this paper.
Figure 1Practical implementation of DT-CWT on 1-D signal.X stands for the input signal. h0 (n) and h1 (n) represent the low-pass and high-pass filter pair for the upper filter bank, g0(n) and g1(n) represent
Methods and results
Dataset and ROI selection
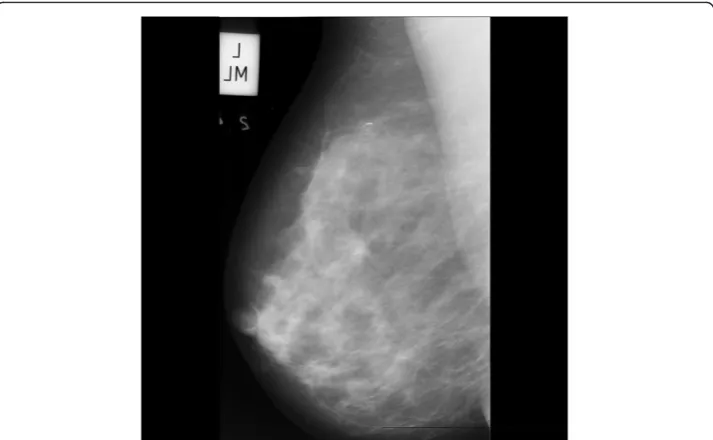
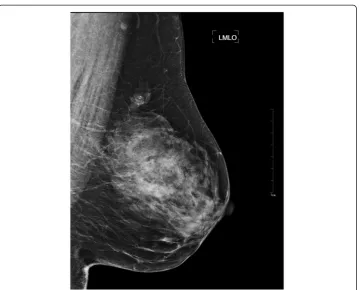
The mammograms used in our experiments were selected from the Mammography Image Analysis Society (MIAS) and a clinical dataset of mammograms from the Capital Medical University affiliated hospital. The study was approved by the Ethics Commit-tees of Capital Medical University. ROIs of clinical dataset of mammograms selected and decided by four experienced senior radiologists. MIAS is open access to research-ers. This dataset contains 322 images, in which there are 207 normal cases and 115 ab-normal cases. Each mammogram is of 1024×1024 pixels, with a spatial resolution of 50 μm/pixel. Figure 2 and Figure 3 show a typical mammogram in MLO view from MIAS and clinical dataset respectively. The coordinates of abnormality center and the approximate radius are provided. Knowing the location and the approximate size of ab-normality allows us to manually extract ROIs with proper dimension.
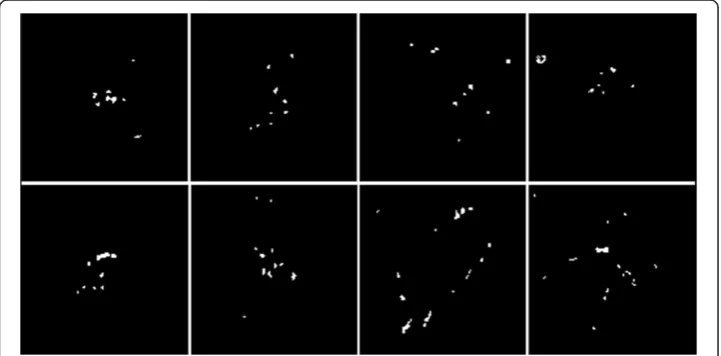
In our experiment, we used 50 ROIs with a size of 128×128 pixels, in which there are 25 normal ROIs and 25 ROIs containing micro-calcifications. Figure 4 shows eight ROIs containing micro-calcifications. After we obtained the ROIs, we stretched their gray scales to [0, 255] according to the following expression:
G1ðx;yÞ ¼ðG0ðx;yÞ min Gð Þ0 Þ max G 255
0
ð Þ min Gð Þ0 ð2Þ
Where G0(x, y) is the original grey value of the point(x, y), G1(x, y) is the grey value
of the point(x, y) in the ROI after grey normalization.
Detection of micro-calcifications
In the mammograms, micro-calcifications are usually brighter and smaller than the sur-rounding normal tissue. From the points of frequency domain, the micro-calcifications mainly consist of high-frequency component, while the background mainly consists of
the low frequency component. In this section, we used a method combining difference image technique and wavelet transform. The steps are as follows:
1. Difference image technique
Since the Laplace filtering can sharp a figure and enhance the high-frequency compo-nents, while smooth filtering can blur a figure and suppress the high-frequency
Figure 3Typical mammogram in MLO view from clinical dataset.In the ROI demonstrated there are micro-calcifications in the upper quadrant of the left breast.
components, the high-frequency image are constructed by the following scheme. f1
represents figure filtered by Laplace operator, f2 represents figure filtered by 3×3
smooth filtering operator f3 was obtained Subtract f2from f1and image. Then detect
the edge of f3using Kirsch operator and do binary segmentation.
2. Wavelet transform
By the simulation and analysis, we think the high-pass sub-band of first level consists of high-frequency components and the high-pass sub-band of fourth level consists of some low-frequency components. Thus, the original image was decomposed by Daube-chies wavelet at level four and the coefficients of the first layer and the fourth layer were set to zero. Then the wavelet reconstruction was done. Finally threshold segmen-tation was done.
3. After the first step, we got a binary image containing micro-calcifications and noise. Also, after the second step, we got a binary image containing micro-calcifications and background. Then, logical‘And’operation was taken on the results of the previous two steps. The partial results were shown in Figure5.
Feature extraction
Feature extraction and selection are important steps in CAD. DT-CWT has a better directional selection than general DWT, which describes the directional features of tex-ture preferably. So DT-CWT was used to get the wavelet featex-tures.
In order to reduce the calculation burden and complexity, we used PCA to choose a few key features from the potential micro-calcifications features. PCA can reduce the high dimensional correlated features into low dimensional features. In PCA, the symmetric covariance matrix or symmetric correlation matrix are calculated, and the
eigenvalues and eigenvectors of these matrix are calculated. By PCA, a few irrelevant principal components are removed so that can retain the original information as complete as possible.
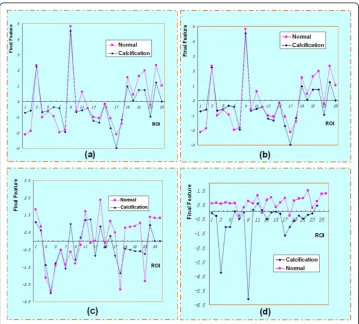
In our work, we choose fourteen features, including 2-nd moment, 4-th moment, 9 texture features and 3 wavelet coefficients. We used different wavelets in extracting the features. Then we transformed the 14 features to 4 linearly independent features. We have gotten a final feature called comprehensive score according to the contributions of the former 4 features. The final features of 50 ROIs are shown in Figure 6. The figures shows ROIs of the two categories have differences, and DT-CWT indeed has a better performance. The detailed descriptions of features used were as follows:
1. If the gray scale, gray average and histogram of an image areK,μandh(κ),κ=0, 1, 2,. . .,K-1 respectively, the n-order moment of the mean of histogram is defined as:
mn¼N1 X K1
k¼0
kμ
ð Þnh kð Þ ð3Þ
The second-order moment, also known as variance, describes the visual roughness of the image. The third-order and fourth-order moment are called inclination and kur-tosis, respectively, reflecting the asymmetry and the uniformity of the histogram. This paper used the second-order and fourth-order moment.
2. Texture features were calculated using the gray level co-occurrence matrixes
(GLCM) [16]. The results are 9 texture parameters. Suppose GLCM are defined asCij.
The angular second moment, inertia, inverse difference moment, entropy, correlation, sum average, difference average, sum entropy and difference entropy are computed as follows:
T1¼
X K1
i¼0
X K1
j¼0
C2ij
T2¼
X K1
i¼0
X K1
j¼0
ij
ð Þ2C
ij
T3¼
X K1
i¼0
X K1
j¼0
1 1þðijÞ2Cij
T4¼
X K1
i¼0
X K1
j¼0
CijlogCij
T5¼
X K1
i¼0
X K1
j¼0
ij
ð ÞCijμxμy
σxσy T6¼
X
2K2
k¼0
kCxþyð Þk
T7¼
X K1
k¼0
kCxyð Þk
T8¼
X
2K2
k¼0
Cxþyð Þk logCxþyð Þk
T9¼
X K1
k¼0
Cxyð Þk logCxyð Þk
ð4Þ
3. We directly decomposed the ROIs using 2-D DT-CWT and 12 sub-bands to get the wavelet coefficients. Then use the wavelet coefficients as the characteristics to clas-sify the lesions.
4. The area is estimated according to the size of the image foreground. The area is measured by the number of pixels roughly. The different weights are added to the dif-ferent pixels to compensate for the discrete pixels description of the continuous image. The Euler number (E) is a topology descriptor of a region, which describes the connect-ivity of the region. For a given area, the number of holes (H) and the number of con-nectivity crew(C) in the region are commonly used in the topological properties. We get E = C-H. In our paper we computed the area and Euler number of the micro-calcifications.
Classification based on SVM
The classification process included two steps. In the first step, samples corresponding to benign and malignant cases were labeled into a single class named abnormal class, while the samples not containing micro-calcifications were denoted by normal cases. In the second step, the task was to discriminate between benign and malignant samples. These two steps were both a binary classification problem.
In order to have an adequately representative training set, we adopted a leave-one-out cross-validation in the experiments. In the first step, we accomplished fifty different runs, where forty-nine images were used for training and the remaining one for testing. Similarly, in the second step we accomplished twenty-four different runs, where twenty-three images were used for training and the rest one for testing. The correct recognition rates (accuracy) of different wavelets are shown in Table 1, while the accur-acy is defined as the ratio of correctly classified samples versus all samples. Table 2 shows some classification results of other references using different wavelets. Com-pared with other results, DT-CWT method achieved an accuracy of 96% and 100% for the classification of normal and abnormal and the classification of benign and malig-nant, respectively. The results also show that the generalizability of this approach is quite well.
Performance evaluation of CAD
The ROC curve and the FROC analysis are common methods in evaluating CAD per-formance. In the ROC method, the observer classifies each image as normal or abnor-mal. The ROC curve is defined as a two-dimensional plot of True Positive Fraction (TPF) and False Positive Fraction (FPF). The ROC curve of MIAS is shown in Figure 7. Similarly, the FROC is used to assess the ability to correctly detect the abnormalities. The FROC curve is obtained by plotting the sensitivity, synonymous with TPF, versus the number of false positives per image (FP/image). As shown in the Figure 8, a sensi-tivity value of 83% is obtained at a rate of 1.85 FP per image.
Discussion
Computer-aided detection (CADe) systems address the problem that radiologists often miss signs of cancers that are retrospectively visible in mammograms. Furthermore, computer-aided diagnosis (CADx) systems have been proposed that assist the radiolo-gist in the classification of mammographic lesions as benign or malignant [22]. Key CAD techniques developed recently for breast cancer, including detection of calcifica-tions, detection of masses, detection of architectural distortion, detection of bilateral asymmetry, image enhancement, and image retrieval [23]. Deserno TM et al. [24] Table 1 Classification results of different wavelets
Accuracy Without wavelet Haar DB4 DT-CWT
Classification results of normal and abnormal ROIs 90% 90% 92% 96%
Classification results of benign and malignant micro-calcifications 95.8% 91.7% 87.5% 100%
Table 2 Classification results of other methods
Method Verma B [18] Panchal R [19] Lee S [20] Ren JC [21]
Figure 7ROC curve of MIAS dataset.
recently presented an implementation of a SVM-based CBIR (content-based image re-trieval) system for CADx in screening mammography.
This paper proposed a new CAD method of micro-calcifications based on DT-CWT. The new diagnosis algorithm to detect and classify micro-calcifications is verified by MIAS mammograms and clinical dataset. By combining special difference image tech-nique and wavelet transform, the suspicious micro-calcifications can be effectively seg-mented from mammograms. It shows DT-CWT is efficient in describing image features. By PCA, merely four principal components out of fourteen original features are obtained to describe the calcifications. SVM is applied to classify the micro-calcifications. Compared with other results, DT-CWT method achieved an accuracy of 96% and 100% to the classification of normal and abnormal and the classification of be-nign and malignant, respectively. The experiments showed that our attempt is efficient. To provide more reliable evaluation results on the performance of the proposed scheme, a larger database should be used in future work.
Future the scholars will remain focusing on how to improve the performance of CAD. However, there are two issues that limit the current development of CAD. These
are the inability to optimize a scheme for clinical impact—current methods only
optimize CAD in the absence of a radiologist—and the lack of a figure of merit that
quantifies the performance efficiency of CAD [25]. Such a figure of merit could be used to determine how much better performance CAD could obtain and which component of the several techniques employed is the weakest. The future work should be focused on how to solve these issues which may need more efforts. Furthermore, CAD must not be responsible for omitting the step of the complete evaluation of mammograms by the radiologist. A CAD system cannot and should not replace the radiologist as either or final interpretation [26].
Conclusions
In conclusion,compared with other wavelets (Haar, DB4), DT-CWT could describe the features more effectively. The paper showed our CAD system had a competitive per-formance. The use of a CAD system helps the radiologist as a second reviewer to evalu-ate screening mammograms.
Abbreviations
CAD: Computer-aided diagnosis; DT-CWT: Dual-tree complex wavelets transform; ROI: Regions of interest;
PCA: Principal component analysis; SVM: Support vector machine; ROC: Receiver operating characteristic; FROC: Free-response operating characteristic.
Competing interests
The authors declare that they have no competing interests.
Authors' contributions
WJ conceived of the study, and participated in its design and coordination and helped to draft the manuscript. XS worked on the algorithm design and implementation.SL contributed to discussion and suggestions throughout this topic, including the manuscript writing. All authors read and approved the final manuscript.
Authors' information
About the Author—Wushuai Jian Currently he is a Ph.D candidate at the College of Biomedical Engineering, Capital Medical University, Beijing, P.R. China. His research interests are medical image processing and phase-contrast imaging. About the Author—Xueyan Sun received the Master of Science degree from the College of Biomedical Engineering, Capital Medical University, Beijing, P.R. China in 2012. Her research interests include: medical image processing, pattern recognition.
Human. He is editor of many Chinese journal and principle investigator of many projects, including the National High Technique Research and Development Plan (863 Plan), Project of National Natural Science Foundation. He won Henan Science and Technology Progress Second Place Award, Project of Multi-Functional ECG Analyzer, 1993, and Asian Ten major CT (Computed Tomography) Science Award, Project of Multi-Modality Medical Image Registration, 1999, and Beijing Traditional Chinese Medicine First Place Award, Project of Meridian Adjustment Diagnosis and Therapy System, 2001.3. Prof. Luo has published 150 papers and 6 books.
Acknowledgments
This work was supported by the National Natural Science Foundation of China (Grant Numbers. 60532090 and 30770593) and was partly supported by the 7th Framework Programme of the European Community (Grant Agreement Number: PIRSES-GA-2009-269124).
Received: 28 September 2012 Accepted: 10 December 2012 Published: 19 December 2012
References
1. Cheng HD, Cai X, Chen X:Computer-aided detection and classification of micro-calcifications in mammograms: a survey.Pattern Recognition2003,36(12):2967–2991.
2. Cheng HD, Shi XJ, Min R:Approaches for automated detection and classification of masses in mammograms. Pattern Recognition2006,39(4):646–668.
3. Balleyguier C, Kinkel K, Fermanian J:Computed-aided detection (CAD) in mammography: does it help the junior or the senior radiologist?Eur J Radiol2005,54(1):90–96.
4. Boccignone G, Chianese A, Picariello A:Computer aided detection of micro-calcifications in digital mammograms.Comput Biol Med2000,30(5):267–286.
5. Nakayama R, Uchiyama Y, Yamamoto K:Computer-aided diagnosis scheme using a filter bank for detection of micro-calcifications clusters in mammograms.IEEE Trans Biomed Eng2006,53(2):273–283.
6. Papadopoulos A, Fotiadis DI, Likas A:An automatic micro-calcifications detection system based on a hybrid neural network classifier.Artif Intell Med2002,25(2):149–167.
7. Melloul M, Joskowicz L:Segmentation of micro-calcifications in X-ray mammograms using entropy thresholding.Comput Assist Radiol Surg2002, 1–6.
8. American College of Radiology:ACR BI-RADS Mammography: Breast Imaging Reporting and Data System, Breast Imaging Atlas, Volume 4. Preston: ACR; 2003.
9. Kinoshita SK, de Azevedo-Marques PM, Pereira RR:Content-based retrieval of mammograms using visual features related to breast density patterns.J Digit Imaging2007,20(2):172–190.
10. Yu S, Guan L:A CAD system for the automatic detection of clustered micro-calcifications in digitized mammogram films.IEEE Trans Med Imaging2000,19(2):115–126.
11. Giger M, Huo Z, Kupinski M:Computer-Aided Diagnosis in Mammography. Handbook of Medical Imaging. Washington, DC: SPIE; 2000:915–986.
12. Li L, Zheng Y, Zhang L, Clark RA:False-positive reduction in CAD mass detection using a competitive classification strategy.Med Phys2001,28(2):250–258.
13. Kingsbury NG:The dual-tree complex wavelet transform: a new efficient tool for image restoration and enhancement. Proc European Signal Processing Conf; 1998:319–322.
14. Selesnick IW, Baraniuk RG, Kingsbury NG:The dual-tree complex wavelet transform.IEEE Signal Proc Mag2005, 22(6):123–151.
15. Shi HL, Hu B, Zhang JQ:A novel scheme for the design of approximate Hilbert transform pairs of orthonormal wavelet bases.IEEE Trans Signal Process2008,56(6):2289–2297.
16. Shuqian L, Guohong Z:Medical Image Processing and Analysis. 1st edition. Beijing: Science; 2003:33–35. 17. Cortes C, Vapnik V:Support-vector networks.Mach Learn.1995,20(3):273–297.
18. Verma B, Zakos J:A computer-aided diagnosis system for digital mammograms based on fuzzy-neural and feature extraction techniques.IEEE Trans Inf Technol Biomed2001,5(1):46–54.
19. Panchal R, Verma B:Neural classification of mass abnormalities with different types of features in digital mammography.Int. J Comp Intel Appl2006,6(1):61–75.
20. Lee S, Lo C, Wang C:A computer-aided design mammography screening system for detection and classification of micro-calcifications.Int J Med Inform2000,60(1):29–57.
21. Ren JC, Wang D, Jiang JM:Effective recognition of MCCs in mammograms using an improved neutral classifier.Eng Appl Artif Intel2011,24(4):638–645.
22. Elter M, Horsch A:CADx of mammographic masses and clustered micro -calcifications: a review.Med Phys
2009,36(6):2052–68.
23. Tang J, Rangayyan RM, Xu J, Naqa IE, Yang Y:Computer-aided detection and diagnosis of breast cancer with mammography: recent advances.IEEE Trans Inf Technol Biomed2009,13(2):236–251.
24. Deserno TM, Soiron M, de Oliveira JEE:Computer-aided diagnostics of screening mammography using content-based image retrieval.Proc SPIE2012,8315:271–279.
25. Nishikawa RM, Pesce LL:Fundamental limitations in developing computer-aided detection for mammography. Nucl Instrum Meth A2010,648(Suppl 1):251–254.
26. Dromain C, Boyer B, Ferre R:Computed-aided diagnosis (CAD) in the detection of breast cancer.Eur J Radiol, in press.
doi:10.1186/1475-925X-11-96