International Journal of Engineering
J o u r n a l H o m e p a g e : w w w . i j e . i rRegion Completion in a Texture using Multiresolution Transforms
R. S. Vinod Kumar a *, S. Arivazhaganb
Department of Electronics & Communication Engineering, Noorul Islam College of Engineering, Tamil Nadu. India
Department of Electronics & Communication Engineering, Mepco Schlenk Engineering College, Tamil Nadu, India
P A P E R I N F O
Paper history: Received 09 June 2013
Received in revised form 17 October 2013 Accepted 21 December 2013
Keywords:
Image Processing Texture Synthesis Patch
Concatenation Minimum Cost Path Wavelet Transform Contourlet Transform
A B S T R A C T
Natural images, textures and photographs are likely to be impaired by stains. As a result a substantial portion of the image remains blurred. However, a method called region completion is adopted to fill in the tainted part using the information from the portion left unblemished by stains. A novel method to perform this operation is proposed in this paper. The three significant stages involved in the proposed work are patch size selection, matching patch identification using multiresolution transforms such as Wavelet and Contourlet Transforms, and finally minimum cost path determination. The aforesaid methods perform well for different varieties of texture images. The results obtained using the proposed method is encouraging and reasonable in some cases.
doi:10.5829/idosi.ije.2014.27.05b.10
1. INTRODUCTION1
In consumer and professional markets, digital camera has become an integral and inevitable factor. It facilitates the immediate availability of photos and electronic transfer to editorial office. Digital cameras are also capable of producing perfect electronic images which can be easily copied and stored for a long time. It is therefore necessary to digitize many photographs of precious architectures and important events for the sake of preserving them in future. But these materials display blemishes like scratches [1]. In addition, disturbing artifacts such as subtitles, logos, and physical objects such as wires and microphones also present. These obvious defects have to be removed in a fully automatic way which may also be adopted to find out image regions which require repair. This will also find out obvious defects but the detection of unwanted objects can be performed only with user interaction [1]. Automatic detection is not discussed in this paper because of this drawback/limitation. The paper only aims at presenting a new method to repair impaired
*Corresponding Author Email: [email protected] (R. S. Vinod Kumar)
portion of digitized photographs automatically. The proposed method uses patch based texture synthesis technique using multiresolution transform.
The term texture generally refers to repetition of basic texture elements called texel. The texel contains several pixels, whose placement could be periodic, quasi-periodic or random. Natural textures are generally random, whereas artificial textures are often deterministic or periodic. Texture may be coarse, fine, smooth, granulated, rippled, regular, irregular, or linear. Texture synthesis algorithms are classified into procedural texture synthesis and texture synthesis by example. Stochastic texture synthesis and specific structure texture synthesis are procedural-based approaches, while pixel based and patch-based texture synthesis algorithms are exemplar-based texture synthesis [2].
analysis, pixel based texture synthesis and patch-based texture synthesis. Texture synthesis by analysis is usually characterized by a sample texture using a limited number of statistics. A new texture is synthesized such that the statistics of the sample texture are maintained. Pixel-based texture synthesis algorithms are the simplest and the most effective texture synthesis algorithms. They normally search and copy the pixels from the input sample with the most similar neighboring pixels. On the other hand, patch-based texture synthesis algorithms produce new textures by repeatedly searching and copying a single patch from the sample texture. Many researchers are working in this area of pixel based and patch based texture synthesis [3-17]. Texture synthesis is used in a wide area of applications.
Some of them are rendering, animation,
compression/decompression, restoration and editing, computer vision, etc. Plenty of works have been performed in the area of region filling, object removal, image inpainting, etc [18-26]. Some of the works carried out in these areas are listed here.
Liu et al. proposed a new polygon based region filling algorithm using the proposed data structures of triples. Using data structures of triples, the y-coordinate modification problem that occurs in the conventional algorithm disappears. The experimental results strongly support superiority of the proposed algorithm [18]. Rane et al. presented an approach for filling blocks of missing data in wireless image transmission. Here, instead of using a common re-transmission query protocols, the lost data is reconstructed using the correlation between the lost block and its neighbors. If the lost block contains structure, it is reconstructed using an image inpainting algorithm, while texture synthesis is used for the textured blocks [20].
Criminisi et al. presented an exemplar-based texture synthesis technique that contained the essential process required to replicate both texture and structure. The simultaneous propagation of texture and structure information was achieved by a single, efficient algorithm. Computational efficiency was achieved by a block-based sampling process [21].
Fang proposed a texture synthesis technique that adopted a multiresolution approach, which improved the convergence rate of the synthesis process and the ability to deal with large replaced regions. In the training process, a down-sampling approach was applied to create a patch-based texture eigen space. In the image completion process, an up-sampling approach was applied to synthesize the replaced foreground regions [23].
Huang et al. presented an image inpainting method that restored the damaged region of interest or removed the areas in an image. For the purpose of filling large-sized damaged areas in the image and lowering down the operation complexity an exemplar-based image inpainting was introduced [24].
Cho et al. developed a deconvolution method called iterative distribution reweighting (IDR) which imposed a global constraint on gradients so that a reconstructed image should have a gradient distribution similar to a reference distribution [25].
From the literature, it is understood that most of the region completion algorithms in a texture are based on pixel based texture synthesis which require larger computation time. Since the proposed algorithm uses a patch based texture synthesis, the computation time is reduced. The selection of matching patches is done using either Wavelet transform or Contourlet transform which encodes the information on the original signal in a much better manner, whereas it was done in spatial domain in the existing works. Also, a modified boundary determination technique is used to determine the boundary between the patches of the target region. This paper is organized in the following manner. It begins with a brief introduction about texture synthesis and few related works in region completion, image restoration, object removal, etc. Section 2 formalizes the detailed idea about the proposed region completion algorithm. While the results of region completion algorithm are presented in section 3 with an emphasis on output quality; conclusion and future works are discussed in section 4.
2. PROPOSED METHOD
be obtained in a new transform called Contourlet transform by first applying a multiscale transform and then applying a local directional transform to gather the nearby basis functions at the same scale into linear structures [28]. In essence, a wavelet-like transform is used for edge detection, and then a local directional transform for contour segment detection.
Therefore, a double filter bank approach is necessary for obtaining sparse expansions for typical images with smooth contours. The pyramidal directional filter bank proposed in the literature [28] is used for the implementation of Contourlet transform. In contrast to the Mallat’s decomposition, which leads to narrow frequency bandwidths at low frequencies and wide frequency bandwidths at high frequencies, the wavelet packets approach [29] emerged first as a way of adjusting high frequency resolutions. Hence, the Mallat’s decomposition scheme [30] is applied to both parts of a filter bank leading to the split of frequencies in progressive finer resolutions.
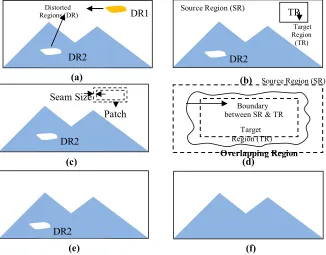
The schematic representation of the proposed algorithm is shown in Figure 1. Figure 1(a) represents the original image with two distorted regions (DR1 and DR2). The remaining areas are called as the undistorted region or source region. The region completion algorithm is briefed as follows: The shape of DR1 is approximated to a square/rectangular region comprising the distorted portion, named as the target region (TR1) as shown in Figure 1(b). The TR1 has to be replaced either by a patch, when the size of the target region is smaller or by a set of patches, when the target region is comparably bigger. To overcome the mismatch error along the boundaries of source and target region an overlapping of 1/6 of the patch size is permitted [8, 16]. So the size of the candidate patch is greater than the target region and is schematically shown by a dotted line in Figure 1(c). In case 1, for a target region of N×N pixels, the size of the candidate patch is chosen to be (N+(2×n/2))× (N+(2×n/2)), where n is the overlapping region or seam size of the candidate patch with the source region. In case 2, the patch size is determined based on the size of the target region and the number of patches used to fill up the target region. Let the dimension of the target region along x and y directions be given by TRx and TRy, respectively. If Dx and Dy are half the target regions of TRx and TRy, respectively, the patch dimension in the x and y directions when four patches are used for region completion is derived as given in Equations (1) and (2).
12 6
x x x x
D D D
PS = + + (1)
12 6
y y y y
D D D
PS = + + (2)
The dimension of the reconstructed region in the x
and y directions is given by
6
2 x
x x
D PS
TR = ´ - (3)
6
2 y
y y
D PS
TR = ´ - (4)
Once a suitable patch or set of patches are selected, the patch boundaries are determined using modified minimum error boundary cut. This is followed by the concatenation of the boundaries of the candidate patch and the source region which produces the reconstructed image as shown in Figure 1(c).
In Figure 1(d), the inner dotted line is the boundary of the target region and the outer dotted line is the boundary of the candidate patch. After the boundary determination technique, a common boundary between the candidate patch and target region is formed and is shown as a continuous line in Figure 1(d). After the removal of DR1 from the given texture (Figure 1(e)), the processing of DR2 will commence and DR2 is removed (Figure 1(f)).
2. 1. Matching Patch Selection The selection of
matching patches is based on an error metric. Patch matching is carried out either between the boundary regions of the to-be-synthesized patch and the source region when a single patch is used for region completion or between the boundary regions of adjacent patches when more number of patches is used.
The patch satisfying the error tolerance is chosen as the candidate patch. The best patch selection is done using Euclidean Norm (L2 norm) and the one proposed in the literature [8] is not an appropriate method for patch selection, since the computation of pixel to pixel difference in spatial domain may neglect significant texture features, whereas, the wavelet coefficients perform the similarity measurements in an excellent manner[13].
During synthesis, the patches should be matched along the boundary zones to minimize the visual artifacts.
(5)
where Ej
i
C and Ej i C
1
+ represent the wavelet coefficient
values of jth pixel of the ith and i+1th patch and R, G
and B are the three primary colors. The two overlapping regions Ei and Ei+1 match if Equation (6) is satisfied and is given by
(6)
where A is the number of coefficients in the seam region, Cj
Ei represents the values of the jth coefficient
in the Ei overlapping region, d(.) represents the distance between the two patches and
t
is a predefined constant.Figure 2. Schematic representation of minimum error boundary cut; (a). Boundary of the candidate patch; (b). Boundary of the source region; (c). Vertical edge of the candidate patch; (d). Vertical edge of the source region; (e). Difference patch-The dotted line shows the path of MEBC; (f). Horizontal edge of the candidate patch; (g). Horizontal edge of the source region; (h). Difference patch-The dotted line shows the path of MEBC.
Figure 1. Schematic representation of the proposed region completion algorithm; (a) Image with two distorted regions DR1 and DR2; (b) The distorted region is approximated to the nearest square/rectangular region; (c) Image representing the seam size and the patch size of DR1; (d) Enlarged portion of DR1 showing the source region, target region, overlapping region and the boundary between SR and TR; (e) Reconstructed image with DR1 removed; (f) Steps from b-d is performed and DR2 is removed.
2. 2. Modified Minimum Error Boundary Cut
After the selection of best patch, the boundary between the adjacent patches is determined using a modified minimum error boundary cut (MEBC). Three types of boundaries exist between the patches in a regular patch based texture synthesis. They are vertical, horizontal and L shaped boundaries [17]. While the identification of vertical and horizontal boundaries is easier, the third type is difficult. The difficulty in the computation of L
shaped boundary is reduced by doing the MEBC operation in two steps. In the first step, the best two adjacent patches in a particular row of output texture is identified, the horizontal boundaries between two adjacent patches are determined and the horizontal concatenation of these two patches are done [17]. This procedure is repeated for the remaining patches of the same row. Once all the patches of a row are synthesized, the resulting patch set is concatenated vertically with the
(
)
(
)
21
,
, 1
2
1 1
1
, ú
û ù ê
ë é
-=
å å
= =
+ +
B G R
A
j
j E j E i
i E A Ci Ci
E d
y j
(
)
( )
21
,
, 1
2 1
1
, ú
û ù ê
ë é =
£
å å
= = +
B G R
A
j j E i
i E A C i
E d
y j
t d
(d)
(f) (a)
Distorted
Regions (DR) DR1
DR2
(c)
Seam Size
Patch Size DR2
(e)
DR2
Target Region
(TR)
Source Region (SR)
DR2
TR
Target Region (TR)
Boundary between SR & TR
Overlapping Region Source Region (SR)
(b)
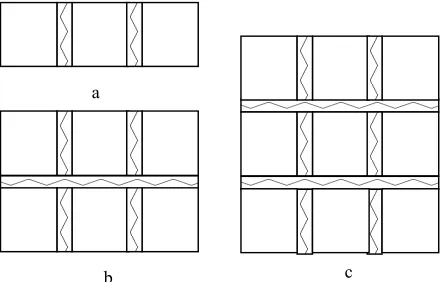
patch set above it (if any), after identifying the patch boundaries between the patch sets as shown in the Figure 3. The size of the overlapping region as a result of this technique is n×m pixels, where n is the number of patches in the row and m is the number of rows of pixels in the overlapping region of the patches or the seam size of a patch. Using equations of the minimum cost path, the boundary between the patches is determined as shown in Figure 2. The overlapping regions are along the vertical and horizontal directions. The MEBC is calculated both along the vertical and horizontal directions. The MEBC along the vertical direction is calculated using the formula given in Equation (7)
(7)
[
1 1 1, 1, 1]
,
,j = i j+min i- ,j- , i- j, i- j+
i e E E E
E
where Ei,j is the cumulative minimum error in the ith, jth
pixel [8]. Similarly the MEBC along the horizontal direction is calculated using the formula given in Equation (8)
(8)
[
1 1 1, 1, 1]
,
,j = i j +min i- ,j- , i- j, i+ j+
i e E E E
E
Using modified boundary determination technique a better patch boundary with minimum visual artifacts is obtained.
2. 3. Algorithm The initial settings made in the synthesis technique are (i) input patch size, (ii) seam size, (iii) the predefined constant (t ), (iv) the size of the output texture and (v) DWT decomposition level. The complete algorithm is the combination of four sections viz. target region identification, patch size selection, selection of candidate patch and the determination of the patch boundaries. The size of the candidate patch depends on the size of the target region and seam size. After fixing the patch size, the best patch selection is done. Once a candidate patch is selected, the patch boundaries are determined using modified minimum error boundary cut (MEBC). It is followed by concatenation of the candidate patch with the source region. The step by step explanation of the region filling algorithm is briefed here.
i. Identify the target region in the given texture. ii. Calculate the dimension of the target region and
approximate it as a square or rectangular region. iii. If a single patch is used to fill up the hole, the
patch size is the combination of the flaw size and the seam size, where the seam size is 1/6 of the flaw size.
iv. If more than a single patch is used to fill up the holes, the size of the patches is determined using Equations (1) and (2).
v. Form sample sets consisting of patches with sizes mentioned in step (iii)/step (iv) and performing the best patch selection along the four edges of the
to-be-synthesized patch with the edges of the source region using the Equations (5) and (6).
vi. After performing the patch selection, the patch with the lowest error is assigned as the candidate patch.
vii. Determine the minimum cost path between the boundaries of the candidate patch (es) and the source region using Equations (7)and (8).
viii. Concatenate the source region with the boundaries of the candidate patch (es).
ix. Perform the smoothing operation along the patch boundaries to minimize the visual artifacts.
In the proposed method, the output texture size is 256×256 pixels. The number of input patches in the sample set is selected as 50. The algorithm is simulated with twelve texture samples.
Figure 3. Schematic representation of synthesized output; (a) Synthesis of a row of patches; (b) Synthesis of two rows of patch sets and (c) Synthesized output.
3. RESULTS AND DISCUSSION
Experiments are performed with twelve texture images and their performance is compared in terms of average difference in histogram (ADH) and computation time (CT). The obtained outputs and the discussions are presented in this section. The developed algorithm is implemented using MATLAB (R2007) and executed in Intel Core 2 Duo processor @ 2.6 GHz with 4GB RAM. Experiments are conducted with twelve texture images, such as ‘Mat’, ‘Wave’, ‘Corn’, ‘Bark’,
‘Bluebay’, ‘Carpet’, ‘Grass’, ‘Sand’, ‘Net’, ‘Oxide’,
‘Board’ and ‘Ostrich’ under two categories. In Category 1, a single patch is used to fill up the target region; whereas in Category 2 four patches with size around one fourth of the target region is used to fill up the distorted region. In both categories the experiments are performed and the simulated results of the two categories are shown in Figure 4 and Figure 5, respectively. Distorted regions of size 64×64 and
a
100×100 pixels are referred as Category 1 and Category 2, respectively. In the former case a single patch of size 84×84 pixels is used for filling the distorted region of size 64×64 pixels, whereas in the latter four patches of size 64×64 pixels are concatenated to fill up the hole of size 100×100 pixels. The size of the output texture is selected as 256×256 pixels.
3. 1. Comparison Using Quantifying Parameters
The quantifying parameters such as CT and ADH are used to measure the performance of the proposed method. For each of the twelve texture images, the experimentation is repeated ten times and the mean value of CT and mean ADH are calculated and entered in Table 1. The observations made from Table 1 are (i) the CT using Contourlet transform is higher than that of Wavelet transform, (ii) the ADH using Contourlet transform is lesser than that of Wavelet transform and (iii) CT and ADH obtained in Category 1 are lesser than Category 2 for both transforms. From Table 1, it can be concluded that the speed of operation of Contourlet transform is lesser than Wavelet transform. However, the quality of the image obtained using the Contourlet transform is better than Wavelet transform. Also, it is understood that the CT and ADH are directly proportional to the number of patches involved in filling the holes in the region completion operation. The performance of the proposed method in terms of CT and ADH, for the two categories is compared graphically in Figure 6. From the graphical representation, following observations are made. As the number of patches involved in the region completion operation increases, both CT and ADH increase. Also, the CT of the Contourlet transform is greater than Wavelet transform in both categories, whereas the corresponding ADH of the Contourlet transform is lesser than that of Wavelet transform.
The pictorial comparison of the proposed work with the work of Efros and Freeman [8] for the aforesaid Categories are given in the Figure 7 and Figure 8, respectively. From these figures, it is observed that the quality of the outputs obtained in the proposed methods are comparably better. While Figure 7 shows the output of the region completion operation with a hole size of 64×64 pixels (Category 1), Figure 8 shows the output of the same with a hole size of 100×100 pixels (Category 2). The proposed work uses Wavelet transform and Contourlet transform for region completion, whereas the method proposed by Efros and Freeman uses spatial domain for region completion operation.
3. 2. Comparison with the Existing Works
Further for the purpose of comparison, the region completion algorithm is simulated with Efros and Freeman method [8], with five input textures namely
‘Mat’, ‘Wave’, ‘Corn’, ‘Bark’, and ‘Bluebay’. The experimentation is done with holes with sizes viz.
64×64 and 100×100 pixels and the seam size is 1/6 of patch size. From Table 1, it is observed that comparable results are obtained in the proposed work.
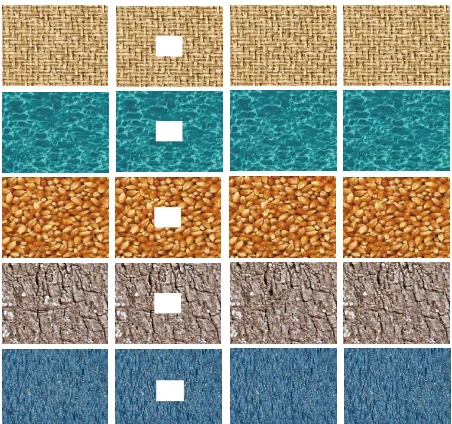
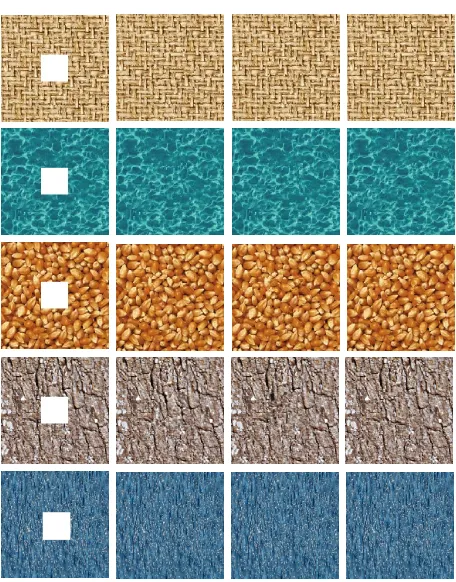
Figure 4(a). Region completion output for textures ‘Mat’,
‘Wave’, ‘Corn’, ‘Bark’ and ‘Bluebay’. A single patch is used to fill up the distorted region: Category-1; Column 1: Input image; Column 2: Image with a hole of size 64×64 pixels; Reconstructed image using Wavelet transform (Column 3) and Contourlet transform (Column 4)
Figure 4(b). Region completion output for textures ‘Carpet’,
Figure 5(a). Region completion output for textures ‘Mat’,
‘Wave’, ‘Corn’, ‘Bark’ and ‘Bluebay’. Four patches are used to fill up the distorted region: Category-2; Column 1: Input image; Column 2: Image with a hole of size 100×100 pixels; Reconstructed image using Wavelet transform (Column 3) and Contourlet transform (Column 4)
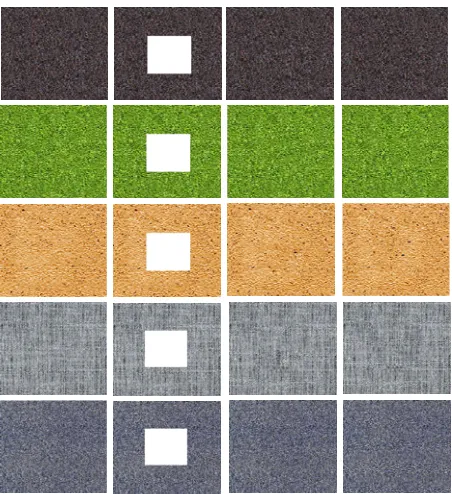
Figure 5(b). Region completion output for textures ‘Carpet’,
‘Grass’, ‘Sand’, ‘Net’ and ‘Oxide’; Four patches are used to fill up the distorted region: Category-2; Column 1: Input image; Column 2: Image with a hole of size 100×100 pixels; Reconstructed image using Wavelet transform (Column 3) and Contourlet transform (Column 4)
(a) Plot of texture type vs computation time (s)
(b) Plot of texture type vs average difference in histogram
Figure 6. Graphical representation. Plot of (a) Texture type vs computation time (sec.) and (b) Texture type vs average difference in histogram for Wavelet and Contourlet transform. In the figure, Category 1-WT: Category 1 Wavelet transform; Category 2-WT: Category 2 Wavelet transform; Category 1-CoT: Category 1 Contourlet transform; Category 2-1-CoT: Category 2 Contourlet transform
For example, the region filling algorithm using the method proposed in the literature [8] required a computation time of 14.78 sec. while the proposed region completion algorithms required 7.15 and 7.33 sec., respectively when the simulation is used to fill up a hole size of 100×100 pixels with ‘Mat’ as input sample. The mean ADH using the method proposed in the literature [8] is 18.510×10⁻⁵, whereas it is 9.307 ×10⁻⁵ and 7.641×10⁻⁵, respectively for the proposed work under identical conditions for Wavelet and Contourlet transforms. When the simulation is repeated with other input samples better results in favour of the proposed methods are also obtained.
Some of the comparisons made with few other
existing patch based techniques in terms of computation time are as follows: Yamuchi et al. [1] simulated the algorithm on a 1.7 GHz Pentium 4 PC for an input image size of 600×450 pixels.
0 2 4 6 8 10 12 14
A
ve
ra
ge
D
iff
er
en
ce
in
H
is
to
gra
m
x
10
-5
Texture Sample
TABLE 1. Performance comparison of the proposed region completion algorithm
Texture Sample
Region completion with one patch (For smaller holes, Category 1)
Region completion with four patches (For larger holes, Category 2)
Wavelet Transform Contourlet Transform Wavelet Transform Contourlet Transform
CT (s) ADH× 10-5 CT (s) ADH × 10-5 CT (s) ADH × 10-5 CT (s) ADH× 10-5
Mat 0.7144 6.7913 0.9810 6.6081 7.1553 9.3073 7.3349 7.6413
Wave 0.7053 6.0821 0.9570 4.8787 7.0939 8.7542 7.2950 7.9089
Corn 0.7053 7.0394 0.9734 6.2430 4.1328 8.8126 4.3387 7.9261
Bark 0.7226 8.9551 0.9752 7.7965 10.908 11.848 11.060 11.214
Bluebay 0.7121 6.444 1.0858 5.5595 2.9658 7.2039 5.2473 6.7063
Carpet 0.7398 4.6203 0.9970 3.7918 3.1042 5.6825 3.0991 5.2305
Grass 0.6936 6.5195 1.6000 5.3985 2.8645 7.9268 3.0218 7.0086
Sand 0.6996 6.0149 0.9948 4.8159 2.9660 7.9997 3.0124 6.5894
Net 0.6970 5.4151 0.9936 4.9690 4.1120 7.8593 4.3656 6.6406
Oxide 0.7033 5.3846 0.9936 4.6487 4.0832 7.4350 4.3696 6.3052
Board 0.7108 7.0893 0.9885 5.7749 4.0936 8.5000 4.3598 7.7814
Ostrich 0.6993 7.2360 1.5394 5.7355 9.4408 12.850 9.7215 12.166
Figure 7. Region completion output for textures ‘Mat’,
‘Wave’, ‘Corn’, ‘Bark’ and ‘Bluebay’; A single patch is used to fill up the distorted region: Category-1; Column 1: Image with a hole of size 64×64 pixels; Reconstructed image using Efros and Freeman Method (Column 2), Wavelet Transform (Column 3) and Contourlet Transform (Column 4)
Figure 8. Region completion output for textures ‘Mat’,
When the masks covered 4.6% of the input image, the algorithm took about 5-10 minutes for restoring the image. Guo et al. [22] used C ++ implementation and it took about 5 minutes on 1.2 GHz PC for a 800×600 pixels colour image with about 18% pixels to be restored. Gulhane [27] required a time of 16.88 seconds to get the restored output image and obtained a PSNR value of the output image as 45.16dB.
4. CONCLUSION AND FUTURE WORK
A new technique using patch based texture synthesis has been proposed for filling up holes in textures. This results in an output texture in which the region of interest has been replaced by a texture that mimics the appearance of the source region. It has been shown that when the hole size (distorted region) is smaller, a single patch is used for region completion and when the hole size is bigger, more number of patches are required. The results of the proposed method have been shown for a variety of texture inputs.
In the proposed work, Wavelet and Contour transforms are used to perform the best patch selection. The work can be extended by performing the patch selection using non subsampled Contourlet and Curvelet transform.
5. REFERENCES
1. Yamauchi, H., Haber, J. and Seidel, H.-P., "Image restoration using multiresolution texture synthesis and image inpainting", in Computer Graphics International, Proceedings, IEEE, (2003), 120-125.
2. Bao, G., Dong, W. and Zhang, X., "A Survey on Recent Patents in Texture Synthesis", Recent Patents on Computer Science, Vol. 5, No. 1, (2012), 21-25.
3. Efros, A. A. and Leung, T. K., "Texture synthesis by non-parametric sampling", in Computer Vision, The Proceedings of the Seventh IEEE International Conference on, IEEE. Vol. 2, (1999), 1033-1038.
4. Paget, R. and Longstaff, I. D., "Texture synthesis via a noncausal nonparametric multiscale Markov random field",
IEEE transactions on image processing: a publication of the IEEE Signal Processing Society, Vol. 7, No. 6, (1997), 925-931.
5. Portilla, J. and Simoncelli, E. P., "A parametric texture model based on joint statistics of complex wavelet coefficients",
International Journal of Computer Vision, Vol. 40, No. 1, (2000), 49-70.
6. Sabha, M., Peers, P. and Dutré, P., "Texture synthesis using exact neighborhood matching", in Computer Graphics Forum, Wiley Online Library. Vol. 26, (2007), 131-142.
7. Dong, F. and Ye, X., "Multiscaled texture synthesis using multisized pixel neighborhoods", Computer Graphics and Applications, IEEE, Vol. 27, No. 3, (2007), 41-47.
8. Efros, A. A. and Freeman, W. T., "Image quilting for texture synthesis and transfer", in Proceedings of the 28th annual conference on Computer graphics and interactive techniques, ACM. (2001), 341-346.
9. Liang, L., Liu, C., Xu, Y.-Q., Guo, B. and Shum, H.-Y., "Real-time texture synthesis by patch-based sampling", ACM Transactions on Graphics (ToG), Vol. 20, No. 3, (2001), 127-150.
10. Cohen, M. F., Shade, J., Hiller, S. and Deussen, O., "Wang tiles for image and texture generation, ACM, Vol. 22, (2003). 11. Kwatra, V., Schödl, A., Essa, I., Turk, G. and Bobick, A.,
"Graphcut textures: image and video synthesis using graph cuts", in ACM Transactions on Graphics (ToG), ACM. Vol. 22, (2003), 277-286.
12. Dong, F., Lin, H. and Clapworthy, G., "Cutting and pasting irregularly shaped patches for texture synthesis", in Computer Graphics Forum, Wiley Online Library. Vol. 24, (2005), 17-26. 13. Tonietto, L., Walter, M. and Jung, C. R., "A Randomized
Approach for Patch‐based Texture Synthesis using Wavelets", in Computer Graphics Forum, Wiley Online Library. Vol. 25, (2006), 675-684.
14. Lai, L.-Y., Hwang, W.-L. and Sreedevi, P., "Performance evaluation of a novel sampling-based texture synthesis technique using different sized patches", Signal, Image and Video Processing, Vol. 2, No. 3, (2008), 275-286.
15. Wang, W., Liu, F., Huang, P. and Wu, E., "Texture synthesis via the matching compatibility between patches", Science in China Series F: Information Sciences, Vol. 52, No. 3, (2009), 512-522.
16. Kumar, R. and Arivazhagan, S., "Effects of variation of patch size and seam size in patch based texture synthesis", in Computing Communication and Networking Technologies (ICCCNT), International Conference on, IEEE. (2010), 1-8. 17. Vinod Kumar, R. and Arivazhagan, S., "Adaptive patch based
texture synthesis using wavelet", in Signal Processing, Communication, Computing and Networking Technologies (ICSCCN), International Conference on, IEEE. (2011), 847-852. 18. Liu, H. C., Chen, M. H., Hsu, S. Y., Chien, C., Kuo, T. F., Wang, Y. F., and Tamkang, A., "New Polygon Based Algorithm for Filling Regions", Journal of Science and Engineering, Vol. 2, (2000), 175-186.
19. Lasram, A. and Lefebvre, S., "Parallel patch-based texture synthesis", in Proceedings of the Fourth ACM SIGGRAPH/Eurographics conference on High-Performance Graphics, Eurographics Association. (2012), 115-124.
20. Rane, S. D., Sapiro, G. and Bertalmio, M., "Structure and texture filling-in of missing image blocks in wireless transmission and compression applications", Image Processing, IEEE Transactions on, Vol. 12, No. 3, (2003), 296-303.
21. Criminisi, A., Pérez, P. and Toyama, K., "Region filling and object removal by exemplar-based image inpainting", Image Processing, IEEE Transactions on, Vol. 13, No. 9, (2004), 1200-1212.
22. Guo, H., Ono, N. and Sagayama, S., "A structure-synthesis image inpainting algorithm based on morphological erosion operation", in Image and Signal Processing. CISP'08. Congress on, IEEE. Vol. 3, (2008), 530-535.
23. Fang, C.-W. and Lien, J.-J., "Rapid image completion system using multiresolution patch-based directional and nondirectional approaches", Image Processing, IEEE Transactions on, Vol. 18, No. 12, (2009), 2769-2779.
24. Huang, H.-Y. and Hsiao, C.-N., "An image inpainting technique based on illumination variation and structure consistency", in Information Sciences and Interaction Sciences (ICIS), 3rd International Conference on, IEEE. (2010), 415-420.
26. Gulhane, P. R. and Gaikwad, V., "Image Restoration Using Filling-In Technique",International Journal of Computational Engineering & Management, Vol. 15, (2012), 36-40 , 27. Daubechies, I., "The wavelet transform, time-frequency
localization and signal analysis", Information Theory, IEEE Transactions on, Vol. 36, No. 5, (1990), 961-1005.
28. Do, M. N. and Vetterli, M., "The contourlet transform: an efficient directional multiresolution image representation",
Image Processing, IEEE Transactions on, Vol. 14, No. 12, (2005), 2091-2106.
29. Eshaghi, M. and Karami Mollaei, M., "A new algorithm for voice activity detection based on wavelet packets", in Electrical Engineering, ICEE. Second International Conference on, IEEE. (2008), 1-4.
30. Mallat, S. G., "A theory for multiresolution signal decomposition: the wavelet representation", Pattern Analysis and Machine Intelligence, IEEE Transactions on, Vol. 11, No. 7, (1989), 674-693.
Region Completion in a Texture using Multiresolution Transforms
R. S. Vinod Kumar a, S. Arivazhaganb
Department of Electronics & Communication Engineering, Noorul Islam College of Engineering, Tamil Nadu. India
Department of Electronics & Communication Engineering, Mepco Schlenk Engineering College, Tamil Nadu, India
P A P E R I N F O
Paper history: Received 09 June 2013
Received in revised form 17 October 2013 Accepted 21 December 2013
Keywords:
Image Processing Texture Synthesis Patch
Concatenation Minimum Cost Path Wavelet Transform Contourlet Transform هﺪﯿﮑﭼ ،ﻻﻮﻤﻌﻣ وﺎﺼﺗ ﺮﯾ ﺒﻃ ،ﯽﻌﯿ ﺖﻓﺎﺑ ﺎﻫ ﺲﮑﻋو ﺎﻫ ارﺎﭼدﺎﻫﻪﮑﻟﻂﺳﻮﺗ لﺎﮑﺷ ﻣ ﯽ ﻮﺷ ﻧﺪ . ﺘﻧرد ،ﻪﺠﯿ ﻬﺟﻮﺗﻞﺑﺎﻗﺶﺨﺑ ﯽ
ﻮﺼﺗزا ﺮﯾ
ترﻮﺼﺑ رﺎﺗ دﻮﺷﯽﻣهﺪﯾد
. اﺎﺑ ﻦﯾ دﻮﺟو ، ﮏﯾ شور ﻪﮐ مﺎﻧﻪﺑ ﻞﯿﻤﮑﺗ ﻪﻘﻄﻨﻣ هدﺎﻔﺘﺳاﺎﺑهﺪﺷرادﻪﮑﻟطﺎﻘﻧندﺮﮐﺮﭘياﺮﺑيا
ﺖﺳاهﺪﺷﯽﻓﺮﻌﻣبﻮﯿﻌﻣيﺎﻫﻪﻄﻘﻧزا
. ﮏﯾﻦﯾا ﺪﺟشور ﺪﯾ اﺮﺑ ي امﺎﺠﻧا ﻦﯾ ﻠﻤﻋ تﺎﯿ اردﻪﮐﺖﺳا ﻦﯾ
ﺖﺳاهﺪﺷﻪﺋاراﻪﻟﺎﻘﻣ
.
ﻪﻠﺣﺮﻣﻪﺳ ﻢﻬﻣ اردﻪﮐ ﻦﯾ ﭘرﺎﮐ دﺎﻬﻨﺸﯿ ﺖﺳاهﺪﺷ زاﺪﻧاترﺎﺒﻋ
: هزاﺪﻧابﺎﺨﺘﻧا ﻪﮑﺗ ، وﯽﯾﺎﺳﺎﻨﺷ ﻘﺑﺎﻄﻣ ﺎﻫﻪﮑﺗندادﺖ ﺎﺑ
زاهدﺎﻔﺘﺳا يﺎﻫهﺪﻨﻫدلﺎﻘﺘﻧا ياﻪﻠﺣﺮﻣﺪﻨﭼيﺮﯾﺬﭘﮏﯿﮑﻔﺗ
ﺪﻨﻧﺎﻣ
(Wavelet and Contourlet transforms)
ردو ﺎﻬﻧ ﺖﯾ ﻌﺗ ﻦﯿﯿ ﺴﻣ ﺮﯿ ﺮﺘﻤﮐ ﻦﯾ ﺰﻫ ﻪﻨﯾ .
ﺑﻮﺧﻪﺑقﻮﻓشور ﯽ يور ﺎﻫﻪﻧﻮﮔ ي وﺎﺼﺗﻒﻠﺘﺨﻣ ﺮﯾ ﺘﻓﺎﺑ ﯽ مﺎﺠﻧا دﻮﺷﯽﻣ . ﺎﺘﻧ ﺞﯾ ﺖﺳدﻪﺑ