190
This work is licensed under Creative Commons Attribution 4.0 International License.
Behavioral Aspects of IT Employees towards Problems and Prospects of
Activity Based Costing (ABC)
Dr. N. Narsaiah
Assistant Professor, Accounting Department, Cihan University-Erbil, Kurdistan, IRAQ
Corresponding Author: [email protected]
ABSTRACT
Activity Based Costing (ABC) is a new variant in cost management practices emerged in 1980’s, which caters to the needs of organizations in effective control and monitoring cost and better management of profitability. The success of ABC duly depends on articulation of implementation of ABC and the outcome of Activity Based Cost and Management (ABCM). Though employees experience a positive outcome, it is beyond doubt that they can support the ABC rather resisting the same. The main objective of this paper is to examine the perception of IT companies’ employees’ towards implementation of Activity-Based Costing(ABC). A normative list of benefits concerning the ability of ABC systems to redirect the behavior of individuals was abstracted from the interviews opinion and compared to the perceived benefits gathered from interviews with firm employees. This will permit IT Companies and provides relevant information that will enable them to make better decisions with regard to measure the successful implementation of ABC in IT Companies.
Keywords-- Activity Based Costing, Information Technology, Behavioral Aspects, Implementation, Adoption
I.
INTRODUCTION
Information Technology (IT) companies seems to be functioning moderately different due to the production and services system in IT companies is divided entirely into invisible part and a lineup of visibility. The invisible component consists of such items as systems support, management support and physical support. The visible component is more or less visible to the customers or clients who usually participate in the production and services process. IT companies are not succeed to complete projects and delivering services in time because benefits of the time and costs not saved by employees. In other words, the system fails to achieve its objectives due to the failure of other components i.e., strategic cost management for this IT companies employing modern cost management systems, such as Activity Based Costing (ABC). IT Companies may be more motivated to utilize ABC as it is ascertained accurate cost of products and services through the use of different cost driver rate, if they have a high
potential for cost distortions. But, very numerous example of a significant distortion risk is if an IT companies were to exercise only one overhead base. As a result of doing this, under or over costing of products and services may take place. Cost distortions have the ability to affect many important decisions, including those related to profitability analyses. By placing ABC in IT Companies may have the ability to determine whether all of their stakeholders are profitable or else. Thus, it leads to IT companies business from unprofitable stakeholders to increase their margins.
This modest research also brings about relatively factors of IT companies success is more complex even though after using ABC system and this practice merely not be sufficient to provoke positive reactions by employees. It is also shows potential to trace more complex combination of factors and which are essential to construct IT companies’ successful. Therefore, specifically try to identify such supporting features by using behavioral aspects of IT employees. Behaviors show the way to consequences, which may be positive, negative or sometimes a combination of both. The consequences may be for the single person involved, group of people, and the companies in general or administrative people. For motivational purposes, the consequences for the persons involved are most important. The rational decision making is possible to IT companies through employee’s opinion regarding ABC system deployment to attain accurate cost ascertainment and ensuring considerable profits.
II.
ACTIVITY BASED COSTING (ABC)
191
This work is licensed under Creative Commons Attribution 4.0 International License.
Besides, ABC allows costs to be apportionedthrough the actual activities based on resources consumed (Turney, 1996). As far as research carried out by King, A.M. (1991), Johnson and Mitchell (1994), and Demmy, Talbott, Robert and Silvester (1996), emphasized that the benefits and advantages for the Activity-based Costing (ABC), which was also elaborated, ABC system focusing on accurate cost ascertainment, cost reduction, performance measurement and improve the different cost objects. In the words of Everaert,P., G.Cleuren and S.Hoozee(2012) also found that the disadvantages or limitation of the new cost system such as the Activity-based costing (ABC) can be expensive to implement and maintain, both in terms of time and money.
In implement of ABC system in manufacturing or service-oriented organization the first and foremost step is to be identifying the activities, which becomes the most important point of the costing system. ABC system follows two stages for resources allocation to cost objects. Asin the first-stage allocation of resources to activity cost pools or groups of activities called activity centers by using appropriate resource drivers (Blocher,E., B.Wong, C.T.Mckittrick 2002) and (Sergeant 2017). The second-stage allocation is an activity cost assignment process by which the costs of activities are assigned to cost objects through using appropriate activity drivers. However, it can discover that ABC quite differs from traditional costing systems in two ways; in first stage, cost pools are defined as activities or activity centers rather than cost centers. In addition, in the second stage, the cost drivers are used to assign activity costs to cost objects because an activity driver shows cause-effect relationships. But the traditional approach uses a single volume-based driver that often bears little or no relationship to either the resource cost or the cost object.
III.
REVIEWOF LITERATURE
In recent years the researchers focused on ABC system and inferences drawn from them since, promoted to organizations as a foundation for making strategic decisions in terms of improving profit, cost management and performance of the employees. Specifically, it is found through the review of literature:
Kocalkulah, M. (2007)1 ABC implementation opined that rapid and wide acceptance and there is significant variety of opinion regarding the efficiency of ABC. The involvement of ABC system in the organization leads to the better improvement of an organization’s decisions making from bottom line to top line.
Kaplan & Cooper, (1998)2 emphasized that ABC uses different cost drivers to link costs to cost objects, thereby linking costs to variety and complexity of products or services, and not follow merely product volumes.
Therefore, it is leads to accurate costs ascertainment and better profit management.
Tarr, (2001a)3 has focused that ABC adds the most value to anorganization when it is used as information basis of managing and improving business.
Dodd, Lavelle and Margolis, (2002)4 stated that ABC system provides to the companies about accurate cost information, which leads to improving profit and performance measurement of activities, products/services because it is a powerful tool over the traditional cost method.
Pineno, C. J. (2012)5 described about the time driven ABC system provides a means of enhancing profitability.
Rafig and Garg, (2002a)6 found in their recent studies that there is a robust relationship between improved performance and implementation of ABC.
Roztocki and Needy, (1999a)7 have informed that ABC is a reliable cost analysis method, which is a highly effective tool for strategic decision-making.
IV.
NEED FOR THE STUDY
In present competitive economic environment running the organizations in the path of an efficient manner with considerable profits is a massive challenge. Hence, the financial success of an organizations has duly depends on the understanding, role play and involvement of employees in the business strategies, particularly, cost management strategies. Therefore, a direneed is there to focus on new and innovative cost management strategies for betterment with understanding and perception of employees. As per as its success concerned, because, without involvement of employees and the intelligence towards cost management the concerned cannot work appropriately.
This study has done based on the employee’s perception of top most five IT companies operating in India as well branches situated in Hyderabad also. ABC is an instrumental to better understanding of the relationship between cost and activities of an organization. Obviously, the present study attempts to analyses the behavioral aspects of select IT companies employee’s through perceptional analysis.
V.
OBJECTIVES OF THE STUDY
192
This work is licensed under Creative Commons Attribution 4.0 International License.
1. To study the perceptions of IT companiesemployee’s awareness with regard to implementation of ABC in their organizations. 2. To study the perception of select IT companies’
employee’s towards impact of ABC on financial performance of their companies.
3. To study the perception of employees of select IT companies towards decision action changed by ABC.
4. To study the perception of employees of select IT companies towards problems and prospects of ABC method.
VI.
HYPOTHESES OF THE STUDY
In order to ascertain the objectives, the study formulated and examined following Hypotheses:
Ho 1: There is no significant difference in the perception of
employees of IT Companies towards impact of ABC on financial performance of their companies.
Ho 2: There is no significant difference in the perception of
employees towards results of decision action changed by ABC.
VII. DATA SOURCES AND RESEARCH
METHODOLOGY
The present study is exploratory and descriptive study, and conducted among top five IT companies as market capitalization selection criteria. The main source of data is of primary in nature that has been collected through qualitative questionnaire administered to select IT
companies’ employees to determine the state of Activity Based Costing practice in IT companies. This research was taken around six months and validity of the data collected from the October 2015 to March 2016 years at Hyderabad, Telangana State-India because, Hyderabad location is one of the utmost focal point for Information Technology in the entire world. The analysis of data is presented through the tabulations, percentages, and pie-diagrams, on the other hand authenticity of findings were examined through ANOVA (One-way). The discussions involved numerous questions both closed ended and open-ended. The main strength of these types of questions is that they allowed to the respondent(s) freedom in answering questions and the chance to provide their in-depth responses.
VIII. SAMPLESIZE AND SELECTION
PROCEDURE
Initially, five top IT companies based on market capitalization have been selected as sample companies. Further, to analyses the behavioral aspects of IT employees over the role and impact of ABC in IT Companies, from each and every selected company 20 employees, all together, 100 employees are taken as sample through convenience sampling method. The reason of selection is due to the fact that they are in contact with a cross-section of the company's members and can provide the necessary technical and organizational detail regarding the implementation of ABC in IT companies. Hence, sample units and sample size of the study have given are as follows:
S.NO NAME OF THE COMPANY SAMPLE SIZE
1 Tata Consultancy Services (TCS) 20
2 Wipro IT Company 20
3 Infosys Technologies 20
4 Tech Mahindra 20
5 HCL Technologies 20
IX.
SUMMERY OF ANALYSES,
DISCUSSIONS AND FINDINGS
9.1. Gender Profile
The information regarding to gender of the IT companies employee’s respondents is presented in the following table 1. In the Indian IT companies’ perspective,
193
This work is licensed under Creative Commons Attribution 4.0 International License.
Table-1 Gender Profile& FigureSource: Primary Data
9.2. Age Profile of IT Employees
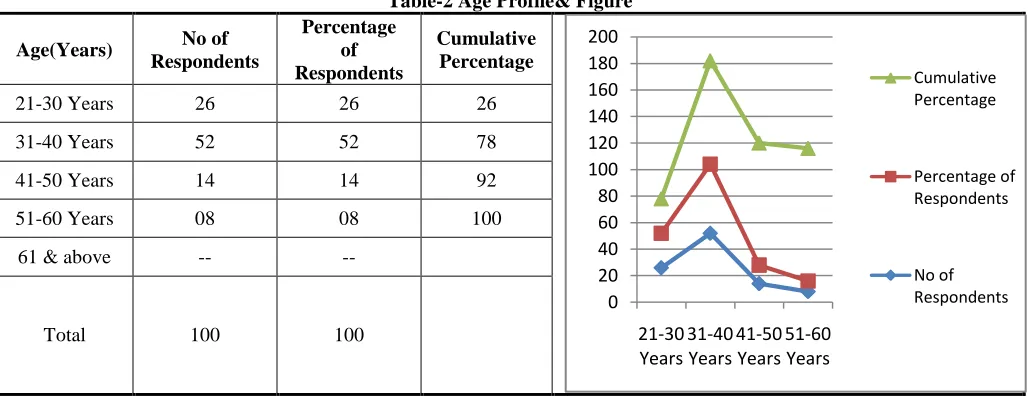
The information related to age of the sample respondents presented in the following table 2.26 per cent of the sample respondents are in the age group of 21-30 years, and the result of this study showing that a majority of the workforce 52 per cent belonging to the age group of
31-40 years, followed by 14 per cent and 8 per cent of employee’s respondents related to age group of 41-50 and 51-60 years respectively. Moreover no one of the respondent’s age group of 61 years above because IT companies are not encouraging over the age of 60 years.
Table-2 Age Profile& Figure
Age(Years) No of Respondents
Percentage of Respondents
Cumulative Percentage
21-30 Years 26 26 26
31-40 Years 52 52 78
41-50 Years 14 14 92
51-60 Years 08 08 100
61 & above -- --
Total 100 100
Source: Primary Data
9.3. Education Profile of IT Companies Employees
The respondents were asked to state their level of Education. The responses are presented in the following table 3.Through the research found on the education front, 48 per cent of employees completed their post- graduation, 25 per cent have completed their professional courses such
as CA/CMA & CS Inter/Executive level, 24 per cent of employees related graduation level and 3 per cent employees completed their CA/CMA & CS and finally 2 per cent of the employees completed their Doctor of Philosophy.
0 20 40 60 80 100 120 140 160 180 200
21-30 Years
31-40 Years
41-50 Years
51-60 Years
Cumulative Percentage
Percentage of Respondents
No of Respondents Gender No of
Respondents
Percentage of Respondents
Cumulative Percentage
Male 65 65 65
Female 35 35 100
Total 100 100
Percentage of Respondents
Male
194
This work is licensed under Creative Commons Attribution 4.0 International License.
Table-3 Education Profile& FigureEducation
No of Respond
ents
Percentage of Respondents
Cumulative Percentage
Graduation
(B.com/BBA/BBM) 22 22 22
Post Graduation
(M.com/MBA) 48 48 70
CA/CMA & CS
(Inter/Executive Level) 25 25 95
CA/CMA & CS 3 3 98
Ph.D 2 2 100
Total 100 100
Source: Primary Data
9.4. Designation Profile of IT Companies Employees
The respondents were asked to state their designation. Their responses are presented in the table 4 below. First and foremost, over the designation front, 56 per cent respondents were Executives; followed by 31 per cent were Team leaders, 9 per cent found as Managers and finally 4 per cent employees are Senior Managers.
However, finally this study concluded that majority of the IT companies’ respondents are Executives. Employees from all levels of the management hierarchy are required to participate in ABC practice and implimitation. Managers or senior Managers were comprising a small percentage of the aggregate.
Table-4 Designation Profile& Figure
Designation
No of Respon
dents
Percenta ge of Respond
ents
Cumulat ive Percenta
ge
Executive 56 56 56
Team Leader 31 31 87
Managers 9 9 96
Senior
Managers 4 4 100
Total 100 100
Source: Primary Data
9.5. Experience Profile of IT Companies Employees
The respondents are inquired about their experience. Employees who participated in the survey varied in experience from less than 1year to more than 10 years. The details of the responses are presented in the following table 5. It is clearly showing that 42 per cent of respondents have
5-10 Years’ experience, followed by 33 per cent employees consist of 1-5 Years’ experience, Less than 1 Year of 14 per cent and More than 10 years’ experience by 11 per cent of employees. It is found through the analysis that more than 5 years employees are deployed in ABC implimitation in the IT companies.
0 20 40 60 80 100
No of Respondents Percentage of Respondents Cumulative Percentage
0 20 40 60 80 100
No of Respondents
Percentage of Respondents
195
This work is licensed under Creative Commons Attribution 4.0 International License.
Table-5 Experience Profile& FigureSource: Primary Data
9.6. Adopting ABC System
ABC method and its adaptation will differ from one company to another company as the nature and size of such company differs particularly this is so high in IT sector. Data collected in this regard from respondents is analyzed and the information related to adopting ABC
system of the IT companies is presented through table 6. It is evident shows from the table that 72 per cent of the sample respondents stated that their companies adopted ABC system. Whereas 28 per cent of respondents opined that their companies are still not in such awareness about adopting ABC system for IT products and services.
Table-6 Adopting ABC system& Figure
Responses No of Respondents
Percentage of Responses
Yes 72 72
No 28 28
Total 100 100
Source: Primary Data
9.7. Management Style of the Organization in Implementing ABC
Management style of the select IT companies in implementing ABC differs from one company to another as per the company policies. In this regard the data collected from the employees is analyzed and presented through table
7.It is found that 49 per cent of the employees of the select IT companies revealed that the management style of their organization in implementing ABC is Democratic, whereas 16 per cent respondents opened that they can find Dictatorial and Liaise Fare style. On the other hand 19 per cent of respondents said that they find Autocratic style.
Table-7 Management Style of the Organization in implementing ABC& Figure 0
20 40 60 80
No of Responses
Percentage of Responses
Yes
196
This work is licensed under Creative Commons Attribution 4.0 International License.
9.8. Management Commitment to ABC
The information covered from employees regard to how the companies are giving priority to applying ABC system and their opinion presented through the table 8. Perception of the respondents on the management
commitment to ABC is found as 41 per cent by high priority, 32 per cent of respondents felt as some priority, 16 per cent respondents felt as Low priority, and 11 per cent of respondents felt as Top priority hence, finally no body responded to the opinion of not priority.
Table-8 Management commitment to ABC & Figure
Response Frequency Cumulative Frequency
Not a priority 0 0
Low priority 16 16
Some priority 32 48
High priority 41 89
Top priority 11 100
Total 100
Source: Primary Data
9.9. ABC Implementation on Communication of the Objectives and Rationale for the Projects
In order to examine the responses about ABC implementation on communication of the objectives and rationale for the projects the data has been analyzed and presented in the following table 9.It is ascertained that 32
per cent of responses on ABC implementation on communication of the objectives and rationale for the projects as Good, 28 per cent of respondents felt as average; 22 per cent of respondents felt as Fair, hence, 12 per cent of respondents opined as Poor and followed by 6 per cent of respondents felt as Excellent.
Table-9 ABC implementation on communication of the objectives and rationale for the projects& Figure
Response No of
Respondents
Total Score NA (0) 0 0 Poor (1) 12 12
Fair (2) 22 44 Average (3) 28 84 Good (4) 32 128
Excellent (5) 6 30
Total Score 100 298
Mean marks 2.98
Standard Deviation 32.66
Source: Primary Data
*NA = 0, P=1, F=2, A=3, G=4, E=5
9.10 ABC Implementation Commitment of Senior Executives
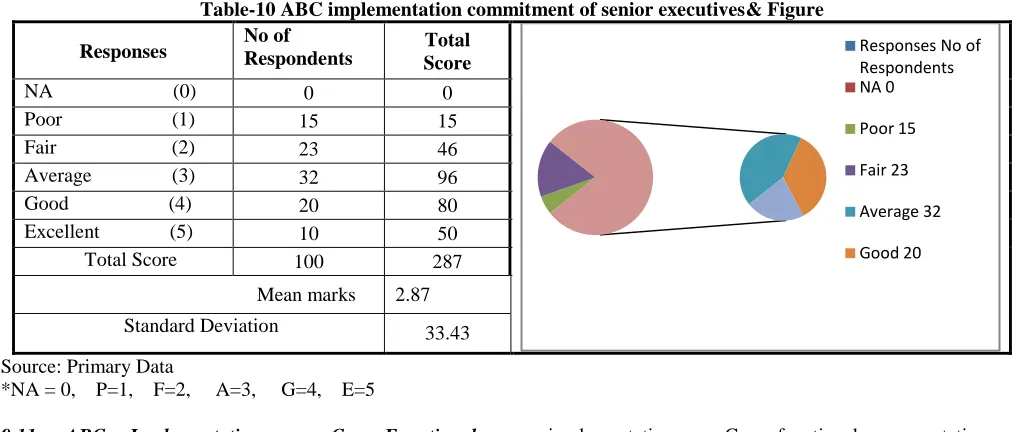
ABC system implementation commitment of senior executives in IT companies responses presented in the table 10.It is found that 32 per cent of respondents on
the ABC implementation commitment of senior executives felt as Average. Whereas 23 per cent of respondent opined as fair, 20 per cent of respondent felt as Good. On the other hand 15 per cent of respondents opined as Poor, hence, finally 10 per cent of respondents felt as Excellent. 0%
20% 40% 60% 80% 100%
Cumulative of Frequency Frequency
197
This work is licensed under Creative Commons Attribution 4.0 International License.
Table-10 ABC implementation commitment of senior executives& FigureResponses No of Respondents Total Score NA (0) 0 0 Poor (1) 15 15 Fair (2) 23 46
Average (3) 32 96 Good (4) 20 80 Excellent (5) 10 50 Total Score 100 287
Mean marks 2.87
Standard Deviation 33.43
Source: Primary Data
*NA = 0, P=1, F=2, A=3, G=4, E=5
9.11. ABC Implementation on Cross-Functional Representation on Project Team
The respondent’s information about the ABC implementation on Cross-functional representation on project team presented through the table 11.Through the table 32 per cent of respondents on the ABC
implementation on Cross-functional representation on project felt as Average, and subsequent 26 per cent of respondents found as Good. Whereas 21 per cent of respondents felt as Fair and followed by 12 per cent of respondents found as Poor, hence, finally 9 per cent of respondents Excellent.
Table-11 ABC implementation on Cross-functional representation on project team& Figure
Responses No of Respondents
Total Score
NA (0) 0 0 Poor (1) 12 12
Fair (2) 21 42
Average (3) 32 96
Good (4) 26 104
Excellent (5) 9 45
Total Score 100 299
Mean marks
2.99
Standard Deviation
42.578
Source: Primary Data
*NA = 0, P=1, F=2, A=3, G=4, E=5
9.12. ABC Implementation on Analysis Performed by Team of Activity and Product Cost
The responses are relevant to ABC implementation on Analysis performed by team of activity and product costs displayed in the following table 12.From the table 32 per cent of respondent on ABC implementation
on analysis performed team of activity and product cost found as Fair, whereas 23 per cent of respondent felt as Average, 17 per cent of respondent report as Good. On the other hand, 16 per cent of respondent felt as Excellent, hence, finally 12 per cent of respondent felt as Poor.
Responses No of Respondents NA 0
Poor 15
Fair 23
Average 32
Good 20
0 100 200 300 400
NA Poor Fair Average Good Excellent Total
198
This work is licensed under Creative Commons Attribution 4.0 International License.
Table 12 ABC implementation on Analysis performed by team of activity and product costs& FigureSource: Primary Data
*NA = 0, P=1, F=2, A=3, G=4, E=5
9.13. ABC System Support Overall Business Needs and Its Cross- Functional
The information regarding in IT companies current ABC system support overall business needs and its cross-functional verification between the departments presented in the table 13 below. From the table it is found that on ABC system supports overall Business needs and its Cross- Functional is responded by 35 employee’s average.
Whereas as 24 per cent of employees respondent as Fair, and 16 per cent of respondent felt as Poor, 13 per cent of respondent felt as Good. On the other hand 12 per cent of respondent felt as Excellent, hence, finally nobody respond for Not Available. It is inference that the ABC support the business needs including its cross functional issues considerably.
Table-13 ABC system support overall Business needs and its Cross- Functional& Figure
9.14. ABC Implementation on Understanding and Acceptance by Participants of the Key Activities
The respondents are inquired about their responses, whether ABC implementation on understanding and acceptance by participants of the key Activities recorded in following table 14. According to analysis
provided in the above mentioned table 14, respondent’s information reported that 32 per cent of employees strongly agree.ABC implementation on understanding and acceptance by participants of the key Activities, 24 per cent of respondent with Fair, 18 per cent of has Average, 16 per Responses No of
Respondents
Total Score
NA (0) 0 0
Poo (1) 12 12
Fair (2) 32 64
Aver (3) 23 69
Goo (4) 17 68
Excellent (5) 16 80
Total Score 100 293
Mean Marks 2.93
Standard Deviation
33.81
0 10 20 30 40 50 60 70 80 90
199
This work is licensed under Creative Commons Attribution 4.0 International License.
cent of respondents Poor, and 10 percent of Excellent and on the other hand nobody respondent for Not Available.
Table-14 ABC implementation on understanding and acceptance by participants of the key Activities& Figure
9.15. ABC and Decision Making
Consumers of products and service in IT companies are increasingly demanding accelerated delivery times and lower prices. Meanwhile Information Technology companies decision making play vital role because the technology and clients requirements change vey frequently hence, IT companies considering clients requirement while making decision. Therefore the information collected from employees about what area decision making uses ABC information presented through the Mean marks Standard Deviation and Ranks in the table 15.According to analysis provided in the table, it is found that majority of the decision making areas use ABC information. Ranks were allocated from highest mean marks to lowest mean marks; in this regard majority of the respondents with Planning
&Budgeting the mean marks is 4.4 got assigned 1st rank.On the other hand, respondents information reported for Product/Service development strategies and decisions got mean mark of 4.2 and took 2 nd rank, Identify opportunities for improvement got 3.8 marks and taken 3 rdrank, Restructuring/ Organization decision got 3.7 mean mark got assigned4 th rank, Outsourcing Decisions got mean mark 3.5 and got assigned 5thrank .The respondents were responded for Process / Operation Management and Product/Service Management were tied with equal mean marks 3.4 got assigned rank 6.5, Linked to performance measure decision got mean marks 3.3 and got assigned rank 8 th, Finally the decision area regarding Driving Process improvement effort got 3.2 mean marks took 9 th place.
200
This work is licensed under Creative Commons Attribution 4.0 International License.
9.16. Level of Personnel were Involved in the ABC Site Implementation
The respondents are inquired about their responses, what level of personnel were involved in the ABC site implementation to determine the those personnel were involved very effectively applying ABC to providing services to their clients with low cost of services and cost controlling of the IT companies. The details of the responses are given in the following table. Table 16
describes Mean marks and Standard deviation for level of personnel involved in the ABC site implementation. Managers on average agreed that their business units emphasize the strategies of on-time delivery of services, dependable delivery and high-quality products and services. The mean marks are 2.84, 2.71, 2.55, 2.60, 2.47, and 2.39 respectively in the involved levels of personnel on the ABC site implementation. The involvement of personal in ABC is very considerable.
Table-16 Level of personnel were involved in the ABC site Implementation& Figure
Level of personnel involved
Mean Marks
Standard
Deviation Ranks
Senior management 2.84 40.76 1
Senior finance personnel 2.71 30.75 2
Operations Managers 2.55 28.32 4
Function Groups managers
2.6 29.75 3
Supervisors /team leaders 2.47 26.43 5
Line personnel 2.39 30.90 6
Source: Primary Data* Scale NA=0, NI=1, SI=2, Mod I= 3, VI=4 EI=5,
**NA= Not Applicable, NI=Not Involved, SI= Somewhat Involved, Mod I = Moderately Involved, Very Involved, Extremely Involved.
9.17. Functional Groups were Involved in the ABC Site Implementation
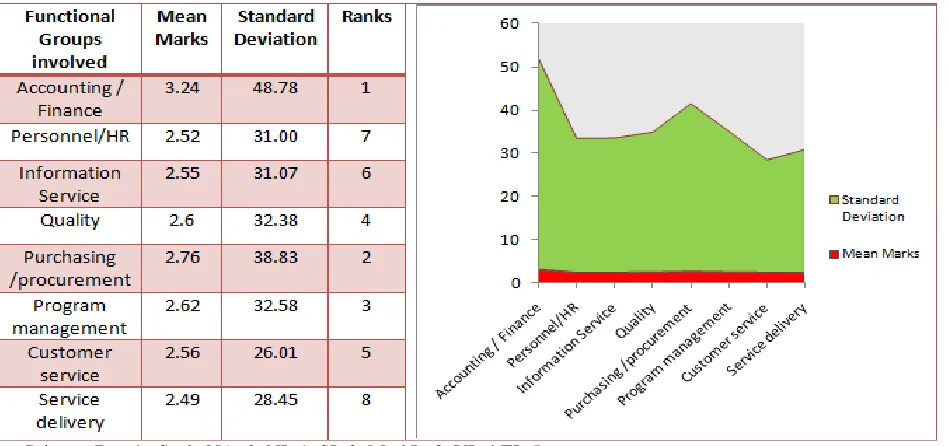
ABC applications in the select IT Companies are the main subjects in which ABC information is used to aid decision making. Extending the use of ABC applications leads to a large number of decision actions. However, ABC functions refer to those departments that have access to the ABC system. The more managers use ABC information, whether indifferent applications or different functions, the greater the number of expected actions. The information collected from the employees that how effectively involved in different functional departments while implementing ABC, the responses regarding various functional departments were involved in the ABC site implementation and analyzed and presented through table 17.It is observed from the table, that Accounting and Finance departmental
group were involved in front by mean score of 3.24 and obtained first rank on the ABC site implement, Purchasing /procurement department group got mean score of 2.76, and it is getting by second rank. Program management group getting mean score of 2.62 and secured third rank, Quality department groups were involved in ABC site implementation by mean marks of 2.6 and got fourth rank. Customer service department involved in ABC site implementation by mean score of 2.56 and got fifth rank, Information Services got 2.55 mean score and this department involved in ABC site implementation at sixth rank, Personnel/HR department involved by 2.52 mean score with seventh rank, finally Service delivery department reported mean score of 2.49 attain eighth rank with 28.45 standard deviation.
0 5 10 15 20 25 30 35 40 45
Mean Marks
201
This work is licensed under Creative Commons Attribution 4.0 International License.
Table-17 Functional Groups were involved in the ABC site implementation& FigureSource: Primary Data* Scale NA=0, NI=1, SI=2, Mod I= 3, VI=4 EI=5,
**NA= Not Applicable, NI=Not Involved, SI= Somewhat Involved, Mod I = Moderately Involved, Very Involved, Extremely Involved.
9.18. Type of Training for Users of the ABC System
Training is an important factor driving ABC success in IT companies in the application of the ABC system. Without training, problems are expected during the design, implementation and usage of ABC systems. Information collected from employees about the selected IT companies type of training is being provided for users of the ABC system is analyzed and presented through table 18. Table reveals that majority of the employee’s responses
regarding type of training is being provided for users of the ABC system. 28 per cent respondents were having only conceptual understanding, 25 per cent of employees were at implementation steps, 22 per cent of respondents for Applications/users, 13 per cent were for Mechanics of ABC System, 9 and 3 per cent of respondents were responded that In-house seminars and Public Seminar respectively are very essential in the training.
Table-18 Type of training is being provided for users of the ABC system& Figure
202
This work is licensed under Creative Commons Attribution 4.0 International License.
X.
HYPOTHESIS TESTING
Ho1: There is no significant difference in the perception
of employees of select IT Companies’ towards impact of ABC over financial status of their companies.
The discussion about the any significant difference in the perception of employees of select IT companies towards impact of ABC over financial status of their companies, the ANOVA (one-way) was employed to test the results. From the employees data collected and processed in mean marks over the Overhead, Service efficiency, Customer satisfaction, Program/Service design and Program /Service delivery presented in the table 19.
Table-19 Perception of employees of IT companies towards impact of ABC over financial status of their companies.
TCS Wipro
Ltd
Infosys Ltd
Tech Mahindra
HCL
Overhead Support 3.2 3.5 3.35 3.45 3.45
Service efficiency 3.15 3.55 3.25 3.2 3.65
Customer Satisfaction 3.25 3.2 3.05 3.35 3.15
Program/Service design 3.1 3.4 3.05 3.4 3.4
Program /Service delivery 3.3 3.45 3.05 3.35 3.45
Total 16 17.1 15.75 16.75 17.1
j 3.2 3.42 3.15 3.35 3.42
Source: Primary Data
*Scale NI=1, MI=2, Mod I=3, EI=4, SI=5
**NI= No Improvement, MI= Minor Improvement, Mod I = Moderate improvement, EI=Extensive improvement, SI= Significant improvement.
10.1 Results of Anova: Single Factor
SUMMARY
Groups Count Sum Average Variance
3.2 4 12.8 3.2 0.008333333
3.5 4 13.6 3.4 0.021666667
3.35 4 12.4 3.1 0.01
3.45 4 13.3 3.325 0.0075
3.45 4 13.65 3.4125 0.042291667
ANOVA
Source of Variation SS df MS F P-value F crit
Between Groups 0.29 4 0.0725 4.03712297 0.020373319 3.055568276
Within Groups 0.269375 15 0.017958
Total 0.559375 19
Source: Computed in Excel v 2007
Computed F-test value is compared to critical value in order to determine whether to accept or reject the
203
This work is licensed under Creative Commons Attribution 4.0 International License.
19. The critical F - value for perception of employees ofselect IT companies towards impact of ABC over financial status of their companies is found in column 4 and row 20. Thus,
F 0.05(4, 24) = 4.03712297
The hypothesis of perception of employees of select IT companies towards impact of ABC over financial status of their companies, states that the computed F- value is4.03712297, which is higher than the critical value of F=3.055568276. So the hypothesis is rejected. The conclusion is that the perception of employees of select IT companies towards impact of ABC over financial status of their companies is significantly differing.
XI.
HYPOTHESIS TESTING
Ho2: There is no significant difference in the perception
of employees towards results of decision action changed by ABC information.
In ordered to understand whether there is any significant difference in the perception of employees towards results of decision action changed by ABC information, the ANOVA (one-way) test was employed. The data collected from the opinions of the employees is analyzed in terms of mean marks to test the hypothesis.
Table-20 Perception of employees towards results of decision action changed by ABC information
Types of Decision TCS Wipro
Ltd
Infosys Ltd
Tech
Mahindra HCL
Changed pricing and
cost recovery strategies 3.4 3.25 3.15 3.65 3.6
Changed custom support
or services 3.1 3.75 3.15 3.9 3.35
Changed process 2.95 3.15 3.35 4.05 3.2
Outsourcing activities
or processes 3.25 3 3.4 3.65 3.15
Changed program delivery
channel 3.1 3 3.7 3.35 2.95
Changed strategies focus 3.2 3.2 3.2 3.25 3.3
Reorganized/restructure 3.45 3.4 3.2 3.45 3.15
Total 22.45 22.75 23.15 25.3 22.7
j 3.20 3.25 3.307 3.61 3.24
Source: Primary Data
*Scale NC=1, MC=2, Mod C=3, SC=4, VSC=5
**NI= No Changes, MI= Minor Changes, Mod C = Moderate Changes, SI= Significant Changes, VSC=Very Significant Changes
11.1 Results of Anova: Single Factor
SUMMARY
Groups Count Sum Average Variance
3.4 6 19.05 3.175 0.02875
3.25 6 19.5 3.25 0.082
3.15 6 20 3.333333333 0.041666667
3.65 6 21.65 3.608333333 0.100416667
3.6 6 19.1 3.183333333 0.019666667
ANOVA
Source of Variation SS df MS F P-value F crit
204
This work is licensed under Creative Commons Attribution 4.0 International License.
Within Groups 1.3625 25 0.0545
Total 2.127 29
Source: Computed in Excel v 2007
Computed F-test value is compared to critical value in order to determine whether to accept or reject the hypothesis. The F-table gives the critical values. The distribution of F- values at the 5 % risk level, across the table 20. The critical F - value for perception of employees towards results of decision action changed by ABC information of their companies is found in column 4 and row 30. Thus,
F 0.05(4, 30) = 2.75871047
The Hypothesis of perception of employees towards results of decision action changed by using ABC information is tested through ‘F’ and found the computed F- value3.506880734, which is higher than the critical value of F=2.75871047.So the hypothesis is rejected. The conclusion is that the perception of employees towards results of decision action changed by using ABC information of their companies is differing a lot.
XII. CONCLUSIONS AND SUGGESTIONS
The study reports on the behavioral implications of the new cost management systems in general with a focus on ABC to the possible extent by employee’s perception. Also, the study enlighten in a comprehensive manner. The understanding of the behavioral consequences of IT companies’ employees towards ABC systems and it can facilitate implementation and future research regarding implementation and estimation of possibility to the extent of non - implemented areas of ABC. The present study provides information for the development and refinement of ABC as cost instrument and strategy.
ABC implementation process in IT companies is lacking by awareness among the employees as it is a strategic cost accounting method. Moreover, IT companies failed to create awareness about ABC in determining the cost and price of the products and services. So the companies should make the employees are the involved in ABC process in IT companies.ABC method can support the management in decision making area, whereas, IT companies comprehensively utilized ABC method in the case of Planning and Budgeting only. There is a need to apply ABC in other business areas also for better cost management with the employee participation.
REFERENCES
[1] Blocher,E., B.Wong, & C.T.Mckittrick.(2002). Making bottom-up ABC work at Reichhold. Inc. Strategic Finance (April), pp. 51-55.
[2] Demmy, S. & J. Talbott. (1998). Improve internal reporting with ABC and TOC. Management Accounting (November), pp. 18-20, 22 and 24. Available at:
https://maaw.info/ArticleSummaries/ArtSumDemmyTalbot t98.htm.
[3] Dodd, G. D. Lavelle, W. K., & Margolis, S. W. (2002). Driving improved profitability with activity- based costing.
An Executive White Paper: Economy ABC print. Madison, pp. 1-8.
[4] Emblemsvag, J. (2003). Life-cycle costing: using activity-based costing and monte carlo methods to manage future costs and risks. John Wiley & Sons.
[5] Emblemsvag, J. (2004). Activity-based costing and economic profit: Why, what and how. Cost Management (July/August), pp. 38-46.
[6] Everaert, P., G. Cleuren, & S. Hoozee. (2012). Using time -driven ABC to identify operational improvements: A case study in a university restaurant. Cost Management (March/April), pp. 41-48.
[7] Johnson, S.D. (1998). The ABCs of the electric utility industry. Management Accounting (Novemebr), pp. 25-26, 28, 30-32.
[8] Kaplan, R. S & R. Cooper. (1998). Cost & effect: Using integrated cost systems to drive profitability and performance. Bostan, MA: Harvard Business School Press. [9] King, A.M. (1991). The current status of activity-Based costing: An interview with Robin Cooper and Robert S. Kaplan. Management Accounting (September), pp. 22-26. [10] Kocalkulah, M. (2007). ABC implementation for the small service company, Cost Management (March/April), pp. 34-39.
[11] Mitchell, F. (1994). A commentary on the application of activity-based costing. Management Accounting Research (September), pp. 261-277.
[12] Pineno, C. J. (2012). Simulation of the weighting of balance scorecard metrics including sustainability and time-driven ABC based on the product life cycle. Management Accounting Quarterly (Winter), pp. 21-38.
[13] Rafig, A. & Garg, A. (2002 a) Using Activity based costing to improve performance. Bank Accounting and Finance, 15(6), 4-5.
205
This work is licensed under Creative Commons Attribution 4.0 International License.
[15] Roztocki, N. & Needy, K. L. (1999a). Integratedactivity based costing and economic value added in manufacturing. Engineering Management Journal, 11(2), 17-22.
[16] Sergeant, A. (2017). Consolidated western wear retailers: Regression analysis to understand cost drivers in a purchasing department. IMA Educational Case Journal, 10(4), 1-3.
[17] Tarr, J. D. (2001a). Activity based costing in the information age. The ACA Group. Newhall. Available at: http://www.theacagroup.com/activitybasedcosting.htm.28/0 2/2003.
[18] Turney, P.B.B. (1989). Using activity-based costing to achieve manufacturing excellence. Journal of Cost
Management (Summer), pp. 22-31.
[19] Turney, P.B.B. (1990). What is the scope of activity-based costing?. Journal of Cost Management, (Winter), pp 40-42.
[20] Turney, P.B.B.(1990). Ten myths about implementing an activity-based costing system. Journal of Cost Management (Spring), pp. 24-32.
[21] Turney, P. (1996). Activity based costing: The
performance breakthrough. London, UK: Kogan Page.