Geschke Center
Master's Theses Theses, Dissertations, Capstones and Projects
Spring 5-17-2015
Detection of HCMV viral IL-10 (vIL-10) in
healthy blood donors
Vivian P. Young
University of San Francisco, [email protected]
Follow this and additional works at:https://repository.usfca.edu/thes
Part of theBiology Commons,Immunology and Infectious Disease Commons, and theVirology
Commons
This Thesis is brought to you for free and open access by the Theses, Dissertations, Capstones and Projects at USF Scholarship: a digital repository @ Gleeson Library | Geschke Center. It has been accepted for inclusion in Master's Theses by an authorized administrator of USF Scholarship: a digital repository @ Gleeson Library | Geschke Center. For more information, please [email protected].
Recommended Citation
Young, Vivian P., "Detection of HCMV viral IL-10 (vIL-10) in healthy blood donors" (2015).Master's Theses. 155.
i Abstract
Human cytomegalovirus (HCMV) is widespread in the general population and can
establish lifelong latency with expression of a limited subset of viral genes. The
UL111A gene is expressed during both lytic and latent infection, and at least two protein
isoforms are produced. During lytic infection, the full length transcript yields cmvIL-10, a
potent immunosuppressive viral ortholog of human IL-10 (hIL-10). Alternative splicing
of the UL111A transcript yields a truncated protein, LAcmvIL-10, which is expressed
during both lytic and latent infection but with a limited range of immunosuppressive
functions. The two viral cytokines, collectively termed viral IL-10 (vIL-10), are identical
in amino acid sequence through C127, then divergent at the C-terminus. A sensitive
and specific ELISA was developed to detect both vIL-10 isoforms in supernatants from
transfected and virus-infected cells. Specimens from healthy blood donors were tested
for HCMV serostatus and vIL-10 levels. Of the thirty seropositive donors, twenty had
detectable plasma vIL-10 levels while ten had no detectable vIL-10 levels. The results
suggest that the custom vIL-10 ELISA was effective in detecting plasma vIL-10 and that
vIL-10 is produced at measurable levels in healthy adults. Ultimately, these findings
may provide a snapshot of viral protein expression during latency and help characterize
the interplay between the two isoforms of vIL-10 with respect to productive and latent
ii
Table of Contents
Abstract………..………i
Table of Contents………...………...….………...……ii
List of Figures and Tables………...………...……….……..iv
List of Abbreviations………...……….…vi
Introduction………..…………...…1
Material and Methods………..…10
I. Cells, Viruses, and Reagents……….………..………..…10
II. Virus Infection………..……..………...12
III. Transient transfection………...………..……….12
IV. Western blot……….………..………...……14
V. Blood preparation………...………..………14
VI. Enzyme-Linked Immunosorbent Assay (ELISA)……..………..….14
i. Sandwich ELISA – vIL-10 detection………....……….14
ii. Sandwich ELISA – Host cytokine detection……….………15
iii. Indirect ELISA – vIL-10 antibody detection………...………..16
iv. HCMV IgG and IgM – HCMV serostatus determination………...……..16
VII. Polymerase Chain Reaction (PCR)………...………...…..17
Results………..………..17
I. vIL-10 ELISA development………..…...17
II. Specificity to vIL-10……….…….………...…….21
III. vIL-10 detection during virus infection………..………21
IV. vIL-10 detection in transfected cells………..23
iii
VI. vIL-10 levels in blood donors …..………..…28
VII. Host cytokine levels in blood donors………...……….……….31
VIII. Anti-cmvIL-10 antibodies in blood donors………35
IX. HCMV DNA detection………..35
Discussion………..……..…….37
iv
List of Figures and Tables
Page Number
Figure 1 HCMV virus particle……….……….……….3
Figure 2 The IL-10 receptor complex (IL-10R)………....….6
Figure 3 HCMV-infected cells release cmvIL-10…………..………...8
Figure 4 The UL111A gene products………...………..……9
Figure 5 pcDNA3.1 vector map………...………..13
Figure 6 A schematic diagram of a Sandwich Enzyme-Linked Immunosorbent Assay (ELISA) ……… Figure 7 Optimization of vIL-10 ELISA capture antibody………..……….20
Figure 8 Specific detection of purified vIL-10 protein and proteins during infection……….22
Figure 9 Detection of both isoforms during transfection………..…………24
Figure 10 Initial LAcmvIL-10 ELISA development ………..……….….26
Figure 11 Serum levels of vIL-10 can be measured………...………27
Table 1 Summary of donor information…………...……….29
Figure 12 Detection of vIL-10 in human plasma………...………..30
Figure 13 vIL-10 levels based on categories………...………32
v
Table 2 Summary of plasma cytokine levels………...………33
Figure 14 Host cytokine plasma levels and correlations …………....…………...34
Figure 15 Correlations with antibodies against vIL-10………..………...…………36
Figure 16 vIL-10 levels in seropositive and seronegative donors……….38
Figure 17 vIL-10 protein and HCMV DNA is detected in some
vi
List of Abbreviations
AIDS acquired immunodeficiency syndrome
AP alkaline phosphatase
BSA bovine serum albumin
CMV cytomegalovirus
cmvIL-10 Human cytomegalovirus interleukin 10
CREB cAMP response element-binding protein
E Early (gene)
ebvIL-10 Epstein-Barr virus interleukin 10
ELISA Enzyme-Linked Immunosorbent Assay
FBS fetal bovine serum
gDNA genomic DNA
gH glycoprotein H
GM-Ps granulocyte macrophage progenitor cells
HCMV Human cytomegalovirus
HEK293 human embryonic kidney cells
hIL-10 human interleukin 10
HIV Human immunodefiency virus
HRP horseradish-peroxidase
HVEM herpesvirus entry mediator
IE Immediate-early (gene)
IFN-γ Interferon-gamma
IgG Immunoglobulin G
IgM Immunoglobulin M
IL-6 human interleukin 6
vii
IL-10R interleukin 10 receptor
IL-12 human interleukin 12
JAK Janus kinase
kDa kilodaltons
LAcmvIL-10 latency-associated Human Cytomegalovirus interleukin 10
L Late (gene)
LPS lipopolysaccharide
LUNA Latency unique natural antigen
MAPK MAP kinase
MHC major histocompatibility complex
MIEP major immediate-early promoter
MOI multiplicity of infection
NuFF-1 newborn human foreskin fibroblasts
OD optical density
PBMC peripheral blood mononuclear cells
PBS phosphate buffered saline
PCR Polymerase Chain Reaction
SBE STAT-binding elements
SDS-PAGE sodium dodecyl sulfate-polyacrylamide gel electrophoresis
STAT Signal Transducer and Activator of Transcription
TBS-T Tris-Buffered Saline and Tween 20
THP-1 Human monocyte leukemia cell line
TNF-α tumor necrosis factor-alpha
TYK tyrosine kinase
UL unique long
US unique short
1 Introduction
Human cytomegalovirus (HCMV) is a member of the virus family Herpesviridae,
subfamily Betaherpesvirinae. HCMV is highly prevalent in the population, affecting
about 50-100% people worldwide and 50-85% of adults in the United States (1, 2). The
virus is transmitted through exchange of bodily secretions such as blood, saliva, cervical
secretions, semen, and breast milk (3). Thus, common mechanisms of transmission of
HCMV include breast-feeding, sexual exchange, and blood transfusions. After initial
exposure to HCMV, there may be an incubation period of 4-12 weeks (4). In
immunocompetent people, HCMV infection often goes unnoticed because it is
asymptomatic and usually will not result in disease (5). However, in
immunocompromised patients, such as newborns, the elderly, acquired
immunodeficiency syndrome (AIDS) patients, and organ transplants recipients, HCMV
infection may cause clinical diseases that can be life-threatening (6-13).
HCMV is the most common congenital infection with a live birth prevalence of 1%
worldwide and 0.6-0.7% in developed countries (14, 15). Congenital CMV infection
leads to many types of birth defects, such as brain damage, hearing loss, vision loss,
and even death (2, 16). In the United States, approximately 40,000 babies are born with
congenital CMV (17). Among these, about 400 cases of congenital CMV are fatal while
approximately 8,000 develop permanent disabilities (17). In addition to the 60-80% of
symptomatic babies that develop neurological sequelae, around 10-15% of
asymptomatic children will also develop neurological conditions (18).
Though HCMV infection is mostly asymptomatic, common HCMV-associated
2
(19-21). HCMV also continues to be a serious problem affecting organ transplant
recipients. Lung transplant patients are especially at risk because the lung is a major
site of HCMV latency and reactivation (22).
Furthermore, HCMV is often speculated to be a cofactor for human
immunodeficiency virus (HIV) infection and disease progression (23). There have been
implications that those infected with HCMV have increased susceptibility to HIV and that
HCMV infection is associated with enhanced progression of HIV disease (24-27).
HCMV retinitis is a common complication that caused retinal detachment and blindness
in about 50% of AIDS patients before therapy was available (7, 28). These findings
reveal the possibility that HCMV infection may lead to alterations of other diseases and
stress the importance of understanding the composition of the virus as well as the
mechanisms behind HCMV infection.
HCMV is the largest human herpesvirus with a genome of about 230 kB and
encodes about 200 gene products (29). The linear, double-stranded DNA genome is
encased in an icosahedral capsid (Figure 1). The genome is separated into two sections
known as the unique long (UL) and unique short (US) regions, which are flanked by
inverted repeated sequences (30). Outside the icosahedral capsid lies a layer of
tegument proteins, such as pp65 and pp71 (31). The tegument proteins are important
for transport of the viral genome into the cell nucleus upon viral entry. Glycoproteins,
which allow for viral entry through membrane fusion, are studded throughout the viral
3
Figure 1. HCMV virus particle. The double-stranded DNA viral genome is enclosed in
an icosahedral protein capsid. A tegument protein layer lies outside of the capsid but
beneath the viral envelope. The lipid envelope is derived from the host cell and is
studded with various glycoproteins that facilitate virus-entry. glycoproteins
dsDNA
capsid tegument
4
Upon entry, HCMV exhibits two modes of infection, lytic and latent. Whether the
virus enters into the lytic or latent infection cycles is dependent on expression of viral
immediate-early (IE) genes (31). The lytic replication cycle progresses when IE genes
are expressed, followed by early (E) and late (L) gene expression. Notable IE gene
products include IE1 (UL123) and IE2 (UL122), which are regulated by the major
immediate-early promoter (MIEP) and are the first and the most abundant proteins
expressed in the immediate-early phase. The IE1 protein has been shown to
transactivate the MIEP, thereby stimulating production of more IE genes (32). The IE2
protein can also autoregulate the MIEP (33). IE2 can bind to itself, p75 (UL84) or other
transcriptional factors such as CREB (33-35). Together, IE1 and IE2 play a major role in
viral gene expression and infection progression. Other important IE proteins include the
IE72 and IE86 gene products which work synergistically to activate viral early and late
gene expression (1). HCMV early genes primarily encode proteins that play a role in
viral replication (36). Some early genes are UL54, which encodes a viral DNA
polymerase, and UL57, which encodes a single-stranded DNA binding protein (36). Late
genes often encode structural protein for the virus. An example of an important late
gene is UL75, which encodes glycoprotein H (gH), and UL99, which encodes pp28, a
tegument protein (37, 38).
Latency is characterized by expression of a limited set of viral genes and the
ability to reactivate the virus when stimulated (39). To date, only a few
latency-associated viral genes have been identified. These genes include UL81-82, UL111A,
UL138, UL144, and US28 (40-45). HCMV UL81-82 encodes latency unique natural
5
reactivation in latently infected primary CD14+ cells (46, 47). UL111A encodes an
interleukin 10 ortholog (30, 40). UL138 is also required for the establishment and/or
maintenance of HCMV latency and is speculated to be involved in the reactivation of the
lytic cycle (2, 48). The UL144 gene encodes a homolog of the herpesvirus entry
mediator (HVEM) (49). The US28 gene encodes a chemokine
G-protein-coupled-receptor (GPCR) that can bind to a variety of viral and host G-protein-coupled-receptors (45).
Because of its ability to establish latency, HCMV can persist in the host for life
(50). In order to avoid immune clearance and, HCMV expresses genes that mimic host
immune modulators (51). One of these is the UL111A gene that encodes the viral
ortholog of human interleukin-10 (hIL-10). Human IL-10 is a cellular cytokine that plays
an important role in terminating an immune response by suppressing the activity of
inflammatory cytokines and immune cells (52). These effects occur when hIL-10 forms
dimers that bind to the cellular IL-10 receptor complex (IL-10R) on target cells and
activates the Janus kinase/Signal Transducer and Activator of Transcription
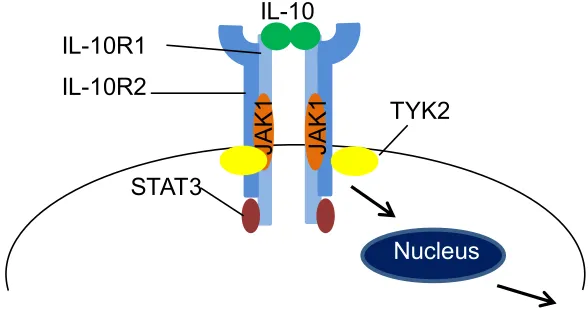
(JAK/STAT) signaling cascade (53) (Figure 2). The receptor complex consists of two
subunits, IL-10R1 and IL-10R2, both of which are required for proper activity. Upon
hIL-10 dimer binding to the IL-10R, the JAKs and TYKs (tyrosine kinases), which are
constitutively associated with IL-10R1 and IL-10R2, respectively, are phosphorylated
and activated (54, 55). The activated kinases then phosphorylate tyrosine residues
located on the IL-10R1 and create docking sites for STAT3. STAT3 molecules bind to
IL-10R1 and gets phosphorylated by JAK1. Once phosphorylated, STAT3 dimerizes
and translocates to the nucleus where it binds to STAT-binding elements (SBE) in
6
Figure 2. The IL-10 receptor complex (IL-10R). The IL-10R is comprised of two chains
(IL-10R1 and IL-10R2), both of which are necessary for signaling from the receptor. JAK
and TYK are constitutively associated with IL-10R1 and IL10-R2, respectively.
JAK
1
IL-10
STAT3
JAK
1
IL-10R1 IL-10R2
TYK2
7
of IL-10-responsive genes that contain SBEs in the promoter region are cyclin D2, cyclin
D3, c-jun, c-fos, and p27 (55, 56).
The HCMV ortholog of hIL-10, which is known as cmvIL-10, is a 175-amino
acid-long protein expressed during lytic infection (30, 57, 58). The viral cytokine is secreted
by infected cells and can cause downstream effects in uninfected cells (Figure 3).
Although cmvIL-10 only has 27% amino acid identity to hIL-10 (30), the viral cytokine
also binds to the cellular IL-10R, triggering many of the same immunosuppressive
effects as hIL-10, such as inhibition of dendritic cell maturation (59), peripheral blood
mononuclear cells (PBMCs) proliferation, and suppression of pro-inflammatory cytokine
production (60).
The UL111A gene is comprised of three exons, with splicing of the two introns
giving rise to a transcript that yields cmvIL-10 protein (30). During latency, a second
variant is produced as a result of alternative splicing of the UL111A gene (Figure 4A).
Though the gene product is known as latency-associated cmvIL-10, or LAcmvIL-10, it is
expressed during both lytic and latent infection (40, 58). The amino acid sequence of
LAcmvIL-10 is collinear with cmvIL-10 for the first 127 amino acids but diverges in the
last 12 amino acids, resulting in a different C-terminus (Figure 4B). The two are known
collectively as viral IL-10 (vIL-10). Although LAcmvIL-10 retains the ability to
downregulate major histocompatibility complex (MHC) class II expression on latently
infected granulocyte macrophage progenitor cells (GM-Ps) and monocytes, the
truncated isoform has more limited immune suppressive function than cmvIL-10 and
8
Figure 3. HCMV-infected cells release cmvIL-10. HCMV infected cells secrete viral
cytokine, cmvIL-10 (green). The viral cytokine binds to the cellular IL-10R on uninfected
cells triggering downstream signaling pathways.
Nucleus Nucleus
HCMV
Virus-infected cell
cmvIL-10
Uninfected cell IL-10R
HCMV
9 A)
B)
Figure 4. The UL111A gene products. A) The alternative splicing of the UL111A gene,
results in two separate products collectively known as vIL-10. The full-length transcript,
cmvIL-10, is 175 amino acids long while the latency associated version, LAcmvIL-10, is
139 amino acids long. The asterick indicates the premature stop codon at the intron 2
sequence that results in the truncated LAcmvIL-10. B) The full amino acid sequence of
cmvIL-10 is aligned with LAcmvIL-10 to show similarity (highlighted gray regions). The
diagram was generated using web-based alignment software from Uniprot. The
asterisk indicates a fully conserved residue whereas the colon and period indicates
strongly similar and weakly similar residues, respectively. The box-enclosed sequence
indicates the residues of cmvIL-10 and IL-10R contact points while the residues in red
indicate cmvIL-10 dimerization contact points (63). LAcmvIL-10
139 aa
Exon 1 Exon 2 Exon 3
cmvIL-10
175 aa
UL US
UL111A
*
10
In addition to the numerous immunosuppressive functions exhibited by vIL-10,
cmvIL-10 has been observed to stimulate B cell proliferation and autocrine production of
hIL-10 (61). The extensive effects of vIL-10 suggest that vIL-10 may play a critical role
in HCMV infection. Considering the importance of vIL-10 in infection, it is crucial to
investigate vIL-10 expression in host body fluids. To date, it is not clear how much
vIL-10 is produced during infection. Furthermore, when expressed, it is unclear as to
whether or not vIL-10 can be detected in body fluids. This may be due to the lack of
commercial assays available for detection of vIL-10. Therefore, to further examine these
findings, an Enzyme-linked Immunosorbent Assay (ELISA) was developed to screen
and evaluate vIL-10 levels in both cell culture and healthy donor blood samples.
Ultimately, these findings may provide a snapshot of viral protein expression during
latency and help characterize the interplay between the two viral cytokines with respect
to productive and latent infection.
Materials and Methods
I. Cells, Viruses, and Reagents
Newborn foreskin fibroblasts (NuFF-1) (GlobalStem, Gaithersburg, MD) were
cultured in Dulbecco’s Modification of Eagle’s Media (Corning, Manassas, VA)
supplemented with 10% fetal bovine serum, 1% non-essential amino acids, and 10 mM
HEPES (Cellgro, Herndon, VA). The cells were grown in a humidified 37°C incubator
with 5% CO2 atmosphere. Human embryonic kidney (HEK) 293 cells (ATCC) were
11
FBS (Cellgro) in a humidified incubator at 37°C and 5% CO2 atmosphere. The HCMV
strain AD169 virus (ATCC, Manassas, VA) was propagated through fibroblasts cells.
Purified recombinant cmvIL-10 (117-VL-025), hIL-10 (1064-IL-01), ebvIL-10
(915-VL-010), and IFN-γ (285-IF-100) cytokines, as well as antibodies directed against
cmvIL-10 (AF117) and cmvIL-10 biotinylated (BAF117), were purchased from R&D
Systems (Minneapolis, MN). Anti-MAPK antibody (9102S) was purchased from Cell
Signaling Technology (Danvers, MA) while secondary antibodies, donkey-anti-goat-AP
(sc-2022), anti-rabbit-AP (sc-2007), anti-mouse-HRP (sc-2005), and
goat-anti-human-HRP (sc-2454) were from Santa Cruz Biotechnology (Santa Cruz, CA). The
non-commericial cmvIL-10 antibodies, Monoclonal A and Monoclonal B, were gifted
from Lenore Pereira and Takako Yamamoto-Tabata (UCSF, San Francisco, CA) and
Gavin Wilkinson (Cardiff University, Cardiff, United Kingdom), respectively. Monoclonal
B was provided as culture supernatant with an estimated concentration of 20 µg/ml.
Polyclonal antiserum directed against the unique C-terminal regions of cmvIL-10
and LAcmvIL-10 were created. Rabbits were immunized with purified peptides
consisting of amino acids 128-175 of cmvIL-10 (NH2- PLLGCGDKSVISRLSQ
EAERKSDNGTRKGLSELDTLFSRLEEYLHSRK -COOH) (Abbiotech, San Diego, CA) or
amino acids 127-139 of LAcmvIL-10 (NH2- CVSVSVAALSAQR -COOH) (Thermo
Fisher). After a series of immunizations, serum was collected and purified to obtain
polyclonal antiserum specific to each protein. This work was contracted and animal
immunizations were done off site by Abbiotech and Thermo Fisher.
12 II. Virus Infection
For HCMV infections, the three wells of NuFF-1 cells were seeded at 2 x 10⁵
cells/well and grown to 100% confluency in a 6-well dish. The AD169 viral stock-media
solution was mixed in NuFF-1 media (for an MOI of 0.1 and total volume of 300 µl/well)
before being added to each confluent well of cells and incubated for one hour at 37°C.
After one hour, 1.7 ml of media was added to the wells for a total volume of 2 ml/well.
Cell supernatants were harvested before infection and every 24 hours infection for 9
days. The supernatants were stored at -20°C until use.
III. Transient transfection
HEK293 cells were seeded at a cell density of 2 x 10⁵ cells/well in a 6-well dish.
After 24 hours, a 9 µl: 3 µg ratio of Fugene (Promega, Madison, WI) to plasmid DNA
was added into each well. The cells were transfected with either pcDNA-cmvIL-10, a
plasmid containing the full-length cmvIL-10, or pcDNA-LAcmvIL-10, a plasmid
containing LAcmvIL-10. The pcDNA plasmid enables expression of the protein with a
C-terminal myc and His epitope tag (Figure 5). Supernatants were collected every 24
hours and stored at -20°C. The cells were harvested by trypsinization five days post
transfection After two cold PBS washes, the cell pellets were resuspended in 100 µl of
Cell Lysis Buffer (150 mM NaCl, 20 mM HEPES, 0.5% Triton X-100, 1 mM NaOV4, 1
mM EDTA, and 0.1% NaN3 dissolved in water). The cells were then frozen overnight at
-20°C. On the following day, the cells were thawed and centrifuged at 14,000 RPM for
13
Figure 5. pcDNA3.1 vector map. The pcDNA3.1 vector contains a strong promoter for
HCMV along with neomycin and ampicillin markers for selection. Transient transfection
using the vector allows for expression of the specific protein with myc-His tag. The
14 IV. Western blot
Cell lysates were separated using SDS-PAGE and transferred onto a
nitrocellulose membrane. The membrane was blocked (5% milk in TBS-0.05%Tween)
for an hour at room temperature and washed twice with TBS-0.05% Tween (TBS-T).
The membrane was incubated overnight with 1:1000 of the goat anti-vIL-10 polyclonal
antiserum (R&D Systems) or anti-MAPK antibody at 4°C, followed by washes and
incubation with 1:1000 of the corresponding AP-conjugated secondary antibody for an
hour at room temperature. The membrane was developed in Western Blue stabilized
AP substrate (ProMega) and scanned using Adobe Photoshop.
V. Blood Preparation
De-identified specimens of human whole blood were purchased in 6-ml EDTA
tubes from the Blood Centers of the Pacific (San Francisco, CA) and the Stanford Blood
Center (Menlo Park, CA). A 400 µl aliquot of the whole blood was used for extraction of
genomic DNA (gDNA) using the ReliaPrep Blood gDNA Miniprep System (Promega,
Madison, WI). The remaining whole blood was centrifuged at 1300 x g for 10 minutes at
4°C to separate plasma from blood cells.
VI. Enzyme-Linked Immunosorbent Assay (ELISA)
i. Sandwich ELISA – vIL-10 protein detection
A 96-well microplate was coated overnight at 4⁰C with 50 µl/well of 2 ug/ml goat
anti-vIL-10 polyclonal antiserum (R&D Systems) diluted in PBS. The plate was washed
three times with 150 µl/well (3 times volume of sample) of TBS-0.05% Tween (TBS-T)
15
an hour at room temperature. After another set of washes, 50 µl/well sample or
standard was added and incubated at room temperature for 2 hours. The plasma
samples were tested at 10% in PBS. Purified vIL-10 protein standards were 2-fold serial
dilutions (starting at 1000 pg/ml) of cmvIL-10 recombinant protein diluted in either 10%
seronegative human plasma in PBS or 10% FBS in PBS. After three washes, a total
volume of 50 µl/well of cmvIL-10 biotinylated antibody at 0.2 µg/ml was added and
incubated for 2 hours at room temperature. After another set of washes, 50 µl /well of
1:200 streptavidin-HRP (R&D Systems) was incubated for 20 minutes at room
temperature in the dark (covered with foil). An addition of 50 µl/well of substrate reagent
(R&D Systems) was used for detection after the plate was washed for another 3 times.
After 14 minutes of incubation with the substrate reagent (R&D systems), the plate was
stopped with 50 µl/well of 1M H2SO4 and read at 450 nm using the Dynex Opsys MR
Microplate Reader and Revelation Quicklink program (Dynex Technologies, Chantilly,
VA). The concentration of the samples were interpolated from a standard curve with a
R2 value of 0.99. Samples with values outside of the standard curve were retested at
appropriate dilution.
ii. Sandwich ELISA - Host cytokine detection
The plasma hIL-10 (DY217B), IL-12 (DY1270), and TNF-α (DY210) levels were
detected using commercial ELISA DuoSet kits (R&D Systems) according to
manufacturer’s instructions. The plasma samples were diluted to 10% in PBS. The plate
was stopped after 14 minutes of incubation with the substrate reagent. The plate was
read at 450 nm and results were analyzed using the Dynex Opsys MR Microplate
16 iii. Indirect ELISA – vIL-10 antibody detection
A 96-microplate was coated overnight at 4°C with either 50 µl/well of 1 µg/ml
cmvIL-10 recombinant protein. After three washes with 150 µl/well of TBS-T, the plate
was blocked with 1% BSA in PBS for 1 hour at room temperature. Plasma samples
were diluted to 2% in PBS and incubated at room temperature for 2 hours. After another
set of washes, the wells were incubated with 0.4 µg/ml of anti-human-HRP-conjugated
secondary antibody (in PBS) for 1 hour, then washed again, and developed for 15
minutes using substrate reagent. The plate was read at 450 nm and analyzed using the
Dynex Opsys MR Microplate Reader and Revelation Quicklink software.
iv. HCMV IgG and IgM – HCMV serostatus determination
Human plasma samples were examined according to manufacturer’s instructions
using HCMV IgG and IgM ELISA kits (Trinity Biotech USA, Jamestown, NY) to
determine HCMV serostatus of human blood donors. The plasma samples were diluted
1:21 for IgG and 1:81 for IgM detection in the kit diluents as per manufacter’s
instructions. The plate was read using the Dynex Opsys MR Microplate Reader and
Revelation Quicklink software. The correction factor of the kit and mean OD value of
the calibrator were used to determine the cutoff calibrator value. The immune status
ratio (ISR) was calculated by dividing the OD of the sample by the cutoff calibrator
value. Samples with an ISR value greater than 1.10 were deemed positive for HCMV
17
VII. Polymerase Chain Reaction (PCR)
Genomic DNA (gDNA) was extracted from whole blood using the ReliaPrep Blood
gDNA Miniprep System (Promega) and analyzed using PCR for viral genes. The outer
forward and reverse primers for IE1 were 5' - GGTCACTAGTGACGCTTGTATG
ATGACCATGTACCGA - 3', 5' – GATAGTCGCGGGTACAGGGGACTCT - 3’. The inner
forward and reverse primers for IE1 were 5’ – AAGTGAGTTCTGTCGGGTGCT – 3’ and
5’ – GTGACACCAGAGAATCAGAGGA – 3’ as described in (64). The gene specific
forward and reverse primers for β-actin were 5' – ATTAAGGAGAAGCTGTGCTACG - 3'
and 5’ – TGTTGGCGTACAGGTCTTTG - 3'. For PCR reactions, each contained gDNA
template (500 ng), primers, dNTP mix, Ex-Taq Buffer, and Ex-Taq polymerase
(Clontech, Mountain View, CA) in a final volume of 50 µl. The PCR reaction underwent
the following protocol on a MyCycler Thermal Cycler (Bio-Rad, Hercules, CA): 94°C,
5 min; 35 cycles: 94°C for 30 sec, 58°C for 30 sec, 72°C for 60 sec; 72°C for 5 min;
4°C, infinity. For amplifying the IE1 inner sequence (round 2), 2 µl from IE1 outer PCR
products were used with a final volume of 25 µl. The PCR reaction underwent the
following protocol on a MyCycler Thermal Cycler (Bio-Rad): 94°C, 5 min;
30 cycles: 94°C for 30 sec, 58°C for 30 sec, 72°C for 50 sec; 72°C, 5 min; 4°C,
infinity. The PCR products were visualized on a 2% agarose gel.
Results
I. vIL-10 ELISA development
The UL111A gene product is one of a small subset of genes expressed during both
18
remains unknown. Currently, there are no commercial assays for the detection of
vIL-10. Thus, in order to detect and quantify vIL-10 levels in human blood, it was first
necessary to develop a screen for vIL-10 (Figure 6). In addition to the only commercially
available goat anti-vIL-10 polyclonal antiserum (R&D Systems), two other monoclonal
anti-cmvIL-10 antibodies were tested to determine the optimal conditions for the assay.
The goat-polyclonal and Monoclonal A antibodies were tested at 2 µg/ml while
Monoclonal B was tested at 1:10 (2 µg/ml) to determine their effectiveness as the
capture antibody. A serial dilution of purified cmvIL-10 recombinant protein was used to
create a standard curve for which the detection range and linear regression of the three
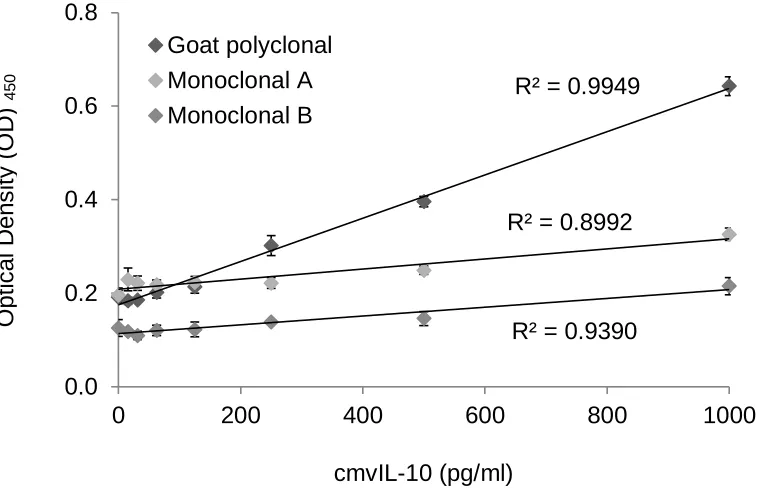
test antibodies was analyzed at a wavelength of 450 nm. The goat polyclonal had the
most effective detection range since it had the widest spread of optical density (OD)
units for the standard curve (Figure 7). Also, the goat polyclonal antibody produced the
standard curve with the best linear fit, with a R2 value of 0.9949. The OD spread and R2
values were suboptimal for the monoclonal antibodies. Thus, the goat polyclonal
antibody would be used as the capture antibody for the vIL-10 ELISA. The monoclonal
antibodies were also tested as detection antibodies with the addition of an
anti-mouse-HRP since the monoclonal antibodies were not directly conjugated to a detection
enzyme but this approach was less successful. The commercial cmvIL-10 biotinylated
antibody proved to be the best detection antibody. The optimal vIL-10 ELISA consisted
of the polyclonal cmvIL-10 as capture and the cmvIL-10 biotinylated antibody as
detection. Various concentrations of the capture and detection antibodies were also
19
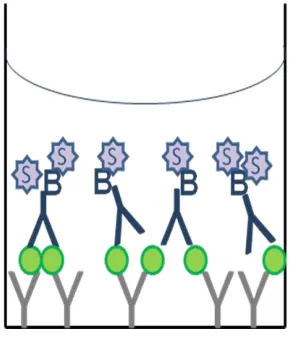
Figure 6. A schematic diagram of a Sandwich Enzyme-Linked Immunosorbent
Assay (ELISA). Anti-cmvIL-10 antibody (gray) is used to capture any vIL-10 (green)
present in the sample. A biotinylated anti-cmvIL-10 antibody (blue) is used to further
bind vIL-10 for detection. Streptavidin-HRP (purple) binds to the biotin on the
secondary antibody and addition of substrate (for the HRP enzyme) causes a visible
20
Figure 7. Optimization of vIL-10 ELISA capture antibody. Three different antibodies
were tested as capture for the vIL-10 ELISA development. Monoclonal A and Goat
polyclonal antibodies were used to coat the plate at 2 µg/ml concentration while 1:10
dilution of Monoclonal B was used. Purified cmvIL-10 recombinant protein was used to
create a standard curve and 0.2 µg/ml of a biotinylated cmvIL-10 antibody was used for
detection of cmvIL-10. The results of the assay are reported as units of optical density
(OD) at 450 nm and a R2 value demonstrating the linear regression of the standard
curve. The goat polyclonal antibody had the widest spread of OD and best R2 value
demonstrating that it would be the best choice for development of the vIL-10 ELISA.
Error bars represent standard error.
R² = 0.9949
R² = 0.8992
R² = 0.9390
0.0 0.2 0.4 0.6 0.8
0 200 400 600 800 1000
Goat polyclonal Monoclonal A Monoclonal B
cmvIL-10 (pg/ml)
O
p
ti
ca
l
D
e
n
s
it
y
(O
D
21 II. Specificity to vIL-10
To demonstrate the specificity of the vIL-10 ELISA, purified recombinant hIL-10,
eb10, and IFN-γ protein were tested to confirm that the assay would only detect
vIL-10 and not other cytokines. The optical density readings for hIL-vIL-10, ebvIL-vIL-10, and IFN-γ
proteins were similar to that of the PBS blank (Figure 8A), suggesting that only vIL-10
could be detected. Results from the experiment validated the assay as even at a high
concentration of cytokines (5 ng/ml), there was no detection of the non-specific proteins.
III. vIL-10 detection during virus infection
In order to verify that the vIL-10 ELISA was able to detect vIL-10 produced naturally
during virus infection, NuFF-1 cells were infected at an MOI of 0.1 with the AD169 strain
of HCMV. After nine days of infection, the supernatants from each day were analyzed
using the vIL-10 ELISA. The supernatants were also evaluated using a commercial
hIL-10 ELISA kit to determine the levels of the normal cellular cytokine. As predicted, the
levels of vIL-10 in supernatants were detectable using the ELISA and shown to increase
as the infection progressed while hIL-10 was not detected in any of the supernatant
samples (Figure 8B).
To further confirm that vIL-10 and hIL-10 do no cross-react and to provide a positive
control for hIL-10 detection, cells were stimulated to produce hIL-10 but not vIL-10 and
analyzed using both ELISAs. Human monocytes (THP-1) were treated with
lipopolysaccharide (LPS) for four days to induce cytokine production. Supernatants
22 A)
B)
Figure 8. Specific detection of purified vIL-10 protein and proteins during
infection. A) Purified recombinant cytokines (R&D Systems) were used to test the
assay for cross-reactivity. In addition to the cellular cytokine hIL-10, a cytokine from a related herpesvirus Epstein-Barr virus, ebvIL-10, and an unrelated cytokine, IFN-γ, were
also tested. PBS served as a negative control. B) Newborn human foreskin fibroblasts
(NuFF-1) were infected at 0.1 MOI with HCMV AD169-strain for a period of 9 days.
Supernatants were collected and analyzed daily using our vIL-10 ELISA and a
commercial hIL-10 ELISA kit. Day 4 supernatant from THP-1 cells stimulated with 5
ug/ml LPS served as a positive control for hIL-10 detection. Error bars represent
standard error. These results are representative of 3 independent experiments. 0.0
0.5 1.0 1.5 2.0
cmvIL-10 hIL-10 ebvIL-10 IFN-γ PBS
Days post infection (dpi)
C yt o ki n e co n c. (p g /ml ) OD 450
Cytokine (5 ng/ml)
23
ELISAs. As expected, hIL-10 was detectable from the supernatants while vIL-10 was
not detected (Figure 8B). This served as the positive control for hIL-10 detection and
confirmed that the custom vIL-10 ELISA did not cross-react with naturally produced
hIL-10.
IV. vIL-10 detection in transfected cells
To determine whether the custom vIL-10 ELISA could detect both cmvIL-10 and
LAcmvIL-10, HEK293 cells were transfected with plasmids encoding cDNA for one
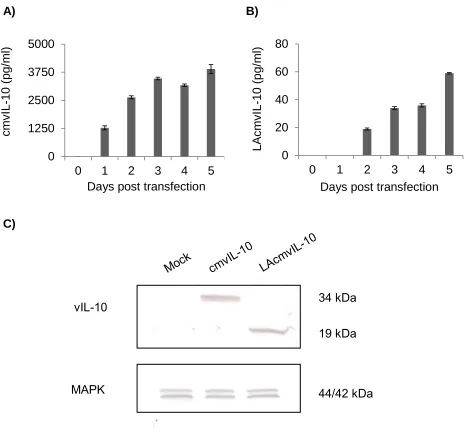
isoform or the other. Results from the vIL-10 ELISA showed that although both
cytokines accumulated over time, supernatants of the cmvIL-10-transfected cells had
higher vIL-10 levels than the LAcmvIL-10-transfected samples (Figure 9A, B). Western
blotting was also employed to confirm that two isoforms were produced and at the
predicted sizes. Lysates were collected, separated by SDS-PAGE, transferred to a
nitrocellulose membrane and probed with goat anti-vIL-10 polyclonal antiserum (R&D
Systems) and an antibody against MAPK, a cellular transcription factor that serves as a
control. A band at 34 kilodaltons (kDa) was detected in the lysates of the
cmvIL-10-transfected cells while a 19 kDa band was detected in lysates of the
LAcmvIL-10-transfected cells (Figure 9C). The predicted size of the full-length cmvIL-10 is 17 kDa,
suggesting that the large 34 kDa band may indicate a cmvIL-10 dimer. The 19 kDa
LAcmvIL-10 band appears larger than the predicted 16 kDa size but is likely due to the
3 kDa molecular weight of the myc-His tag. The bands indicate that levels of cmvIL-10
and LAcmvIL-10 in the cell lysates seem comparable. Therefore, because the levels of
LAcmvIL-10 were much lower than cmvIL-10 levels in the supernatant, it seems that the
24
A) B)
C)
Figure 9. Detection of both isoforms during transfection. Human embryonic kidney
(HEK)-293 cells were transfected with pcDNA-cmvIL-10 or pcDNA-LAcmvIL-10.
Supernatants from pcDNA-cmvIL-10 (A) or pcDNA-LAcmvIL-10 transfections (B) were
collected and analyzed via the vIL-10 ELISA. Error bars represent standard error. The
results are representative of 3 independent experiments. C) Lysates from day 4 were
separated and Western blotted with a commercial polyclonal anti-cmvIL-10 antibody
(R&D) to visualize the two different isoforms. The bands at 34 kD and 19 kD, for
cmvIL-10 and LAcmvIL-cmvIL-10 respectively, indicate that the proteins are likely glycosylated. The
lysates were also blotted with a commercial polyclonal MAPK antibody (Cell Signaling
Technology) as control. 0
1250 2500 3750 5000
0 1 2 3 4 5
0 20 40 60 80
0 1 2 3 4 5
cmvI L -1 0 (p g /ml ) LA cmvI L -1 0 (p g /ml )
Days post transfection
vIL-10
MAPK
Days post transfection
34 kDa
19 kDa
25
Attempts were made to quantify the levels of LAcmvIL-10 only by developing
another ELISA using the custom antibody specific for the unique C-terminus of
LAcmvIL-10. With this as capture antibody and the biotinylated anti-cmvIL-10 antibody
for detection, it was expected that levels of the truncated viral cytokine should be
quantifiable in transfection supernatants and lysates from the LAcmvIL-10-transfected
cells and HCMV-infected cells. Mock, cmvIL-10-transfected, and LAcmvIL-10 were
tested using this custom ELISA but background OD was incredibly high and there was
no difference in detection between the transfected and the mock-transfected cell lysates
(Figure 10). The cell lysates from transfection and HCMV-infection were also blotted
using the anti-LAcmvIL-10 polyclonal antiserum (1:1000). There was no detection of any
bands in the Western blot (data not shown) suggesting the attempt was unsuccessful.
Optimization of the custom LAcmvIL-10 ELISA and western blot experiments are in
future plans.
V. vIL-10 levels in human blood
The ultimate goal was to develop an assay that could quantify vIL-10 in human
blood, therefore it was necessary to confirm that human serum proteins would not
interfere with detection of vIL-10 in human blood samples. Serial dilutions of cmvIL-10
recombinant protein were prepared in PBS with 10% seronegative human serum and
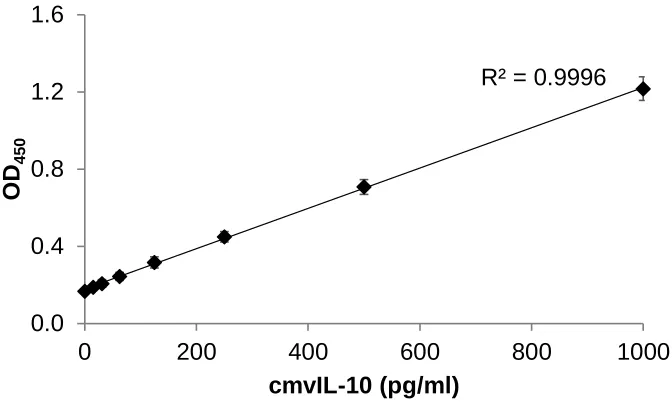
analyzed via the vIL-10 ELISA. The results of the vIL-10 ELISA demonstrated that even
in the presence of the serum proteins, the assay could detect vIL-10 (Figure 11). The R2
value demonstrates linearity between the concentration of cytokine and the optical
26
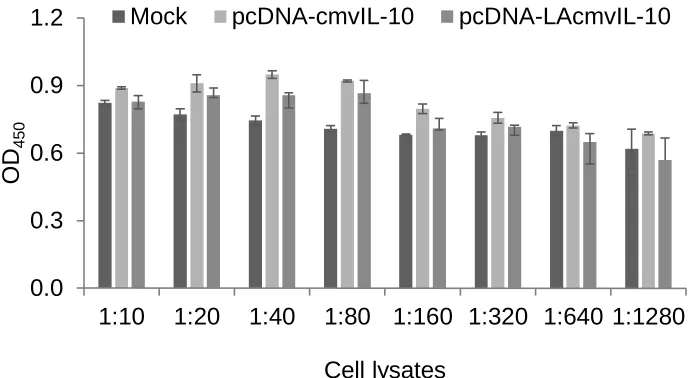
Figure 10. Initial LAcmvIL-10 ELISA development. Cell lysates from mock, cmvIL-10,
and LAcmvIL-10 transfections were tested in an initial version of a specific LAcmvIL-10
ELISA. The OD readings were comparable for the three types of lysate samples
suggesting non-specific detection. Further optimization is necessary before the assay
can be used. 0.0 0.3 0.6 0.9 1.2
1:10 1:20 1:40 1:80 1:160 1:320 1:640 1:1280
OD
450
Cell lysates
27
Figure 11. Serum levels of vIL-10 can be measured. A standard curve was created
using 10% serum in PBS as a diluent to show that serum proteins did not interfere with
the sensitivity and specificity of the assay. Error bars represent standard error. These
results are representative of 3 independent experiments.
R² = 0.9996
0.0 0.4 0.8 1.2 1.6
0 200 400 600 800 1000
OD
450
28 VI. vIL-10 levels in blood donors
To determine whether vIL-10 was produced in sufficient levels in blood, the vIL-10
ELISA was used to detect vIL-10 in the blood of healthy, HCMV seropositive donors.
Thirty de-identified human whole blood samples were obtained in EDTA tubes. Donor
information provided from the blood banks and vIL-10 levels are summarized in Table 1.
Though the blood banks provide serostatus information, the samples were retested for
HCMV serostatus using the IgG ELISA and the IgG (ISR) values were also represented
in Table 1. Plasma samples were diluted to 10% in PBS and evaluated using the vIL-10
ELISA to determine serum vIL-10 levels. A wide-range of vIL-10 was detected in the
seropositive donors. Of the 30 seropositive samples, 10 had no detectable vIL-10, 10
had detectable levels of vIL-10 within the limits of the assay, and 10 had detectable
levels of vIL-10 beyond the upper limit of the assay (Figure 12A). The upper limit of the
assay is 1000 pg/ml or 10 ng/ml when the vIL-10 levels of the 10% samples are
normalized to 100%. To further confirm that the 10 seropositive donors truly had no
detectable levels of vIL-10, a subset of the samples (7/10) were tested at 100%. Of the
7 that were retested, 4 had low but detectable vIL-10 levels when tested at 100% while
3 remained undetectable (Figure 12B). Additionally, because 10 of the samples had
vIL-10 levels at the upper limit, interpolation of vIL-vIL-10 levels was not possible. To resolve
this issue, a subset of those donors (5/10) were tested at a lower concentration, 0.2%
plasma for donor R20841 and 2% plasma for the other four. The vIL-10 levels from
these tests were within the assay detection range and thus, no extrapolation was
necessary. The results using the lower concentrations were normalized to 100% plasma
29
Table 1. Summary of donor information. Gender, age, and ethnicity information was
provided by the blood banks. The test results from the HCMV IgG ELISA (ISR value),
vIL-10 concentration per 10% plasma (pg/ml), and anti-vIL-10 antibody (OD) are also
shown. N/T denotes not tested. The asterisk indicates levels outside of the upper
detection limit (1000 pg/ml); these values are set to 1000 pg/ml for data analyses.
ID# Gender Age Ethnicity HCMV
IgG (ISR)
vIL-10 Conc. at 10% (pg/ml)
α-vIL-10 antibody (OD)
R08629 M 66 Unknown 2.884 0 0.160
R08631 F 50 Filipino 0.814 546.519 0.260
R08632 M 47 Filipino 2.884 1089.948* 0.236
R18186 M 35 Asian 2.952 337.872 1.056
R18187 M 42 White 2.952 275.987 1.507
R18188 M 55 White 2.648 140.933 0.534
R18189 M 61 White 2.952 2601.316* 1.190
R18190 M 27 Mexican 2.952 43.354 0.335
R18191 M 66 White 2.952 27.805 0.759
R23770 M 62 White 3.510 5086.793* 0.723
R23771 M 63 White 2.806 2697.182* 2.413
R23772 M 72 White 3.510 0 0.369
R23773 F 42 Unknown 2.814 10842.681* 0.754
R23774 M 45 White 3.510 0 0.806
R23775 F 70 Chinese 3.113 0 0.788
R20840 F 36 White 1.936 170.968 1.693
R20841 M 23 Mexican 2.023 18950* 2.497
R20842 M 25 White 3.846 1137.534* 1.873
R20843 M 48 American Indian 3.846 0 0.484
S01 M 68 Hispanic 2.302 49.0155 0.642
S03 M 56 White 1.777 91.2865 1.795
S08 M 54 White 3.185 31.972 1.690
S13 M 52 American
Indian/White
4.001 0 1.099
S14 M 59 Chinese 1.039 1982.633* 2.180
S15 M 62 White 2.043 0 0.717
S16 M 38 Indian 3.672 1881.459* 1.228
R16244 F 27 American
Indian/Alaska
2.000 0 2.837
R16245 F 57 Filipino 2.000 3044.147* 3.305
R16246 F 32 Unknown 2.000 0 0.517
30 A)
B) C)
Figure 12. Detection of vIL-10 in human plasma. Plasma was harvested from human
whole blood for quantification of viral cytokine levels using the vIL-10 ELISA. A) The
vIL-10 levels of all 30 seropositive donors are shown after being normalized to 100%
sample. The dashed line depicts the upper detection limit of the assay. B) Seven of the
ten donors that had no detectable levels of vIL-10 were retested neat. C) Five of the ten
donors that had vIL-10 levels at the upper detection limit of the assay were retested at a
31
may work for majority of the donors, some samples benefit from testing at a different
dilution.
Trends based on donor information and vIL-10 levels were then investigated.
Results were separated based on gender to determine gender differences (Figure 13A).
Though males seem to have slightly higher plasma vIL-10 levels than females, 4.090
and 3.397 respectively, the levels seem comparable. Because more male donors were
present in the pool of samples, more female donors will be recruited to better represent
the population. Plasma vIL-10 levels were also represented by major ethnic groups
(Figure 13B). From our donor population, Asians have the highest plasma vIL-10 levels.
The results were also plotted against donor age to examine the trend of plasma vIL-10
and donor age (Figure 13C). There seemed to be a slight negative correlation,
implicating that as age increases, vIL-10 levels decrease. This negative trend was seen
in males but a positive correlation was seen in the female donors.
VII. Host cytokine levels in blood donors
Since investigation of plasma vIL-10 levels was being performed, it was also
important to measure the plasma levels of host cytokines, such as hIL-10, IL-12, and
TNF-α in the donors since they often correlate with disease states. Plasma samples
were diluted to 10% in PBS and tested individually for host cytokine levels and the
results are summarized in Table 2. A wide-range of host cytokines were detected in
some of the seropositive donors but many of the seropositive donors had no detectable
levels of host cytokines (Figure 14A). Because this seemed to be a similar trend with
32
A) B)
C)
Figure 13. vIL-10 levels based on categories. Each circle represents a single donor
while the bars represent the mean of that group. A) Plasma vIL-10 levels are shown as
a comparison between genders. B) Plasma vIL-10 levels are represented by the major
ethnic groups of the donor population. C) Plasma vIL-10 levels for the donors are
plotted against their age. The plasma vIL-10 and age plots were further separated by
gender to analyze the differences between the two groups. The R2 value represents the
linear fit. 0 3 6 9 12 Male Female v IL -1 0 (n g /m l) 0 3 6 9 12 v IL -1 0 (n g /m l)
R² = 0.0235
0 3 6 9 12
0 50 100
v IL -1 0 (n g /m l) Age (years)
R² = 0.0733
0 3 6 9 12
0 50 100
v IL -1 0 (n g /m l) Age (years)
R² = 0.0247
0 3 6 9 12
0 50 100
v IL -1 0 (n g /m l) Age (years)
n= 22 n= 8
3.397 4.090
n= 7 n= 3 n= 14 n= 6
6.978
3.641 3.384
1.667
Asian Hispanic White Unknown
33
Table 2. Summary of plasma cytokine levels. Viral IL-10 levels and the three host cytokines, hIL-10, IL-12, and TNF-α, are listed as concentrations based on tests at 10%
plasma concentration. The asterisk indicates levels outside of the upper detection limit
(1000 pg/ml); these values are set to 1000 pg/ml for data analyses.
ID# vIL-10 conc. at
10% (pg/ml)
hIL-10 conc. at 10% (pg/ml)
IL-12 conc. at 10% (pg/ml)
TNF-α conc. at 10% (pg/ml)
R08629 0 7.173 0 0
R08631 546.519 5.900 0 0
R08632 1089.948* 0 0 0
R18186 337.872 32.7285 15.837 205.250
R18187 275.987 21.647 0 3.702
R18188 140.933 8.608 0 2.175
R18189 2601.316* 497.361 1455.859* 1052.240*
R18190 43.354 0 0 0
R18191 27.805 0 0 0
R23770 5086.793* 665.893 1267.130* 1324.930*
R23771 2697.182* 221.523 196.726 533.494
R23772 0 0 0 0
R23773 10842.681* 374.490 174.597 639.445
R23774 0 0 0 0
R23775 0 0 0 0
R20840 170.968 9.382 3.348 30.898
R20841 18950* 1571.450* 1050.076* 1189.004*
R20842 1137.535* 212.792 98.265 333.165
R20843 0 0 0 0
S01 49.0155 0 0 0
S03 91.287 44.447 10.499 102.375
S08 31.972 4.546 7.427 35.072
S13 0 0 0 0
S14 1982.633* 1359.603* 951.218 1752.913*
S15 0 26.784 0 0
S16 1881.459* 648.267 437.205 868.166
R16244 0 0 0 0
R16245 3044.147* 316.389 219.354 235.562
R16246 0 0 6.007 0
34
hIL-10 IL-12 TNF-α
A)
B)
Figure 14. Host cytokine plasma levels and correlations. A) Host cytokine levels
were detected from the plasma samples of the seropositive donors by commercial hIL-10, IL-12, and TNF-α ELISAs. Each circle represents a single donor while the bars
represent the average of that group. B) Plasma levels of the host cytokines show
correlation with plasma vIL-10 levels in the seropositive donors. The R2 value
represents the linear fit. 0 3 6 9 12
hIL-10 IL-12 TNF-α
C y to k in e co n c. (n g /m l) Host cytokines
R² = 0.5723
0 2.5 5 7.5 10
0 5 10
h IL -1 0 (n g /m l) vIL-10 (ng/ml)
R² = 0.4745
0 2.5 5 7.5 10
0 5 10
IL -1 2 ( n g /m l) vIL-10 (ng/ml)
R² = 0.6516
0 2.5 5 7.5 10
0 5 10
T N F -α (n g /m l) vIL-10 (ng/ml)
n= 30 n= 30 n= 30
35
14B). There seemed to be a strong correlation between vIL-10 and hIL-10 levels in the
plasma, with a R2 value of 0.5723. This is not surprisingly since vIL-10 has been shown
to stimulate hIL-10 production (61). There was a slightly lower correlation between
vIL-10 and IL-12 while there was a stronger correlation with TNF- α, with R2 values of
0.4745 and 0.6516, respectively. Since IL-12 is produced in response to antigen
stimulation and TNF-α is responsible for inflammation and virus infection, this
correlation with
vIL-10 should not be alarming.
VIII. Anti-vIL-10 antibodies in blood donors
Since the viral cytokine was detected in human blood, the possibility that the
presence of antibodies directed against vIL-10 was also investigated. An indirect ELISA
in which recombinant cmvIL-10 protein was used as antigen was employed to evaluate
donor plasma. Antibody levels were measured and expressed as the OD value and
compared to the IgG (OD) levels (Figure 15A) and plasma vIL-10 levels in the donors
(Figure 15B). Surprisingly, there was a slight negative correlation with IgG OD and
plasma anti-vIL-10 antibody levels. The reason is unclear and further investigation and
data analyses must be done to understand this relationship. There was a slight
correlation with of plasma vIL-10 and anti-vIL-10 antibody suggesting that some but not
all donors are producing antibodies to vIL-10.
IX. HCMV DNA detection
One interesting observation was that vIL-10 was detected in donors that appeared
36 A)
B)
Figure 15. Correlations with antibodies against vIL-10. A) The OD values of
anti-vIL-10 antibodies and IgG (from the Trinity IgG ELISA) from the seropositive donors are
plotted against each other to show the relationship between the antibody levels. B)
Plasma vIL-10 and antibody levels are plotted against each other but show low
correlation, as depicted by the low R2 value.
R² = 0.1185
0 1 2 3 4
0.0 1.0 2.0 3.0
Ig
G
(O
D
)
a-vIL-10 (OD)
R² = 0.1687
0 3 6 9 12
0.0 1.0 2.0 3.0
v
IL
-1
0
(n
g
/m
l)
37
while 8 had no detectable levels (Figure 16). These samples were tested using the
HCMV IgM ELISA to see if the donors had been newly infected but all 26 seronegative
samples tested IgM negative (data not shown). To determine whether viral DNA could
be detected in these donor samples, PCR was performed on genomic DNA extracted
from the whole blood samples. Detection of the viral IE1 gene would indicate HCMV
presence in the samples. Only a subset of the donors were tested for viral DNA. The
PCR was performed on samples from eight donors, four seropositive donors and four
seronegative donors, by Carolyn Tu (University of San Francisco, San Francisco, CA).
A plasmid containing the IE1 gene served as a positive control while water served as
the negative control. β-actin also served as a positive control. The IE1 gene was
detected in all four seropositive donors and two of the seronegative donors (Figure 17).
When arranged with the vIL-10 levels from the vIL-10 ELISA, there was a clear
correlation of IE1 detection and vIL-10 detection despite serostatus. These surprising
results makes this an area for future investigation.
Discussion
Cellular cytokines, a vital part of the immune system, have been previously been
assessed in human blood. Various studies have shown that elevated levels of serum
cytokines, such as IL-6, IL-8, TNF-α, and IFN-γ are associated with HCMV infection and
disease (65-67). Even though vIL-10 has been studied extensively, there have not yet
been any studies on these viral cytokines in human blood. In a recent study, anti-
cmvIL-10 antibodies were detected in 28% of HCMV seropositive adults, suggesting
38
Figure 16. vIL-10 levels in seropositive and seronegative donors. Not only was
vIL-10 detected in seropositive donors but plasma vIL-10 was also detected in many
HCMV seronegative donors despite serostatus. 0
3 6 9 12
HCMV+
HCMV-v
IL
-1
0
(n
g
/m
l)
39
1
100
10000
1
2
3
4
5
6
7
8
Figure 17. vIL-10 protein and HCMV DNA is detected in some seronegative
donors. Nested PCR for exon 4 of the immediate early 1 (IE1) gene was performed on
genomic DNA isolated from whole blood. Two sets of primers were used for the PCR,
as previously described (64). β-actin served as a positive control. The PCR results are
arranged with the vIL-10 ELISA results from the same donors to show the correlation
between detection of IE1 by PCR and detection of vIL-10 by ELISA in both seropositive
and seronegative donors.
β-actin 253 bp PCR2
PCR1 IE1 373bp
IE1 293bp
vI
L-10
(p
g/
m
l)
40
Since vIL-10 has been implicated to play an important role in infection and may be
present in significant quantities in the host, it is crucial to confirm the presence of vIL-10
and investigate whether it can be detected in body fluids, such as blood. Because of the
variety of immunosuppressive functions previously reported for vIL-10, detection of
vIL-10 in blood and evaluating the levels may also provide information on HCMV
infection, HCMV-associated clinical diseases, and other imbalances in the body.
In order to quantify vIL-10 levels in blood, an ELISA was first developed and
optimized in the lab. Various antibodies were tested as capture and detection antibodies
(Figure 7). After the optimal antibody pair was chosen, concentrations of the antibodies
were optimized before the optimal vIL-10 detection assay was achieved. The assay was
tested for specificity for both purified and natural, infection-produced vIL-10 cytokines
and showed no cross-reactivity with other cytokines (Figure 8A, B).
Another important finding from this project is that both isoforms of vIL-10 can be
detected using the vIL-10 ELISA (Figure 9A, B). Since the plasma samples were
obtained from healthy blood donors, it was originally assumed that LAcmvIL-10 should
be present but not cmvIL-10. However, one limitation of the current ELISA is that it
cannot differentiate between the two isoforms. Future experiments using the two custom
antibodies directed against the unique C-terminus regions of cmvIL-10 and LAcmvIL-10
will help reveal whether one or both isoforms are presence in healthy donors. Also, if
cmvIL-10 is present, it would be important to examine whether cmvIL-10 is expressed
41
After confirming that serum protein would not interfere with the detection of
vIL-10 in the serum (Figure 11), donor samples were tested for the presence of vIL-10.
From our initial testing of 30 seropositive donors at a 10% plasma dilution, 10 of the
donors had no detectable level of vIL-10, 10 had detectable vIL-10 levels within the
assay detection range, while 10 had detectable vIL-10 levels at the upper detection limit
of the vIL-10 ELISA (Figure 12A). Seven of the ten donors with no detectable vIL-10
levels were retested at 100% (neat), and from this test, four had low but detectable
levels of vIL-10 (Figure 12B). Five of those at the upper detection limit were retested at
a lower concentration (0.2% or 2% plasma) and this enabled interpolation of plasma
vIL-10 levels for these donors (Figure 12C). This confirmed that the custom vIL-10
ELISA was effective in detecting plasma vIL-10 donors. Also, the current conditions of
the assay allow for useful initial testing of all samples since it either provides a value
within the detection range or indicates a better sample dilution direction for retesting.
As mentioned earlier, many host cytokines are often found to be elevated in
serum of HCMV seropositive donors and are associated with HCMV infection and
diseases. Similar results were seen in our project in which vIL-10 levels had a slight
correlation with hIL-10, IL-12, and TNF-α levels (Figure 14B). This was unexpected
because since vIL-10 is highly immunosuppressive, it was expected that there would be
reduced production of inflammatory cytokines as seen in previously reported in vitro
work (59, 60). However, in contrast, previous studies have reported that HCMV infection
leads to activation of inflammatory cytokines (69). A possible explanation for these two
opposing findings is that HCMV must create some balance of viral and host cytokines to
42
may be some host cytokines that are elevated while the activity of others are inhibited.
The manipulation of the cytokine balance, both cellular and viral cytokines, in the host
by HCMV may be a mechanism for its ability to persist in the host and perhaps even for
latency.
One interesting finding in this project was that vIL-10 was detected in some
seronegative donors. This was an unexpected result since it was presumed that
seronegative donors, or those who are not expressing HCMV IgG or IgM antibodies,
would also not produce vIL-10. However, further investigation with PCR revealed that in
addition to the seropositive donors, some seronegative donors had detectable HCMV
DNA (Figure 13). Additionally, this finding is supported by literature. Previous studies
have reported that seronegative donors are often found HCMV DNA positive by PCR
(20, 40, 70-72). This is not surprisingly since PCR is a more sensitive technique than
ELISA. Though the PCR results have been previously reported, the detection of vIL-10
in both seropositive and seronegative donors is novel. Further investigation as to why
vIL-10 and HCMV DNA is present in seronegative donors will be a very important next
step.
With a developed vIL-10 ELISA and data on plasma vIL-10 levels, the detection
of vIL-10 levels in other body fluids, such as urine or saliva, should be possible and
would be a fascinating future project. Also, more analyses regarding the current data
collected can be performed and may reveal other interesting discoveries that may lead
to future studies of vIL-10. For instance, examining possible correlations between vIL-10
43
provide a better understanding for studying HCMV infection and diseases in those
groups.
One particular future project in our lab, the Avon Study, includes studying healthy
women and women who have been diagnosed with breast cancer. For this project, we
plan to quantify and compare plasma vIL-10 levels between the two groups. Recently,
cmvIL-10 has been demonstrated to enhance tumorigenesis and the invasive potential
of breast cancer cells in vitro (73). Thus, it is possible that there may be elevated levels
of cmvIL-10 in the blood of breast cancer patients. This hypothesis is further supported
by multiple works that have revealed an increased detection of HCMV antigens, DNA,
and IgG antibodies in the tissue of breast cancer patients (74, 75). Moreover, some
studies have shown elevated human IL-10 serum levels in various cancers, including
breast cancer (76). With numerous works now demonstrating the correlation between
HCMV and breast cancer as well as elevated hIL-10 levels and cancer, there could
potentially be a specific relationship between vIL-10 and breast cancer.
In conclusion by developing an assay and quantifying vIL-10 levels in healthy,
asymptomatic blood donors, the groundwork for studying vIL-10 levels in diseased
patients has been done. We expect our work to help understand viral latency and
44 References
1. Sinclair J, Sissons P. 2006. Latency and reactivation of human
cytomegalovirus. The Journal of general virology 87:1763-1779.
2. Goodrum F, Reeves M, Sinclair J, High K, Shenk T. 2007. Human
cytomegalovirus sequences expressed in latently infected individuals promote a latent infection in vitro. Blood 110:937-945.
3. Bego M, Maciejewski J, Khaiboullina S, Pari G, St Jeor S. 2005.
Characterization of an antisense transcript spanning the UL81-82 locus of human cytomegalovirus. Journal of virology 79:11022-11034.
4. Berardi A, Rossi C, Fiorini V, Rivi C, Vagnarelli F, Guaraldi N, Pietrosemoli
P, Lazzarotto T, Ferrari F. 2011. Severe acquired cytomegalovirus infection in a full-term, formula-fed infant: Case Report. BMC Pediatrics 11:52-52.
5. Crough T, Khanna R. 2009. Immunobiology of human cytomegalovirus: from
bench to bedside. Clinical microbiology reviews 22:76-98, Table of Contents.
6. Savva GM, Pachnio A, Kaul B, Morgan K, Huppert FA, Brayne C, Moss PA,
Medical Research Council Cognitive F, Ageing S. 2013. Cytomegalovirus
infection is associated with increased mortality in the older population. Aging cell 12:381-387.
7. Vogel JU, Otte J, Koch F, Gumbel H, Doerr HW, Cinatl J, Jr. 2013. Role of
human cytomegalovirus genotype polymorphisms in AIDS patients with cytomegalovirus retinitis. Medical microbiology and immunology 202:37-47.
8. George MJ, Snydman DR, Werner BG, Griffith J, Falagas ME, Dougherty
NN, Rubin RH. 1997. The independent role of cytomegalovirus as a risk factor for invasive fungal disease in orthotopic liver transplant recipients. Boston Center for Liver Transplantation CMVIG-Study Group. Cytogam, MedImmune, Inc.
Gaithersburg, Maryland. The American journal of medicine 103:106-113.
9. Schubert A, Ehlert K, Schuler-Luettmann S, Gentner E, Mertens T, Michel D.
2013. Fast selection of maribavir resistant cytomegalovirus in a bone marrow transplant recipient. BMC infectious diseases 13:330.
10. Kesson AM, Kakakios A. 2007. Immunocompromised children: conditions and
infectious agents. Paediatric respiratory reviews 8:231-239.
11. Vancikova Z, Dvorak P. 2001. Cytomegalovirus infection in immunocompetent
and immunocompromised individuals--a review. Current drug targets. Immune, endocrine and metabolic disorders 1:179-187.
12. Hodson EM, Ladhani M, Webster AC, Strippoli GF, Craig JC. 2013. Antiviral
medications for preventing cytomegalovirus disease in solid organ transplant
recipients. The Cochrane database of systematic reviews 2:CD003774.
13. Landolfo S, Gariglio M, Gribaudo G, Lembo D. 2003. The human
cytomegalovirus. Pharmacol Ther 98:269-297.
14. Kenneson A, Cannon MJ. 2007. Review and meta-analysis of the epidemiology
of congenital cytomegalovirus (CMV) infection. Reviews in medical virology 17:253-276.
15. Lombardi G, Garofoli F, Stronati M. 2010. Congenital cytomegalovirus