Patron: Her Majesty The Queen
Rothamsted Research
Harpenden, Herts, AL5 2JQ
Telephone: +44 (0)1582 763133
Web: http://www.rothamsted.ac.uk/
Rothamsted Research is a Company Limited by Guarantee Registered Office: as above. Registered in England No. 2393175. Registered Charity No. 802038. VAT No. 197 4201 51. Founded in 1843 by John Bennet Lawes.
Rothamsted Repository Download
A - Papers appearing in refereed journals
Norton, G. J., Aitkenhead, M. J., Khowaja, F. S., Whalley, W. R. and
Price, A. H. 2008. A bioinformatic and transcriptomic approach to
identifying positional candidate genes without fine mapping: an example
using rice root-growth QTLs. Genomics. 92 (5), pp. 344-352.
The publisher's version can be accessed at:
•
https://dx.doi.org/10.1016/j.ygeno.2008.07.002
The output can be accessed at:
https://repository.rothamsted.ac.uk/item/8q069/a-
bioinformatic-and-transcriptomic-approach-to-identifying-positional-candidate-genes-without-fine-mapping-an-example-using-rice-root-growth-qtls
.
© 18 September 2008, Academic Press Inc Elsevier Science.
A bioinformatic and transcriptomic approach to identifying positional candidate
genes without
fi
ne mapping: an example using rice root-growth QTLs☆
Gareth J. Norton
a, Matthew J. Aitkenhead
a, Farkhanda S. Khowaja
a, William R. Whalley
b, Adam H. Price
a,⁎
aDepartment of Plant and Soil Science, Institute of Biological and Environmental Sciences, University of Aberdeen, Aberdeen AB24 3UU, UK bDepartment of Soil Science, Rothamsted Research, Harpenden, Hertfordshire AL5 2JQ, UK
a b s t r a c t
a r t i c l e i n f o
Article history: Received 11 March 2008 Accepted 11 July 2008
Available online 18 September 2008
Keywords: Affymetrix Candidate genes Microarray analysis Quantitative trait loci Rice
Root morphology Wax layer
Fine mapping can accurately identify positional candidate genes for quantitative trait loci (QTLs) but can be time consuming, costly, and, for small-effect QTLs with low heritability, difficult in practice. We propose an alternative approach, which uses meta-analysis of original mapping data to produce a relatively small confidence interval for target QTLs, lists the underlying positional candidates, and then eliminates them using whole-genome transcriptomics. Finally, sequencing is conducted on the remaining candidate genes allowing identification of allelic variation in either expression or protein sequence. We demonstrate the approach using root-growth QTLs on chromosomes 2, 5, and 9 of the Bala × Azucena rice mapping population. Confidence intervals of 10.5, 9.6, and 5.4 cM containing 189, 322, and 81 genes, respectively, were produced. Transcriptomics eliminated 40% of candidate genes and identified nine expression polymorphisms. Sequencing of 30 genes revealed that 57% of the predicted proteins were polymorphic. The limitations of this approach are discussed.
© 2008 Elsevier Inc. All rights reserved.
Root morphology and architecture play an important role in whole-plant development, from the anchorage of the plant to the acquisition of nutrients and water. A large number of quantitative trait loci (QTLs) have been identified in rice for root morphological characteristics[1]. It is generally accepted that these QTLs are affected by environmental factors; however, a number of QTLs from the Bala × Azucena mapping population are stable across a wide variety of differing environments[2]. The isolation of the genes that underlie stable QTLs will provide useful alleles for rice breeding programs and give a better understanding of the genetic regulation of root growth in all plants.
The categories of genes that have been the focus of physiological studies aimed at explaining root growth and morphology are varied. Genes involved in cell division and expansion[3], cell wall loosening and hardening[3], sugar metabolism[4], and hormone signaling (for review see[5]) as well as transcription factors have all been studied to some degree. With the availability of a vast number of mutants, especially inArabidopsis, it has recently been possible to demonstrate that complex interactions between hormones and related signaling pathways play an important role in root development (for review see
[6]).
Based on the knowledge summarized above, a number of attempts have been made to link genes thought to be involved in root development/morphology with QTL mapping. For example Zheng and colleagues[3,7]mapped expressed sequence tags of four cell-wall-related genes (expansins OsEXP2 and OsEXP4, an extension-like gene, and a xyloglucan endotransglycosylase) in rice and found that they were on the intervals for root trait QTLs in rice. But this
approach does not provide great confidence in gene candidacy
because of the large theoretical size of the QTL, the large number of potential candidate genes, and the fact that many genes exist in large families (for example, there are at least 40 expansins in rice[8]). Fine mapping via the production of near-isogenic lines and the generation of a very large recombinant population is a more reliable approach to gene identification (for example, see [9]). However, this requires considerable effort to generate the genetic material and depends on error-free differentiation of plants with the positive and negative alleles of the QTL, which is often practically challenging for small-effect QTLs. To date only one gene controlling a root morphology/ architecture QTL has been identified. The gene underlying a root elongation QTL inArabidopsiswas identified as an invertase gene by map-based cloning [4]. Map-based cloning is costly and, in crop
plants with a longer generation time than Arabidopsis, time
consuming. In theory a different approach is possible, which uses large sets of previously generated QTL data. It has been demonstrated that QTLs are more accurate than previously believed[10]. Price[10]
showed that 20 QTLs that had either been cloned or accurately tagged lay within 2 cM of the original QTL. It should be possible to
☆ Sequence data from this article have been deposited with the GenBank Data Library under Accession Nos. EU605814–EU605869.
* Corresponding author. Fax: +44 1224 272703. E-mail address:[email protected](A.H. Price).
0888-7543/$–see front matter © 2008 Elsevier Inc. All rights reserved. doi:10.1016/j.ygeno.2008.07.002
Contents lists available atScienceDirect
Genomics
take a large set of data for stable QTLs, gathered under various environmental conditions, and produce a mean location (and confidence interval) of the QTL using meta-analysis techniques. Within the confidence interval, a list of positional candidate genes can be constructed from the publicly available databases. Expression analysis of genes within the candidate region can then be used to reduce the candidate gene list, which can be further refined by assessing allelic diversity, either in expression levels or in nonsynon-ymous substitution revealed by sequencing.
In this study we focused on three rice root QTLs from the Bala × Azucena mapping population. Thefirst is located on chromo-some 2, where QTLs for root mass at depth, root-to-shoot ratio, root thickness, penetration ability of a wax layer, and root length in hydroponics and soil have been detected in a number of studies[2,11–
13]. The second QTL is on chromosome 5 and has been detected for root length in hydroponics and soil, root mass at depth, root dry weight, root thickness, and root penetration ability[2,11–13]. The third QTL is located on chromosome 9 and QTLs for root length, root mass at depth, root thickness, and root-to-shoot ratio have been detected in this location[2,12,13]. As two of the QTLs of interest are root penetration QTLs, an experiment was designed that would test for whole-genome gene expression in root tips either impeded by a wax layer or not impeded.
We demonstrate that it is possible, in some cases, to create a list of potential candidate genes as small as 62 genes for a root-growth QTLs. We also discuss factors that impeded the narrowing of the candidate genes lists and potential ways that these factors could be overcome.
Results
Position of candidate gene regions
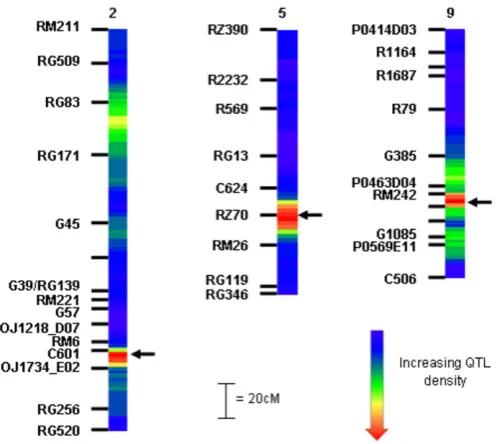
A heat diagram of the QTLs on the three target chromosomes is presented graphically inFig. 1, with regions of highest QTL density being indicated in red. The regions focused on in this study are indicated by an arrow. The best-fit model from the meta-QTL analysis is presented inTable 1. From thefigure, three regions of high QTL density were observed on chromosome 2, one at approximately 45 cM, one at approximately 95 cM, and a very dense region of QTLs
at approximately 155 cM. The initial meta-QTL analysis for chromo-some 2, which used 67 root traits, revealed four meta-QTLs, which are found at 12.5, 42.5, 99, and 157.5 cM (Fig. 2). This analysis therefore confirmed the presence of multiple QTLs and identified one additional QTL at the top of the chromosome not revealed by the heat map. For chromosome 5 a single region of high QTL density at 90 cM is evident fromFig. 1. The initial meta-analysis used 37 traits and revealed two meta-QTLs, one at the top of the chromosome (17.9 cM) and the region of interest at 88.3 cM. FromFig. 2, chromosome 9 has two dense root QTL regions, one at approximately 70 cM and the other at approximately 85 cM, with a region of less-dense QTLs at approximately 100 cM. The initial meta-analysis using 61 root traits gave three meta-QTLs, one at 60.9 cM, one at 80 cM, and the third at 99.4 cM.
To get a more accurate position of the meta-QTLs a single QTL was used for each experiment to determine the meta-QTL locations. The target meta-QTL on chromosome 2 initially placed at 157.5 cM was given a mean position of 156.7 cM and confidence interval of 151.4–
161.9 cM (Fig. 2) after the second analysis based on QTLs from 9 experiments. For chromosome 5, the initial meta-QTL (at 88.3 cM) was given a mean position of 87.3 cM and a confidence interval of 82.5–
92.1 cM generated from 11 experiments. The meta-QTL on chromo-some 9 initially positioned at 80.0 cM was given a mean position of 80.1 cM with a confidence interval of 77.4–82.8 cM based on 8 experiments.
Genes within candidate gene regions
A list of the genes within the candidate regions is presented in Supplementary Tables 1–3 for chromosomes 2, 5, and 9, respectively. All the DNA elements annotated as mobile elements have been removed from the gene lists for subsequent analysis.
The target meta-QTL for chromosome 2 spans a physical distance of 1.3 Mb (29.93–31.26 Mb), containing 189 genes of which 118 have a predicted function or motif, 37 are annotated as “expressed protein,” and 34 are annotated as “hypothetical protein” in Pseudomolecules 5. For chromosome 5 the meta-QTL spans a 2.4-Mb (23.12–25.52 Mb) region containing 322 genes of which 186 have a predicted function or motif, 56 are described as expressed proteins, and 80 are hypothetical proteins. The target meta-QTL on chromo-some 9 spans 0.6 Mb (18.68–19.24 Mb), which includes 81 annotated genes. Of these 47 either have been assigned a predicted function or have a recognized motif, 19 of these are annotated as expressed proteins, and 15 are annotated as hypothetical proteins. As the three candidate gene regions are all root-growth QTLs and may represent the effect of similar underlying genes, an analysis of gene annotation was performed on all three lists (Table 2). Two gene annotations are present in all three lists,“DNA-binding protein” and“nucleic acid-binding protein.”Both of these annotations are very common within the rice genome; 401 genes are annotated as DNA-binding protein and 107 genes are annotated as nucleic acid-binding protein. A number of genes with the same annotation are present in more than
Fig. 1. Intensity maps of chromosomes 2, 5, and 9 for root-trait QTLs from the Bala × Azucena mapping population. The maximum density is 23, 22, and 27 QTLs for chromosomes 2, 5, and 9, respectively.
Table 1
Meta-QTL analysis for all root trait data on chromosomes 2, 5, and 9
Chromosome
2 5 9
Modela
4 2 3
Meta-QTL 1 12.5 (5.1–19.9 17.9 (7.2–28.5) 60.9 (57.3–64.5) Meta-QTL 2 42.5 (39.5–45.5) 88.3 (85–91.5) 80 (77.9–82.2)
Meta-QTL 3 99 (94.1–103.8) — 99.4 (94.9–104)
Meta-QTL 4 157.5 (153.9–161.1) — —
Positions indicated in bold are the meta-QTLs focused on in this study. The value is the position of the meta-QTL (in cM) with the range of the meta-QTL in brackets (95% CI).
a
Model indicates how many QTLs were present in the best-fit model for each chromosome.
Fig. 2.Meta-QTL analysis of root traits on chromosome 2. Left: Meta-analysis of all the root QTL data that map onto chromosome 2. Right: Reduced meta-analysis for the fourth meta-QTL, using only one QTL from each experiment.
G.J.
Nort
on
et
al.
/
Genomics
92
(20
08)
344
–
one list. One that we consider noteworthy is “auxin hydrogen symporter.”Using a less stringent analysis, which uses all parts of the gene annotation separately, the term “auxin” appears in all three lists. The lists on chromosome 5 and 9 have a gene annotated as an auxin hydrogen symporter, while on chromosome 2 there is a gene annotated as an“auxin efflux carrier component 1”.
Root penetration assay
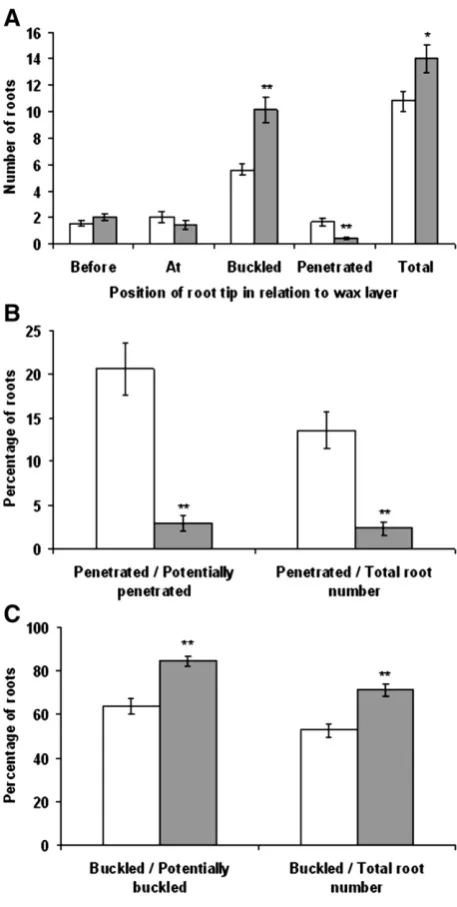
To measure gene expression in response to a hard layer, a wax layer system was used. The number of roots in different positions relative to the wax layer (before the wax layer, at the wax layer, buckled at the wax layer, or through the layer) is presented inFig. 3A. A significantly greater number of Bala main root axis buckled at the wax layer compared to Azucena (pb0.001), and a greater number of Azucena roots were observed penetrating the wax layer (pb0.001). Also, Bala had significantly more main root axes than Azucena (p= 0.016). When the number of roots penetrating the wax layer was calculated as either a percentage of the total number of roots reaching the wax layer (at, penetrating, and buckled) or a percentage of the total root number (Fig. 3B), Azucena had a significantly greater percentage of root axes penetrating the wax layer (pb0.001 in both cases). Bala had a significantly greater percentage of root axes buckling at the wax layer when the number of buckled roots at the wax layer was calculated as either a percentage of the total number of roots reaching the wax layer (at, penetrating, and buckled) or a percentage of the total root number (Fig. 3C) (pb0.001 in both cases).
Global gene expression
The Affymetrix whole-genome array was used to assess the expression of genes in root tips of Bala and Azucena at the wax layer and of Azucena root tips that were before the layer or buckled after hitting it. An average of 44.2% of the probe sets were expressed over the nine arrays challenged with Azucena mRNA, and 43% of the probe sets were expressed over the three arrays challenged with Bala mRNA. No probe sets were significantly differentially expressed between the three classes of Azucena root tips in relation to the wax layer. However, a large number of probe sets were significantly differentially regulated between Azucena and Bala root tips at the wax layer. A total of 1679 genes were differentially regulated by twofold or greater. The number with higher expression in Azucena compared to Bala was 612, and 1067 probe sets were lower in expression in Azucena relative to Bala. A number of the genes differentially regulated between the genotypes were confirmed by real-time PCR. A total of 10 genes were tested (Table 3) and in general the agreement
between Q-PCR and the array was very good, with a correlation of 0.95. Two genes identified as differentially regulated in the array, but by a relatively small log ratio, were not confirmed as significantly differentially regulated in the Q-PCR, although in both cases there was evidence indicative of agreement.
Gene expression within candidate gene regions
For the three candidate gene regions, probe sets were assigned to the predicted annotated genes and the expression data used to determine expression of the candidate genes. Those that are differentially expressed between Azucena and Bala within the three target regions are presented inTable 4. For the candidate gene region on chromosome 2, 170 of the 189 genes could be assigned at least one probe set. A total of 104 genes of the 170 with probe sets were expressed in at least one variety, while 66 genes were never ex-pressed in either variety. Three probe sets were differentially regulated between Azucena and Bala. Probe sets Os.20406.1.S1_a_at (Os02g49332,
Fig. 3.Root penetration analysis of Azucena and Bala roots. (A) Number of roots in relationship to the 60% wax layer and total number of roots. (B) Number of penetrated roots. (C) Number of buckled roots. Significant differences between Azucena (open bar) and Bala (shaded bar) are indicated as *pb0.05, **pb0.01.
Table 2
TIGR gene annotations that are present in more than one candidate gene region (+ indicates in which list they occur)
TIGR gene annotation Chromosome
2 5 9
ATP-binding protein + + –
Brassinosteroid insensitive 1-associated receptor kinase 1 precursor
+ + –
BSD domain-containing protein + +
DNA-binding protein + + +
GDSL-like lipase/acylhydrolase family protein + + –
GPI-anchored protein + + –
Auxin hydrogen symporter – + +
Lipid-binding protein – + +
Nucleic acid-binding protein + + +
Protein-binding protein + +
Protein kinase domain-containing protein + – +
Spotted leaf protein 11 + + –
Transferase + + –
Transferring glycosyl groups + + –
Zinc-knuckle family protein + + –
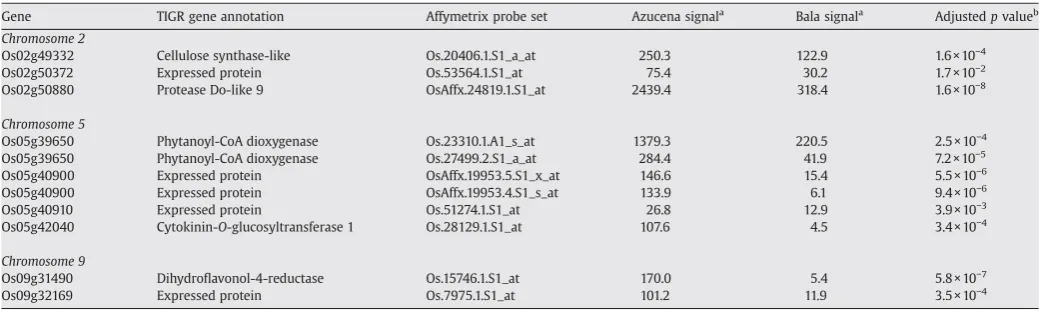
cellulose synthase-like), Os.53564.1.S1_at (Os02g50372, expressed pro-tein), and OsAffx.24819.1.S1_at (Os02g50880, protease Do-like 9) were all significantly upregulated in Azucena compared to Bala.
Within the candidate region on chromosome 5, 281 of the 324 genes could be assigned at least one probe set. A total of 165 genes of the 281 with probe sets were expressed in at least one variety. Within the candidate gene region six probe sets were differentially expressed between Azucena and Bala. Probe sets Os.23310.1.A1_s_at and Os.27499.2.S1_a_at (both representing Os05g39650, phytanoyl-CoA dioxygenase), OsAffx.19953.5.S1_x_at and OsAffx.19953.4.S1_s_at (both representing Os05g40900, expressed protein), Os.51274.1.S1_at (Os05g40910, expressed protein), and Os.28129.1.S1_at (Os05g42040, cytokinin-O-glucosyltransferase) were all upregulated in Azucena compared to Bala.
For the candidate region on chromosome 9, 69 of the 81 genes could be assigned at least one probe set. A total of 50 of the 69 genes with probe sets were expressed in at least one variety, and only 19 genes were never expressed in either variety. Within the candidate gene region two probe sets were differentially regulated between Azucena and Bala. Probe sets Os.15746.1.S1_at (Os09g31490,
dihydro-flavonol-4-reductase) and Os.7975.1.S1_at (Os09g32169, expressed protein) were significantly higher in expression in Azucena.
Allelic diversity of genes with the candidate gene regions
An attempt was made to sequence a number of candidate genes from the target gene regions on chromosomes 2 and 9, choosing to
concentrate on those that had an average array expression level of 50 as determined by the Microarray Analysis Software 5.0 (MAS5.0). A total of 30 genes were successfully sequenced, with an average transcript length of 880 bp. A comparison of sequences was performed between Azucena and Bala and between Azucena and Nipponbare sequences for the genes taken from the TIGR pseudogene assemblies. The frequency of single-nucleotide polymorphisms (SNPs) between Azucena and Bala within the coding regions was 1 per 462 bases, and 48.5% of these SNPs led to a change in the predicted amino acid sequence. Of the 30, 17 genes had at least one amino acid substitution in the predicted protein between Azucena and Bala. The frequency of SNPs between Azucena and Nipponbare was low, with a SNP every 2033 bases within the coding regions and with 21.9% of these SNPs leading to an amino acid change. Thus 6 genes differed between Azucena and Nipponbare in predicted protein sequence.
Discussion
Root penetration and global gene expression
For the root penetration experiment a wax layer of 60% was selected, as it showed the greatest differentiation between Azucena's and Bala's ability to penetrate hard wax layers. Previously an 80% layer was used in a larger tube system to map QTLs for root penetration in the Bala × Azucena mapping population[11]. However, an 80% wax layer so severely impeded both varieties in the rhizotrons used here that no varietal difference could be detected. Nevertheless, the percentage of penetrated roots agrees with the previous study in which 21.4 and 2.6% of Azucena and Bala penetrated the 80% wax layer
[11], compared to 20.5 and 2.9% for Azucena and Bala in 60% wax in this study (Fig. 3).
A comparison of the expression profiles between the three conditions of Azucena root tips showed no difference in gene expression between the three root tip classes. This is interesting since increased root diameters have been observed in impeded roots (e.g., [14,15]), and this might be expected to be a gene-regulated response.
Candidate genes for root QTLs
There was a great deal of variation in the number of genes within the predicted target regions, for example, only 81 annotated genes for chromosome 9 compared to 322 for chromosome 5. The gene density in each region is similar, at approximately 140 genes per megabase.
Table 4
Genes that show significant differential gene expression between genotypes within the three candidate gene regions
Gene TIGR gene annotation Affymetrix probe set Azucena signala
Bala signala
Adjustedpvalueb Chromosome 2
Os02g49332 Cellulose synthase-like Os.20406.1.S1_a_at 250.3 122.9 1.6 × 10⁻⁴
Os02g50372 Expressed protein Os.53564.1.S1_at 75.4 30.2 1.7 × 10⁻²
Os02g50880 Protease Do-like 9 OsAffx.24819.1.S1_at 2439.4 318.4 1.6 × 10⁻⁸
Chromosome 5
Os05g39650 Phytanoyl-CoA dioxygenase Os.23310.1.A1_s_at 1379.3 220.5 2.5 × 10⁻⁴
Os05g39650 Phytanoyl-CoA dioxygenase Os.27499.2.S1_a_at 284.4 41.9 7.2 × 10⁻⁵
Os05g40900 Expressed protein OsAffx.19953.5.S1_x_at 146.6 15.4 5.5 × 10⁻⁶
Os05g40900 Expressed protein OsAffx.19953.4.S1_s_at 133.9 6.1 9.4 × 10⁻⁶
Os05g40910 Expressed protein Os.51274.1.S1_at 26.8 12.9 3.9 × 10⁻³
Os05g42040 Cytokinin-O-glucosyltransferase 1 Os.28129.1.S1_at 107.6 4.5 3.4 × 10⁻⁴
Chromosome 9
Os09g31490 Dihydroflavonol-4-reductase Os.15746.1.S1_at 170.0 5.4 5.8 × 10⁻⁷
Os09g32169 Expressed protein Os.7975.1.S1_at 101.2 11.9 3.5 × 10⁻⁴
a
Values presented after normalization using the MAS5.0 software. b
Adjustedpvalue calculated from GCRMA normalized data and corrected using a Benjamini and Hochberg correction[36].
Table 3
Signal log ratios (SLR) of 10 genes analyzed by both quantitative RT-PCR and microarray analysis
Probe set Locus Q-PCR
SLR
Q-PCR pvalue
Array SLR
Array adj. pvalue
Os.20406.1.S1_a_at Os02g49332 0.74 0.060 1.45 b0.001 Os.14497.1.S1_at Os10g15164 −5.88 b0.001 −3.61 b0.001 Os.50589.1.S1_at Os02g47500 6.29 b0.001 7.26 b0.001 Os.57133.1.S1_at Os12g08030 12.25 b0.001 7.79 b0.001 Os.22857.1.A1_at Os01g36820 −10.72 b0.001 −7.53 b0.001 Os.54366.1.S1_at Os08g27540 9.82 b0.001 6.50 b0.001 Os.57140.1.S1_at Os06g38594 9.31 b0.001 5.71 b0.001 Os.51274.1.S1_at Os05g40910 3.81 0.017 1.13 0.004 Os.53564.1.S1_at Os02g50372 0.61 0.143 1.28 0.017 Os.28129.1.S1_at Os05g42040 2.03 b0.001 4.52 b0.001
The reason the chromosome 9 list has one-quarter of the genes compared to 5 is that it has approximately half the confidence interval in the Bala × Azucena map (5.4 vs 9.4 cM); for chromosome 9 the genetic distance in the Rice Genome Project (RGP) map is much smaller than in the Bala × Azucena map (not so in chromosome 5), and the rate of recombination in the RGP map appears to be higher at this region of chromosome 9 (4.8 cM Mb−1) than in that of chromosome 5
(3 cM Mb−1).
It is considered noteworthy that a gene involved in auxin transport appears in all three candidate gene lists. Auxin is a central molecule in
root development and growth [5] and therefore these are good
candidate genes based on function.
The expression analysis had two limitations that affected the ability to eliminate genes within the target region. First, between 10.5 and 17% of genes in the target regions had no matching probe sets on the Affymetrix rice array. It should be noted that, on average, 43% of these are annotated as hypothetical proteins and have no matching EST/full-length cDNA, which suggests they are not likely to be functional genes. Second, a surprisingly large number of genes were expressed in the target region. The global level of gene expression was 44%, yet that observed in the target regions ranged from 60 to 75%. It is possible that this high number of expressed genes in regions under QTLs represents genomic regions with higher root-specific gene activity. However, comparison with unpublished array data from leaves of Azucena and Bala suggests this is not the case, it is simply that these regions have a high proportion of genes being expressed.
It has been recently demonstrated that some genotypic variations in phenotype are more likely to be caused by differences in gene expression rather than by polymorphisms in the coding DNA[16]. Therefore, it seems logical that the genes showing a significant difference in expression between Azucena and Bala within the can-didate gene regions (Table 4) are good candidate genes. On chromo-some 2, three genes were significantly differentially regulated and one is annotated as a CSLE2—cellulose synthase-like family E. These enzymes are involved in the synthesis of polysaccharides that contribute to the primary cell wall[17]. Therefore this is an interesting category of genes, as it was observed by Whalley and colleagues (unpublished) that there is an alteration in the bending stiffness of rice roots after penetration of the wax layer and this may be due to an alteration in the cell wall properties. On chromosome 5 four genes were differentially regulated between Azucena and Bala (two of which were annotated as expressed protein). One (cytokinin-O -glucosyl-transferase 1) glycosylates cytokinins (for review see[18]). Cytokinins are involved in a whole range of plant growth and development including shoot/root balance (for review see[18]). This general effect on plant growth highlights this gene as a good candidate. On chromosome 9 there are two differentially regulated genes, one of which is a dihydroflavonol-4-reductase. This class of genes is involved in the synthesis of anthocyanins; however, the gene shows N70% similarity to cinnamoyl-CoA reductase from Arabidopsis thaliana.
Cinnamoyl-CoA reductase is an enzyme involved in lignin biosynth-esis[19]. It has been shown that the cloned cinnamoyl-CoA reductase fromEucalyptus gunniishowed a very high level of homology with dihydroflavonol-4-reductase, and this level of homology could explain the discrepancy between the annotation from TIGR and the similarity search. If this gene is involved in lignin biosynthesis, it is a potential candidate gene, as lignin is an integral part of the cell wall and, as mentioned above, cell-wall properties may be an important factor in root growth. It has recently been shown that tobacco plants with downregulated cinnamyl alcohol dehydrogenase activity and hence reduced lignin biosynthesis have a 50% reduction in root stiffness[20]. For genes in the candidate lists on chromosomes 2 and 9 an effort
was made to sequence those that had an expression of N50 as
determined using MAS5.0 (no other basis of selection was used). A priori, we had no idea of the level of sequence polymorphism between Bala and Azucena. However, it was previously demonstrated that
across the entire genome of Nipponbare (japonicasubspecies) and 93-11 (indica) a SNP occurs every 268 bp and an indel every 953 bp[21]. To compare the sequence variation between Bala and Azucena, 26 kb of sequence was obtained from mRNA of genes in the target regions of chromosomes 2 and 9. A SNP was detected every 462 bases within the coding sequence (compared to one every 358 bases in the coding sequence of these genes between Nipponbare and 93-11), and 48.5% of these led to a nonsynonymous amino acid alteration. This equated to 17 of the 30 genes having at least one nonsynonymous alteration between Azucena and Bala, and 6 of these genes had a nonsynon-ymous alteration between Azucena and Nipponbare.
The success and value of the method
The method described here relies on three steps to produce a manageable list of positional candidate genes. First, the meta-analysis to produce a relatively small initial list, second the transcriptomics both to eliminate the majority and to identify expression polymor-phism candidates, andfinally the sequencing to eliminate more and identify nonsynonymous SNP candidates. We consider that thefirst step was relatively successful insofar as at least one of the gene lists produced (chromosome 9) was small, even though that for chromo-some 5 was too large to handle adequately. In addition to identifying potential expression polymorphisms, the transcriptomics was able to eliminate 28–41% of candidates because they were not expressed. Clearly, the success of this elimination step will depend on the proportion of genes in the target region that are expressed and that can be expected to vary across the genome. Finally, the degree of DNA and predicted amino acid polymorphisms was very high. A priori the degree of polymorphism between Bala and Azucena was not known, but presumably reflects the fact that Azucena is a tropicaljaponica
variety, whereas Bala is normally classified as anindica.However, Bala is a cross between N22 (recently identified as a tropicaljaponica[22])
and the indica TN1 [23], so the high polymorphism is perhaps
unfortunate. Certainly, however, the choice of parents for the mapping population, which maximizes the ability to detect QTLs for multiple agronomically important traits, has limited the ability to eliminate candidate genes based on sequence polymorphism. One option to examine further if any of these polymorphisms are good candidates would be to sequence alleles from parents of other mapping populations in which the QTLs are identified and, in particular, in cases in which QTLs are detected in populations of which the parents come from the same rice subspecies. For example, in the case of the QTL on chromosome 9 (at 18.77 Mb) two populations appear useful
[24,25]. However, care must be taken in this approach, since there must be confidence that the QTLs in those populations are accurately attributable to the one targeted here, not the other root QTLs on chromosome 9, and that is not certain with the data currently available.
Despite the unpredicted limitations highlighted above, a number of testable candidate genes have been produced using this approach. Currently, good functional candidates for root QTLs are not available. As understanding of gene function continues to grow, however, the method described here is likely to become an increasingly attractive and valuable alternative tofine mapping.
Materials and methods
Calculating the mean position of root-trait QTLs using meta-analysis
Data from previous root screening experiments from the Bala×Azucena mapping populations were used to determine the locations of the mean QTLs[2,11–13]. Included are data from an unpublished hydroponic experiment in which all 205 recombinant inbred lines (RILs) of the mapping population were grown as described by Price and colleagues
[26], except that the light level was rather low (200 μmol m−2s−1
photosynthetically active radiation (PAR)). All raw data were re-analyzed using an updated molecular map that includes 95 restric-tion fragment length polymorphism markers, 22 amplified fragment length markers, 26 microsatellite markers, 20 PCR-based markers, and a single transposon marker. The map covers 1832.8 cM on 12 linkage groups. The identification of QTLs was performed by com-posite interval mapping using the program QTLCartographer version 1.15. Background markers for composite interval mapping were selected by forward stepwise regression with backward elimination using the default setting. The default window size was set at 10 cM. QTLs with a lod score of 2.5 or greater were used for meta-QTL analysis.
An initial meta-QTL analysis was conducted to determine the number of QTLs on a chromosome and their mean position using all available root trait data collected from the Bala × Azucena mapping population (totaling 122 root traits). This was achieved using the program BioMERCATOR version 2.1 [27], which calculates a
con-fidence interval of each QTL from the population size and the
proportion of variance (R2) explained by the QTL[28]. In this analysis, models with one, two, three, four, or more than four QTLs are tested and the one with the lowest AIC value is considered the bestfit. Once the number of root meta-QTLs on the chromosomes had been established, a second analysis was performed for a single meta-QTL using only one individual QTL from each independent experiment,
that being chosen as the QTL with the largest R2 value. This
eliminates bias caused by repeated measurements so that multiple QTLs from pleiotropically related traits from individual experiments are not double counted. For example, MacMillan and colleagues[2]
detected QTLs for four root traits in four environments (four independent experiments). Only one QTL was taken from each experiment, meaning that a maximum of four QTLs from the data could be used to produce the confidence interval. The confidence interval generated from this analysis was used to list candidate genes.
Generation of chromosome-intensity maps
The production of color-coded intensity maps for the individual trait datasets was carried out using Visual Basic 6.0. An appropriate color scheme wasfirst selected, with blue representing the least density, moving up through green and yellow to red, which represented the greatest density. The values used in the production of the intensity maps was the 1 LOD range around the lod peak for each root trait. The trait datasets were read in and the maximum value for each dataset was determined. This maximum value then allowed the color scale to be adjusted so as to produce intensity maps with the best possible contrast in colors. The density at each location on the maps was determined by integrating the overlapping ranges given in the QTL datasets. When each range had been integrated, the maximum density could then be determined and used to rescale the color scheme. The length of the intensity map equaled the range of the chromosome being used in each case and so varied appropriately.
Producing annotated gene lists
The Bala × Azucena genetic map was linked to the sequenced rice genome genetic map and physical position by using the available sequence information for the RFLP- and PCR-based markers (from the Gramene Website) and identifying which BACs they were located on by BLAST search at the NCBI Web site. The genetic and physical positions of each BAC are available from the TIGR rice database (www.tigr.org). A list of genes between two physical positions was generated using the Genome Annotation Data Download tool of Pseudomolecules 5 at TIGR. Genes annotated as transposons, transposable elements, and retrotransposons were removed from the candidate gene list.
Analysis of gene annotation within multiple gene lists
The list investigation software attempts to locate words or phrases that occur in more than one of the lists. The software runs the list investigation using two different sets of criteria: for thefirst, the phrases used must be complete strings of words that occur in the lists; for the second, the only conditions for a phrase to be considered valid is that the words it contains appear in the same order in which they appear originally in the longer phrase and that no words are cut out from within this shorter phrase. So for the first, or “stringent,”
examination, if a phrase“A B C”existed in a list, then the software would check for occurrences of the phrase“A B C”in other lists. For the second,“nonstringent,”examination, the same phrase would result in the software examining other lists for the phrases“A”,“B”,“C”,“A B”,
“B C”, and“A B C”.
Thefiles in which each word or phrase exists are recorded in an outputfile along with these words or phrases. An upper limit of 12 was placed on the number of text lists that could be examined for common phrases, as the number of permutations of phrases increases rapidly with the number of lists. In the work carried out here, only three lists at a time were examined.
Root penetration assay
The ability of roots to penetrate a hard layer was measured using a modified version of the wax-layer method of Yu and colleagues[29]. A chamber with the internal dimensions of 10 × 5 × 25 cm consisting of a glass back, Perspex front, and aluminum spacers with an open bottom and top was set at an angle of 15° in a large sand-filled tray andfilled up to 19.5 cm with dry sand. The sand was watered with nutrient solution[30], the sand was leveled, and then a 5-mm-thick 60% wax layer (prepared using a ratio of 3:2 (w/w) of pastillated paraffin wax/ white soft wax) was poured onto the sand. Once the wax layer had set, two small holes were placed at the back of the wax layer to allow water drainage and water exchange via capillary action. The chamber
was then filled up with more dry sand and then watered using
nutrient solution. Nutrient solution was then added to the large tray in which the chamber had been placed; this was regularly topped up and allowed the watering of the chamber by capillary action. Light was eliminated from the chambers using white (exterior face)/black (interior face) plastic sheeting.
Azucena and Bala seeds were surface sterilized with 1% (v/w) sodium hypochlorate for 5 min, then rinsed thoroughly three times with water, and then germinated on moist tissue paper for 48 h at 37 °C. A single germinated seed was then sown 1 cm below the surface of the sand in each chamber.
The plants were grown in a controlled-environment room with a 12-h day and night, a day temperature of 30 °C and a night tempe-rature of 24 °C, with 300μmol m−2s−1PAR. After 24 days the chamber
was dismantled and the number of nodal root axes falling into the following categories counted: (a) not yet reached the wax layer, (b) at the layer, (c) buckled at the layer, (d) penetrating the layer. Analysis of variance (ANOVA) was performed between the various root classes to ascertain statistical significance. Root tips 5 mm in length were harvested from Azucena plants for subsequent RNA extractions from thefirst three categories as follows: (a) roots that were between 5 and 10 mm above the wax layer, (b) roots at the wax layer, (c) roots that had buckled at the wax layer and grown 7–10 mm after buckling. From Bala plants, only root tips at the layer were harvested.
Microarray experiments
were pooled from 10 biological replicates (plants) grown in two independent experimental replicates (two different times of sowing at least 1 month apart). A total of 100 mg of root was used for each RNA extraction using the TRIzol method (Invitrogen) followed by further purification and DNase treatment using the RNeasy clean-up system (Qiagen). RNA was processed for use with the Affymetrix GeneChip Rice Genome array according to the manufacturer's protocol. Briefly, 5μg of total RNA was used in the one-cycle cDNA synthesis reaction. After the generation of double-stranded cDNA an in vitro transcription reaction was performed to generate biotinylated cRNA. cRNA quality was assessed for fragment length using a bioanalyzer (Agilent 2100). Hybridization, washing, staining, and scanning procedures of the Affymetrix Test 3 arrays and Affymetrix GeneChip Rice Genome arrays were carried out by the Microarray Core Facility of the Institute of Medical Sciences, University of Aberdeen, United Kingdom, as described in the Affymetrix technical manual. Microarray datasets were deposited in the GEO public database, Series Accession No. GSE10857.
Analysis of array data
Expression analysis was initially carried out using MAS5.0 from the Affymetrix GeneChip Operating software (version 1.3). Further analysis was performed using the Bioconductor package[31]using R
[32]. The data were normalized using the modified robust multiarray average (RMA)[33]method GCRMA[34], which takes into account the GC content when doing RMA normalization. Differential gene expression was measured using the LIMMA linear model[35]and a Benjamini and Hochberg[36]correction of thepvalue. Probe sets were counted as differentially expressed only if they met the following criteria: (1) there was a statistically significant differential expression (adjustedpvalue 0.05); (2) the fold change in gene expression was≥2.
Assignment of probe sets to genes
Probe sets were assigned to annotated genes using the Web-based search tool on the National Science Foundation Rice Oligonucleotide Array Project Web site (www.ricearray.org). Annotation was based on the TIGR Pseudomolecule 5 release of 2006 (www.tigr.org).
Confirmation of array data by real-time PCR
A total of 10 genes were selected for real-time PCR to confirm array results. Of those, 4 were genes that were differentially regulated within the candidate gene regions between Bala and Azucena; the remaining genes were differentially regulated elsewhere in the genome. The actin gene was also amplified to normalize the RNA loading. cDNA was synthesized from 1μg of total RNA using the ImProm-II cDNA synthesis kit (Promega) with an oligo(dT) primer. Control reactions were performed without the reverse transcriptase enzyme to verify that no DNA contamination was present in the RNA samples. PCR amplification was performed in a 25-μl volume containing 1μl of cDNA, 0.2× SYBR green, 16 mM (NH4)2SO4, 67 mM Tris–HCl (pH 8.8), 0.01% Tween 20,
1.5 mM MgCl2, 200μM dNTP mix, 0.5 units BioTaq (Bioline), and 0.25μM
each primer. Analysis was performed in an Opticon2 (MJ Research) with cycle conditions of an initial denaturing at 95 °C for 15 min followed by 35 cycles of 95 °C for 15 s, 55 °C for 15 s, and 72 °C for 30 s. ANOVA was performed between the genotypes to ascertain statistical significance.
Sequencing of potential candidate genes
Full-length cDNA (http://cdna01.dna.affrc.go.jp/cDNA/) or full-length coding sequences (www.tigr.org) were use to design primers for the potential candidate genes. PCR was performed on cDNA synthesized from mRNA extracted from root tips located at the wax layer. PCR products were sequenced.
Acknowledgments
Gareth Norton was funded by BBSRC Grant BB/C509931/1 and Farkhanda Khowaja was funded by EU Grant 01544468“CEDROME.”
Appendix A. Supplementary data
Supplementary data associated with this article can be found, in the online version, atdoi:10.1016/j.ygeno.2008.07.002.
References
[1] S. de Dorlodot, B. Forster, L. Pagès, A. Price, R. Tuberosa, X. Draye, Root system architecture: opportunities and constraints for genetic improvement of crops, Trends Plant Sci. 12 (2007) 474–481.
[2] K. MacMillan, K. Emrich, H. Piepho, C.E. Mullins, A.H. Price, Assessing the importance of genotype × environment interaction for root traits in rice using a mapping population. II. Conventional QTL analysis, Theor. Appl. Genet. 113 (2006) 953–964.
[3] B.S. Zheng, L. Yang, C.Z. Mao, W.P. Zhang, P. Wu, QTLs and candidate genes for rice root growth underflooding and upland conditions, Acta Genet. Sin. Engl. 33 (2006) 141–151.
[4] L.I. Sergeeva, et al., Vacuolar invertase regulates elongation ofArabidopsis thaliana roots as revealed by QTL and mutant analysis, Proc. Natl. Acad. Sci. USA 103 (2006) 2994–2999.
[5] E. Tanimoto, Regulation of root growth by plant hormones—roles for auxin and gibberellin, Crit. Rev. Plant Sci. 24 (2005) 249–265.
[6] S.A. Casson, K. Lindsey, Genes and signalling in root development, New Phytol. 158 (2003) 11–38.
[7] B.S. Zheng, et al., Mapping QTLs and candidate genes for rice root traits under different water-supply conditions and comparative analysis across three popula-tions, Theor. Appl. Genet. 107 (2003) 1505–1515.
[8] Y. Lee, D. Choi, H. Kende, Expansins: ever-expanding numbers and functions, Curr. Opin. Plant Biol. 4 (2001) 527–532.
[9] D. Vreugdenhil, M. Koornneel, L.I. Sergeeva, Use of QTL analysis in physiological research, Russ. J. Plant Physiol. 54 (2007) 10–15.
[10] A.H. Price, Believe it or not, QTLs are accurate! Trends Plant. Sci. 11 (2006) 213–216.
[11] A.H. Price, K.A. Steele, B.J. Moore, P.B. Barraclough, L.J. Clark, A combined RFLP and AFLP linkage map of upland rice (Oryza sativa L.) used to identify QTLs for root-penetration ability, Theor. Appl. Genet. 100 (2000) 49–56.
[12] A.H. Price, K.A. Steele, B.J. Moore, R.G.W. Jones, Upland rice grown in soil-filled chambers and exposed to contrasting water-deficit regimes. II. Mapping quantitative trait loci for root morphology and distribution, Field Crop Res. 76 (2002) 25–43.
[13] A.H. Price, J. Townend, M.P. Jones, A. Audebert, B. Courtois, Mapping QTLs associated with drought avoidance in upland rice grown in the Philippines and West Africa, Plant Mol. Biol. 48 (2002) 683–695.
[14] S.A. Materechera, A.M. Alston, J.M. Kirby, A.R. Dexter, Influence of root diameter on the penetration of seminal roots into a compacted subsoil, Plant Soil. 144 (1992) 297–303.
[15] C. Croser, A.G. Bengough, J. Pritchard, The effect of mechanical impedance on root growth in pea (Pisum sativum). II. Cell expansion and wall rheology during recovery, Physiol. Plant. 109 (2000) 150–159.
[16] G.A. Wray, The evolutionary significance of cis-regulatory mutations, Nat. Rev. Genet. 8 (2007) 206–216.
[17] T.A. Richmond, C.R. Somerville, Integrative approaches to determining Csl function, Plant Mol. Biol. 47 (2001) 131–143.
[18] H. Sakakibara, Cytokinins: activity, biosynthesis, and translocation, Annu. Rev. Plant Biol. 57 (2006) 431–449.
[19] E. Lacombe, et al., Cinnamoyl CoA reductase, thefirst committed enzyme of the lignin branch biosynthetic pathway: cloning, expression and phylogenetic rela-tionships, Plant J. 11 (1997) 429–441.
[20] O. Hamza, et al., Novel biomechanical analysis of plant roots (2006), in: A. Stokes, I. Spanos, J.E. Norris, L.H. Cammeraat (Eds.), Eco- and Ground Bio-engineering: the Use of Vegetation to Improve Slope Stability. Developments in Plant and Soil Sciences, Kluwer Academic, Dordrecht, 2006, pp. 13–20.
[21] Y. Shen, et al., Development of genome-wide DNA polymorphism database for map-based cloning of rice genes, Plant Physiol. 135 (2004) 1198–1205. [22] A.J. Garris, T.H. Tai, J. Coburn, S. Kresovich, S. McCouch, Genetic structure and
diversity inOryza sativaL, Genetics 169 (2005) 1631–1638.
[23] D. Chaudhary, M.J.B.K. Rao, Breeding rice varieties for dryland and drought-prone areas of India, Drought Resistance in Crops with the Emphasis on Rice, IRRI, Manila, 1982, pp. 265–272.
[24] H. Horii, K. Nemoto, N. Miyamoto, J. Harada, Quantitative trait loci for adventitious and lateral roots in rice, Plant Breed. 125 (2006) 198–200.
[25] A. Kamoshita, et al., Mapping QTLs for root morphology of a rice population adapted to rainfed lowland conditions, Theor. Appl. Genet. 104 (2002) 880–893. [26] A.H. Price, A.D. Tomos, D.S. Virk, Genetic dissection of root growth in rice (Oryza
sativaL.). I. A hydroponic screen, Theor. Appl. Genet. 95 (1997) 132–142. [27] J. Veyrieras, B. Goffinet, A. Charcosset, MetaQTL: a package of new computational
methods for the meta-analysis of QTL mapping experiments, BMC Bioinformatics 8 (2007).
[28] A. Darvasi, M. Soller, A simple method to calculate resolving power and confidence interval of QTL map location, Behav. Genet. 27 (1997) 125–132.
[29] L.X. Yu, J.D. Ray, J.C. O, 'Toole, H.T. Nguyen, Use of wax-petrolatum layers for screening rice root penetration, Crop Sci. 35 (1995) 684–687.
[30] S. Yoshida, D.A. Forno, J.H. Lock, K.A. Gomez, A Laboratory Manual for the Physiological Studies of Rice, IRRI, Manila, 1976.
[31] R.C. Gentleman, et al., Bioconductor: open software development for computa-tional biology and bioinformatics, Genome Biol. 5 (2004).
[32] R. Ihaka, R. Gentleman, R: a language for data analysis and graphics, J. Comput. Graph. Stat. 5 (1996) 299–314.
[33] R.A. Irizarry, et al., Exploration, normalization, and summaries of high density oligonucleotide array probe level data, Biostatistics 4 (2003).
[34] Z. Wu, R.A. Irizarry, R. Gentleman, F. Martinez-Murillo, F. Spencer, A model-based background adjustment for oligonucleotide expression arrays, J. Am. Stat. Assoc. 99 (2004) 909–917.
[35] G.K. Smyth, Linear models and empirical Bayes methods for assessing differential expression in microarray experiments, Stat. Appl. Genet. Mol. Biol. 3 (2004) 1–26.