The University of San Francisco
USF Scholarship: a digital repository @ Gleeson Library |
Geschke Center
Master's Theses Theses, Dissertations, Capstones and Projects
Spring 5-15-2014
Matrilineal Asset Inheritance, Female Bargaining
Power, and Household Welfare in Malawi
Nicholas T. Garcia
University of San Francisco, [email protected]
Follow this and additional works at:https://repository.usfca.edu/thes
Part of theAgricultural and Resource Economics Commons,Econometrics Commons, and the
Other Economics Commons
This Thesis is brought to you for free and open access by the Theses, Dissertations, Capstones and Projects at USF Scholarship: a digital repository @ Gleeson Library | Geschke Center. It has been accepted for inclusion in Master's Theses by an authorized administrator of USF Scholarship: a digital repository @ Gleeson Library | Geschke Center. For more information, please [email protected].
Recommended Citation
Garcia, Nicholas T., "Matrilineal Asset Inheritance, Female Bargaining Power, and Household Welfare in Malawi" (2014).Master's Theses. 96.
Matrilineal Asset Inheritance, Female Bargaining
Power, and Household Welfare in Malawi
Master’s Thesis
International and Development Economics
Key Words: Intrahousehold bargaining, divorce threat, child anthropometry, food consumption
Nicholas Garcia
Department of Economics University of San Francisco
2130 Fulton St. San Francisco, CA 94117
e-mail: [email protected]
May 2014
Abstract: Matrilineal inheritance practices in Malawi exogenously determine female land holdings at the time of marriage, allowing for the identification of the effect of increased female bargaining power on household consumption decisions. I use the matrilineal ethnicity of the head of household as an instrument for the share of total household land inherited by the female head or male head’s wife. I find that child’s height-for-age decreases with female assets, and evidence suggesting increased consumption from households’ own production. Since the food basket from own consumption is high in carbs but not nutritious, long-term child health suffers despite receiving more resources than their peers. This paper uses an extensive data set from Malawi to explore the nature of both cooperative and noncooperative household bargaining.
2
1. Introduction
In many countries, women are systematically discriminated against through socio-cultural practices and institutions. The differences in female agency manifest themselves in many ways, including: through marriage and reproduction practices, the way in which women earn and control household income, inheritance practices and laws, and expectations over contributions to household production. Female empowerment and increasing gender equity have become major motivations behind many development programs, and it is common for programs to be targeted toward women. Major progress has been made in improving the lives of poor women, and the world has achieved its Millennium Development Goal of gender equality for primary school education. Despite these major gains, gender empowerment remains a looming issue, even in rich countries such as the United States where women are paid less and do not have many of the same advancement opportunities as men. The pursuit of gender equal society begets many questions over mechanisms through which women actually become more empowered, how these shifts affect household bargaining dynamics, and their affect on household welfare in traditional heterosexual marriages.
A mounting body of literature has explored the relationship between intrahousehold bargaining and household welfare. Many studies in this literature find that female controlled income is more likely to be allocated toward household public goods and human capital investments for children, as compared to incomes controlled by men. Analysis of this hypothesis has been conducted for a number of indicators such as food consumption, nutrition, health expenditures, education expenditures, and child anthropometric outcomes (Doepke & Tertilt, 2011; Duflo, 2003). Furthermore, the findings are robust to studies in both poor and rich countries, agricultural and non-agricultural contexts, and variation in bargaining power resulting from from natural or program shocks.
3
households do not optimally redistribute to other household members Thus the literature suggests that bargaining in rural context may be more appropriately modeled through a Nash bargaining model, and the welfare of individuals within the household may be more or less depending on the distribution of income between decision makers (Doepke & Tertilt, 2011).
In Malawi, a poor, landlocked country of mostly subsistence, smallholder farmers, the ways in which household incomes are employed may have particularly salient effects on household utility and individual outcomes. Cultivation in Malawi is almost entirely rainfed, and farm incomes are often very susceptible to seasonal income shocks and perennially experience a severe hunger season, thus even small changes in household expenditures may be consequential for households living on the margin.
To better understand how female bargaining power affects the realization of household expenditure decisions, I analyze the impact of female land inheritance on child health indicators and household expenditures. Since the relationship between bargaining power and asset inheritance is likely endogenous — i.e., it is unclear whether girls with more bargaining power are more likely to inherit land or if land inheritance is likely to result in bargaining power — I exploit differences in matrilineal and patrilineal ethnic heritage of the household head to instrument for inheritance. Ethnic identity is salient amongst contemporary Malawians and ethnicity is exogenously determined for each individual at the time of birth. Matriliny of the household head controls for endogeneity in inherited land. Since land is passed down along the female line at the time of marriage, matriliny should predict the endowment of female bargaining power at the time of entering the marriage agreement. Amongst patrilineal groups, in which a bride price is expected at the time of marriage, women generally do not inherit any land and women’s primary mode of obtaining access to land is via marriage.
4
inheritance to study female bargaining power in this context and contributes to the bargaining literature by observing expenditure outcomes and human capital outcomes.
This paper is organized as follows: Section 2 provides a brief review of the theoretical literature on household bargaining and income sharing, as well as a survey of the related empirical literature; Section 3 provides an overview of my methodology and analytical framework; Section 4 presents and discusses results; and Sections 5 offers closing remarks.
2. Literature Review
2.1 Household Bargaining Theoretical Literature
Nash bargaining models offer a good starting point within the intrahousehold bargaining literature, since they were some of the first cooperative, non-unitary models to be developed. In a cooperative game model, Manser and Brown (1980) propose that husband and wife have unique preferences, and they reach an agreement on the optimal level of consumption and leisure. Households form if the marriage payout is greater than the payout for the individual in the single state. Households in this model are able to reach a Pareto optimum equilibrium, with the assumption that preferences are fully known (McElroy and Horney, 1981).
The Nash equilibrium is generalized in the collective model, in which the single state is as a “threat point”, defined as the utility obtained by an outside option (in the case of divorce). The optimum level of consumption is determined, in part, by the other member’s threat of divorce, which serves as a mechanism to keep the members within the cooperative game. The household maximizes the Nash product function, where utility is a function of consumption of husband (h) and wife (w) and the threat of the outside option with value T. In this case, the threat is a vector of factors Z that are determined by individual characteristics and the marriage market in the case of divorce.
An interesting result of this model is that if Z is influenced by yh or yw then the income
5
prices, individuals’ preferences, their independent incomes, and the distribution of power function µ. Their model can be summarized as follows:
The threat of the dissolution of marriage induces household decision makers to cooperate, but the distribution of income within the game can affect household outcomes if the distribution of income affects the relative welfare weighting between men and women. This will only be the case if shifts in income change the relative share of incomes after divorce. Thus, in the context of the divorce threat model, we expect that the relative endowments of assets at the time of marriage should be particularly relevant to household decision making when the original owners of the are able to hold on to them in case of divorce. Shifts in incomes that occur within the marriage, but cannot be definitively claimed by husband and wife after divorce, should be irrelevant to household bargaining power.
Lundberg & Pollak (1994) present some of the first noncooperative models of household bargaining, in which household members do not pool their individual incomes. Instead, members make independent consumption decisions by maximizing their utility subject to their separate budget constraint, while taking the decisions of the other household members as given. They present a simple two person household model in which individuals decide consumption of private goods x
and public goods q, which are consumed by both husband and wife. The husband chooses xh and qh
to maximize Uh(x
h, q) subject to q = q
h + qw and X h + pq
h = I
hwhere p is the price of the public good,
Ih is the husband's income and q w
is the public-good contribution of the wife. In this set up, the husband has a best response to the wife’s contribution to public goods and vice-versa, which will determine each’s optimal contribution.
6
include situations in which the optimum solution is for members to specialize in goods provision, rather than both contributing. The threat point in this model is the noncooperative equilibrium in which household contributions are enforced through social expectations, and the cooperative outcome occurs when members are able to come to an agreement regarding contribution. Thus, the threat point can occur within the marriage and be influenced by the distribution of income, whereas the threat point in the cooperative divorce model is the value of the outside option.
In the context of this study, land inheritance may influence female bargaining power through either model by increasing the value of a woman’s outside option in the case of divorce or by increasing her relative income, thereby making the within-marriage cooperative outcome more likely. Among matrilineal women, the divorce threat option is more relevant compared to patrilineal women, since patrilineal women typically do not inherit any land and have few claims to household assets in the case of divorce (given that divorce is a real option).
2.2 Empirical Literature
A sizeable empirical literature exists documenting the link between empowerment and household welfare. It is well documented that female empowerment promotes development, and studies have found that higher female resources are associated with better outcomes for children. Hoddinot and Haddad (1995) use data from Cote d’Ivoire and find that increased female income leads to higher expenditure shares on food and lower expenditures of alcohol and cigarettes. In a 1994 study with the same data, the authors find that female income share leads to higher height-for-age measurements for children, suggesting that female income share leads to more food allocation toward children.
7
Duflo and Udry (2004) find that rainfall shocks that increase female incomes leads to a 10 percent increase in purchased foods, while the relationship with male income changes are negative. Duflo (2003) finds that children in South Africa have better weight-for-age and height-for-age outcomes when their maternal grandmothers earn a pension, but find no effect when grandfathers or paternal grandmothers earn a pension. The effect is quite large: girls in households in which the maternal grandmother is a pension recipient have 1.19 SDs larger weight-for-height.
Attanasio and Lechene (2002) find that PROGRESA beneficiaries in Mexico have increased expenditure shares of boys’ and girls’ clothing resulting from increases in female income. Rubalcava, Teruel, and Thomas (2009) and Bobonis (2009) also confirm that higher percentage of female income leads to larger expenditures on child clothing.
Claudia Martínez (2013) has a much more recent study that points to the validity of the noncollective bargaining model by using a change in the child support rights for children born out of wedlock in Chile. In her study, a policy change increasing the level for support for these children differentially and exogenously benefits female incomes and bargaining power. Employing a difference-in-differences strategy, she finds significant decreases in male employment and increases in child school attendance. The increase in school attendance is interpreted as a movement toward female preferences (the child is not related to the male cohabitator) as a result of the increase in bargaining power. Martínez interprets the decrease in male employment as a “tax” on male utility as a result of lower bargaining power. Since this doesn’t correct any misallocations, there is greater inefficiency in household allocation.
In a key paper by Kennedy and Peters (1992), the authors find that female-headed households in Kenya and Malawi spend less on sin goods such as alcohol. They also find that these households spend more money of food and overall caloric intake.
While many of these studies struggle to identify a causal relationship, there is a consistency among the findings across many contexts and datasets. This suggests that the results indicating that more female empowerment leads to higher expenditures on food, education, and child goods are likely externally valid and are consistent with the findings in this study. Furthermore, this literature suggests strong evidence that female empowerment benefits child anthropometric outcomes, which are better measures of effective transfers toward children than expenditure shares since
measurement is standardized and do not rely on respondent reporting.
8
Tribes in Malawi typically follow matrilineal or patrilineal inheritance lines. Women in matrilineal ethnic groups are considered to have more power since they have access to land. Typically, land is passed down to women at the time of marriage from the parents. In patrilineal ethnic groups, women are much less autonomous and do not have access to land through inheritance. For matrilineal groups, male access to land occurs primarily through marriage and the man has no claim to land owned by his wife in the case of divorce. The opposite is true in patrilineal groups, women access land through their husbands’ endowment and have no claims when they divorce. These inheritance practices imply that men in matrilineal households and women in patrilineal households have lower assets at the time of marriage and less valuable divorce options since they hold no residual claim to land cultivated by the household (Kishindo 2010). Malawi has one of the highest divorce rates in Africa so the divorce threat is credible.
3. Methodology
3.1 DataI use nationally representative data from the Malawi Third Integrated Household Survey (IHS3) from 2010/2011. The survey data contain a rich set of household and community variables for approximately 12,300 households, including plot-level agricultural data from rainy and dry season yields. Only land cultivating households are included in the sample. Up to two household members could be listed as owners of a particular plot but the inheritance question did not indicate who among the owners was the inheritor. Consequently, I restrict my land inheritance variable to account for only households with at least one plot that was uniquely owned by a female household head or wife of the male household head. Since many inherited plots were jointly owned by both men and women, the results should be interpreted conservatively. My final overall sample for which all covariates were not missing included 6205 households.
9
Anthropometric data from the Household Questionnaire were converted into BMI-for-age and height-for-age z-scores according to 2007 World Health Organization definitions using the user-written STATA command zanthro. Only children with scores within five SDs of the mean were kept to exclude extreme outliers from the sample. Ethnic identity is inferred from the language spoken at home, which was asked of the household head only. While many Malawians are multilingual, a critical assumption of this analysis is that ethnic identity corresponds to the ethno-lingual identity elicited from this question and that there is no interethnic marriage. Since ethnic identity and home-village identity is important to Malawians, and internal migration rates are low, I believe that these assumptions are reasonable. Furthermore, if these assumptions were not to hold — say that matrilineal men are marrying patrilineal women, or matrilineal households are speaking patrilineal languages — the resulting 2SLS estimators would be downward biased.
3.2 Empirical Strategy
Female bargaining power and her control over inherited assets may be endogenous if parents bequeath land to daughters who exhibit higher returns to marriage, who are more productive, or have other unobservable characteristics that are correlated with bargaining power within the marriage. To control for these endogeneity concerns, I use a two-stage least squares (2SLS) instrumental variables strategy with a dummy for matriliny of the head’s ethnic groups as an instrument for the share of total household land inherited by the head female. Since one is not able to select into the ethnic group that they are born into and ethno-linguistic identity is salient in Malawian culture, matriliny is an exogenous predictor of assets controlled by women at the time of marriage. I control for household characteristics, interview month, and characteristics of the female and male heads to account for household expenditure decisions. The critical assumption of my identification strategy is that matriliny affects outcomes only through female bargaining power within these specific ethnic groups. To control for biases that are associated with outcomes and matriliny, I control for geographic region and per capita household expenditures as well. Thus, conditional on these characteristics, matrilineal ethnic identity and land inheritance can be thought of as being as good as randomly assigned.
Furthermore, this exclusion restriction should hold if factors that proxy female bargaining power are monotonically correlated with female inherited land share and matriliny is not correlated with other factors that affect outcomes.
10
…
(2)
(3)
Share of household land owned and inherited by head female or male
Dummy for matrilineal ethnic group of household head
expenditure outcome
Anthropometric z 0 score for BMI or height
4 Household index
6 Child index
In equation (1), I estimate the first stage value Li the share of household total land that was inherited
by the head female for household i on the instrument, a dummy M matrilineal ethnic identity, and a set of covariates. In equation (2), the outcome variables yi are household annual expenditure shares
on various goods and the log of household expenditures on male, female, and child clothing respectively. The regressors in the second stage are the instrumented variable Li and the covariates
from the first stage X’. For the final set of analyses, I estimate anthropometric outcomes for child j
in household i (3), with the first stage following the same form as in the previous analyses (1).
4. Results & Discussion
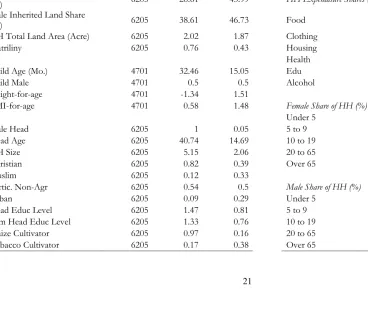
3.1 Summary of SampleTable 1 in the Appendix shows the summary statistics for the sample. the regional distribution of matrilineal ethnic groups in Malawi. The majority (76%) of households belong to matrilineal ethnic groups, with an overall average of 39.11% of household land owned and inherited by the male head and 27.06% by the female. The majority of households in the sample were very small farmers, with an average total land area of 2 acres and approximately 30% cultivating 1 acre or less. Only 12% of households live in urban areas, which is reflective of Malawi on the whole, in which the vast majority of households are rural.
11
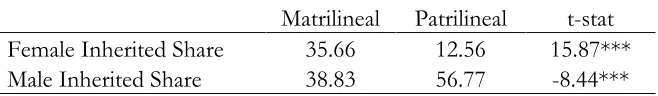
region, where only 10% of the sample is matrilineal. The colinearity of inheritance structure with region suggests that specifications that include regional fixed effects are more reliable. Table 3 shows that women in matrilineal household inherit significantly more land than their patrilineal counterparts; while men in patrilineal households inherit significantly more land than their matrilineal counterparts. Though overall, men inherit significantly more land than women.
These unconditional differences in land inheritance are strong evidence that the matriliny is strongly predictive of both female and male land inheritance. Many households reported that land was inherited and owned by both men and women, though only one person in the husband and wife relationship is able to inherit a single plot of land. Since these plots were excluded from the count of inherited plots but included in total household land area, this distribution represents a lower bound on inheritance.
3.2 Instrument Validity
Table 3 shows the correlations between matriliny and female and male inheritance, respectively. The estimates indicate that matriliny is correlated with both the female and male share of inherited land. A correlation of approximately 20% for female share suggests that 2SLS estimates should not suffer from bias due to matriliny being a weak instrument.
Table 4. Correlations Between Share of Inherited Land and Matriliny Female Share Male Share Matriliny Female Share 1
Male Share -0.517 1
Matriliny 0.198 -0.073 1
12
3.3 Balance Between Matrilineal and Patrilineal Households
One concern is that my instrument is not truly exogenous, and so other factors besides female inherited land that are correlated with child anthropometry and household decision making would bias the results of my analysis. Table 5 reports unconditional differences in means between matrilineal and patrilineal households for a number of household characteristics and behavior. In general, I find that there is considerable balance across matriliny with the exception of household size, total land area, participation in non-agricultural work, livestock ownership and receipt of transfers.
Concerns about differences in household size and participation in non-agricultural labor are addressed directly in my specifications as controls. Furthermore, when I conduct the analysis with household total land, livestock, and receipt of transfers in the regressions, the significance levels, point estimates, and F-stats on inherited land do not change (This is true for child anthropometry outcomes and for food consumption outcomes). It is important to note that households have the same levels of income, education, receipt of social assistance, and employment. Thus, Table 5 suggests that there is considerable balance between households across matrilineal ethnic group, and that the results of my analysis when controlling for these differences are attributable to the instrumented variation in inherited land share and not from outside factors.
3.4 Child Anthropometry
My sample was equally split between boys and girls. The average child in the sample is 1.34 SDs below the average height-for-age z-score and 0.58 SDs above the average BMI-for-age z-score. While the 2007 WHO definitions are based on Western distributions of these anthropmetric variables, the data suggest that children in Malawi exhibit low to moderate stunting. In fact, 31% of the children in the sample have height-for-age z-scores that are less than 2 SDs away from the average indicating moderate stunting, and more than 10% of the children exhibit extreme stunting (>3 SDs below average). BMI-for-age is widely considered a more contemporaneous measure of overall health of the child, whereas height-for-age is a long-term indicator of past child health. This finding is not surprising since Malawi’s subsistence farmers perennially experience months of hunger after the rainy season harvest has been totally consumed but before the dry season crop is ready for harvest.
13
increases BMI z-score by 0.041 SDs but a decrease in height-for-age by 0.026 SDs. These coefficients on female inherited land do not change greatly when I do not include regional fixed effects and per capita expenditures. A rich set of controls is included in all specifications including household structure to account for income pressure and interview month to control for seasonal changes correlated with income and nutrition that would affect z-scores. The sign, significance, and magnitude are also robust to specifications that include log per capita real annual expenditures.
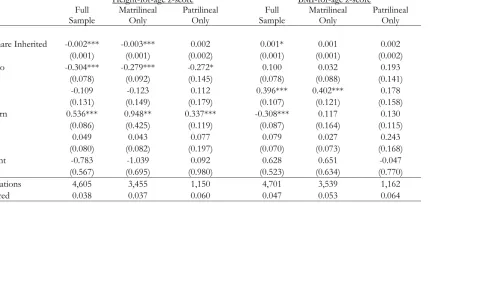
I run the analysis on the same outcomes using OLS (Table 7) and find that the effect of female inherited land is still negative for height and positive for BMI, though the point estimates are a tenth of the magnitude as the 2SLS estimates. The findings for height for age are robust to specifications that only include matrilineal households and patrilineal households, but the tenuous relationship goes away when I divide the sample for the BMI outcome.
These findings show that child health outcomes are correlated with land inheritance by women. Furthermore, this is caused by differences in male and female consumption preferences, mediated by the relative bargaining power endowment through land inheritance. It is interesting that as female bargaining power increases, contemporaneous health measures improve but long-term health declines. One plausible explanation is that more empowered women may allocate larger shares of household resources toward children, which is consistent with the literature, but these transfers are coming from incomes over which they have the most control over — namely carb-rich, nutrient-poor staples from their own production. Thus, these children may be benefit in the short-run from these food transfers, but not in the long-short-run, leaving them higher BMIs while they are nonetheless stunted.
14
Furthermore, men in households with more female assets may be induced into wage labor to increase the value of their own income sphere, given that they do not hold any residual claim to the household’s land. Thus, female land inheritance may lead to greater male control over disposable cash incomes necessary to purchase higher quality goods for the household or to serve as self-insurance for agricultural products that have higher initial investments or risk (e.g., livestock, cash crops, tree crops and more perishable food crops). This would suggest that men may be better positioned to purchase high value foods or to grow high valued crops not grown on female controlled plots. Given that previous studies have found decreased investments in household public goods and food when men control more income, we would expect to find that female inherited land share predicts higher incidence of male participation in wage labor, lower food consumption, and lowerconsumption of high-quality foods. I test this corollary wage labor hypothesis in the following sections.
3.5 Household Consumption
Second stage estimates for household expenditure shares on female land share are shown in Table 8. When controlling for a rich set of covariates, a one-percentage point increase in the share of household land that is female-inherited land leads to a 0.14 percentage point decrease in the share of annual food expenditures. When multiplied by the average share of land that is female-head inherited, I find that these households spend nearly 5 percentage points less on food relative to overall expenditures compared to their counterparts in which the head female inherited no land. Expenditures were annualized and include expenditures from own crop production — so we would expect households with more female inherited land to have lower food expenditures if they are consuming less expensive foods from own crop production. Table 8, shows that households consume more from own production as female inherited land increases: a ten-percentage point increase land share increases own crop expenditures by one percentage point. An increase in female-inherited land share also leads to an increase in household expenditures on clothing, but has no effect on other household expenditures.
15
with a greater share of female inherited land consume lower quality foods. A food basket high in carbohydrates but low in animal products would also be less expensive when accounting for expenditures, so higher food consumption would not necessarily lead to higher food expenditure share if these foods were low quality. Taken together, these results provide very suggestive, albeit circumstantial, evidence that households are consuming more, lower-quality foods, which would well-explain the findings of the analysis on child anthropometry.
To test whether households are allocating non-food resources toward children, I also estimate the effect on expenditure levels on clothing by gender, and I find that female inheritance is associated with higher expenditures on girls’ clothing and child clothing (Table 10). Interestingly, I find that households also spend significantly more on mens’ clothing. Martinez (2013) found a similar positive relationship with male goods and suggested that it may indicate a subsidy going to compensate for having less bargaining power in the household dynamic.
There is certainly unaccounted for selection for positive expenditures on these clothing goods but, for households with non-zero expenditures, these regressions indicate that more inherited land going to women is associated with higher expenditures on goods for children.
3.6 Income Control
To better understand the mechanisms through which female bargaining power may be working, I use logit estimation to see what affect female inherited land share has on participation in wage labor by gender. Table 11 reports those results, and I find that female asset inheritance predicts higher rates of participation for men but not for women. When broken down by matrilineal and patrilineal households, I find that the relationship holds for matrilineal households only. Again, this finding is consistent matrilineal men would have the least claim to assets owned outside of the marriage and would thus gave lower valued outside options. This would induce them to participate in wage labor more.
16
head. I expect that if land inheritance of all women were included in the analysis the relationship would be even larger.
Interestingly, female inheritance does not predict any difference in the share of incomes
jointly controlled by men and women, though the coefficient is positive. While there are concerns about an endogenous relationship between female inheritance and control over income, these results corroborate the divorce threat and separate spheres framework of my analysis. In the divorce threat model, only incomes that accrue to men and women in the case of divorce affect the household bargaining process. Thus, while cooperative and unitary household bargaining models might predict higher joint control shares as a result of more female asset control, the divorce threat model suggests further distinction of female and male income control. Thereby increasing the utility of the divorce option and inducing the Nash bargaining optimum.
5. Conclusion
My results provide strong evidence against the unitary household model, corroborating the findings of recent work within the intrahousehold bargaining literature. I find that greater female asset holdings through matrilineal inheritance are associated with higher BMI-for-age and lower height-for-age z-scores. Further, I find that inheritance leads to significant differences in expenditures on food and clothing, in consumption from own-crop production, in male participation in wage labor, and in the share of income controlled by men and women. This suggests that households with more female assets allocate more resources toward children as a result of higher female bargaining power. These findings are consistent with the divorce threat theoretical framework upon which I build my analysis and
17
As is the case with all analyses employing instrumental variables, my estimates should be be considered carefully and in context with previous intrahousehold bargaining literature, since it is impossible to prove that my single instrumental variable of matrilineal ethnic group satisfies the exclusion restriction. As is the case with all macro-variables used as instruments (weather, political change, etc.), culture may influence outcome variables outside of the channel that I am looking at. However, I am able to show that there is balance across matrilineal lineage and I control for important differences in my specifications, such that my results are at least suggestive of differences in decision-making based on bargaining power.
These findings suggest a number of policy implications. Firstly, policies that aim to solidify female land ownership such as land titling and inheritance laws may effect larger shares of female control over income and bargaining power within the household. Institution building that seeks to empower women, especially those women who belong to patrilineal ethnic groups, may be well intentioned but could result in unintended health consequences for children if not paired with complementary programs to improve the household food basket. Greater female control over assets may increase intrahousehold transfers toward children, but my findings suggest that these transfers are increases in quantity and not necessarily quality. Government subsidy programs such as the Farm Input Subsidy Program have induced intensified production of improved maize varieties, and increases in female land assets are likely to result in more female incomes through own maize production. This, and similar programs, may not adequately improve outcomes for children in the household, even when transfers go to women. In fact, land inheritance and farm investment programs may serve as disincentives for income and crop diversification since they are direct subsidies for increasing agricultural intensity. Thus, a woman may see that children would benefit from a different income generating strategy that would grant her access to more nutritious foods or long-term investments, but her bargaining power, future incomes, and future sources of government subsidies rest in her endowment of land.
18
19
References
Attanasio, O. & Lechene, V. (2002). Tests of Income Pooling in Household Decisions. Review of Economic Dynamics, 5 (4), 720–748.
Bobonis, G. (2009). "Is the Allocation of Resources within the Household Efficient? New Evidence from a Randomized Experiment". Journal of Political Economy, 117, 453-503.
Browning, M., & Chiappori, P.-A. (1998, November). Efficient Intrahousehold Allocations: A General Characterization and Empirical Tests. Econometrica , 1241-1278.
Case, A. & Deaton, A. (1998). Large Cash Transfers to the Elderly in South Africa. Economic Journal,
108 (450), 1330–1361.
Doepke, M., & Tertilt, M. (2011, June). Does Female Empowerment Pormote Economic Development? World Bank Policy Research Working Papers .
Duflo, E. (2003). Grandmothers and Granddaughters: Old-Age Pensions and Intrahousehold Allocation in South Africa. The World Bank Economic Review, 17 (1), 1-25.
Duflo, E. & Udry, C. (2004). Intrahousehold Resource Allocation in Cote d’Ivoire: Social Norms, Separate Accounts and Consumption Choices. NBER Working Paper, 10498.
Engle, P. (1993). “Influences of Mothers’ and Fathers’ Income on Children’s Nutritional Status in Guatemala.” Social Science Medicine, 37 (11), 1303–1312.
Hoddinott, J. & Haddad, L. (1995). Does Female Income Share Influence Household Expenditures? Evidence From Cˆote D’Ivoire. Oxford Bulletin of Economics and Statistics,57 (1), 77–96.
Kanbur, R., & Haddad, L. (1994). Are Better Off Households More Unequal or Less Unequal?
Oxford Econ. Papers, 46, 445-458.
Kennedy, E. & Peters, P. (1992). Household Food Security and Child Nutrition: The Interaction of Income and Gender of Household Head. World Development, 20 (8), 1077–1085.
Khandker, S. (2005). Microfinance and Poverty: Evidence Using Panel Data from Bangladesh. World Bank Economic Review, 19 (2), 263–286.
Kishindo, P. (2010). The Marital Immigrant. Land and Agriculture: A Malawian Case Study. African Sociological Review, 14 (2), 89-97.
Lundberg, S., & Pollak, R. (1994). Noncooperative Bargaining Models of Marriage. American Economic Review, 84 (2), 132-137.
20
Lundberg, S., Pollak, R., & Wales, T. (1997). Do Husbands and Wives Pool Their Resources? Evidence from the United Kingdom Child Benefit. Journal of Human Resources. 32 (3), 463–480. Manser, M., & Brown, M. (1980). Marriage and Household Decisionmaking: A Bargaining Analysis.
International Economics Review, 21, 31-44.
Martínez, C. (2013). Intrahousehold Allocation and Bargaining Power: Evidence from Chile.
Economic Development and Cultural Change, 61 (3), 577-605.
McElroy, M., & Horney, M. (1981). Nash-Bargained Household Decisions: Toward a Generalization of the Theory of Demand. International Economics Review, 22, 333-49.
Phipps, S. & Burton, P. (1998). What’s Mine is Yours? The Influence of Male and Female Incomes on Patterns of Household Expenditure. Economica, 65 (260), 599–613.
Quiñones, E. J., de la O-Campos, A. P., Rodríguez-Alas, C., Hertz, T., & Winters, P. (2009, December). Methodology for Creating the RIGA-L Database. Retrieved November 2013, from Food and Agriculture Organization of the United Nations: http://www.fao.org/fileadmin/templates/riga/docs/Country_survey_information/RIGA-L_Methodology.pdf
Rubalcava, L., Teruel, G. & Thomas, D. (2009). Investments, Time Preferences, and Public Transfers Paid to Women. Economic Development and Cultural Change, 57 (3), 507–538.
Rubalcava, L. & Thomas, D. (2000). Family Bargaining and Welfare. California Center for Population Research Working Paper Series, 2000-007.
Strauss, J., & Thomas, D. (1995). Human Resources: Empirical Model-ing of Household and Family Decisions. In J. Behrman, & T. N. Srinivasan (Eds.), Handbook of Development Eco-nomic . New York: North-Holland.
Telalagic, S. (2014). Kinship and Consumption: The Effect of Spouses Outside Options on Household Productivity. Institute for Fiscal Studies Working Paper, Oxford University.
Udry, C. (1996, October). Agricultural Production, and the Theory of the Household. Journal of Political Economy , 1010-1046.
Udry, C. R., Hoddinott, J., Alderman, H., & Haddad, L. (1995, October). Gender Differentials in Farm Productivity: Implications for Household Efficiency and Agricultural Policy. Food Policy
21
6. Appendix
Table 1. Summary Statistics
VARIABLE Obs Mean SD
VARIABLE Obs Mean SD
Fem Inherited Land Share
(%) 6205 28.61 43.99 HH Expenditure Shares (%)
Male Inherited Land Share
(%) 6205 38.61 46.73 Food 6205 64.1 13.81
HH Total Land Area (Acre) 6205 2.02 1.87 Clothing 6205 2.75 3.93
Matriliny 6205 0.76 0.43 Housing 6205 0.15 0.09
Health 6205 1.32 3.23
Child Age (Mo.) 4701 32.46 15.05 Edu 6205 1.19 3.01
Child Male 4701 0.5 0.5 Alcohol 6205 2.77 6.31
Height-for-age 4701 -1.34 1.51
BMI-for-age 4701 0.58 1.48 Female Share of HH (%)
Under 5 6205 8.92 12.66
Male Head 6205 1 0.05 5 to 9 6205 5.79 9.76
Head Age 6205 40.74 14.69 10 to 19 6205 10.6 13.99
HH Size 6205 5.15 2.06 20 to 65 6205 21.24 11.45
Christian 6205 0.82 0.39 Over 65 6205 1.28 6.61
Muslim 6205 0.12 0.33
Partic. Non-Agr 6205 0.54 0.5 Male Share of HH (%)
Urban 6205 0.09 0.29 Under 5 6205 8.91 12.65
Head Educ Level 6205 1.47 0.81 5 to 9 6205 5.69 9.65
Fem Head Educ Level 6205 1.33 0.76 10 to 19 6205 9.23 13.24
Maize Cultivator 6205 0.97 0.16 20 to 65 6205 22.65 11.95
22
Table 2. Regional Breakdown of Sample Region Obs Matrilineal Northern 939 10.33% Central 2370 90.89% Southern 2906 85.31%
23
Table 5. Unconditional Differences Between Matrilineal and Patrilineal Households Coefficient SE t-stat p-value
GENERAL CHARACTERISTICS
Urban 0.020 0.020 0.980 0.328 Income 1783.706 10458.710 0.170 0.865 HH size -0.285*** 0.096 -2.960 0.003 Total land area -0.210** 0.094 -2.240 0.025 Tobacco 0.004 0.029 0.130 0.894 Male parents education -0.079 0.067 -1.180 0.239 Average education of female's parents -0.020 0.025 -0.800 0.424 Female head education level 0.023 0.031 0.730 0.463 Head education level -0.150 0.050 -2.970 0.003 Poor (national poverty line) -7.327 2.811 -2.610 0.009
PARTICIPATION
Non-agriculture -0.048** 0.023 -2.130 0.033 Agriculture 0.007 0.005 1.440 0.151 Agricultural wage labor -0.034 0.021 -1.600 0.110 Livestock 0.044*** 0.010 -4.55 0.001 Social transfers -0.012 0.007 -1.710 0.088 Self employed -0.005 0.015 -0.340 0.734 Social assistance -0.013 0.010 -1.290 0.196 Pension -0.005 0.003 -1.420 0.157
HH COMPOSITION
24
Table 6. 2SLS Child Anthropometry Results
With interview month and regional controls, in addition to the full set of household controls
(1) (2) (3) (4) (5) (6) (7) (8)
Height-for-age z-score BMI-for-age z-score
Second Stage
Fem Share Inherited -0.021*** -0.021*** -0.026* -0.026* 0.022*** 0.021*** 0.043*** 0.041*** (0.004) (0.004) (0.015) (0.015) (0.004) (0.004) (0.015) (0.015)
Ln Annual Exp per cap 0.007 0.039 0.155*** 0.125
(0.058) (0.065) (0.052) (0.077)
Urban -0.177 -0.180 -0.116 -0.126 0.518*** 0.457*** 0.434** 0.397* (0.178) (0.181) (0.196) (0.202) (0.143) (0.140) (0.216) (0.209) Tobacco -0.589*** -0.592*** -0.572*** -0.587*** 0.467*** 0.406*** 0.610*** 0.562** (0.108) (0.109) (0.192) (0.192) (0.112) (0.113) (0.231) (0.223)
Northern - - -0.340 -0.367 - - 1.278** 1.196**
(0.566) (0.566) (0.583) (0.556)
Central - - -0.277 -0.297 - - 0.667*** 0.606**
(0.211) (0.212) (0.246) (0.236)
First Stage
Constant -0.355 -0.420 -0.217 -0.571 0.190 -1.242 -0.309 -1.438 (0.647) (0.837) (0.769) (1.000) (0.660) (0.849) (1.030) (1.277)
Matriliny 21.247*** 21.828*** 10.074*** 10.259*** 21.204*** 21.783*** 10.37*** 10.569*** (2.452) (2.503) (3.606) (3.617) (2.442) (2.486) (3.588) (3.597)
F-Stat 75.09 76.04 7.80 8.04 75.42 76.77 8.35 8.63
(1, 710) (1, 710) (1, 710) (1, 710) (1, 713) (1, 713) (1, 713) (1, 713)
25
Table 7. OLS Child Anthropometry Results
With interview month and regional controls, in addition to the full set of household controls
(1) (2) (3) (4) (5) (6)
Height-for-age z-score BMI-for-age z-score Full
Sample
Matrilineal Only
Patrilineal Only
Full Sample
Matrilineal Only
Patrilineal Only
Fem Share Inherited -0.002*** -0.003*** 0.002 0.001* 0.001 0.002 (0.001) (0.001) (0.002) (0.001) (0.001) (0.002)
Tobacco -0.304*** -0.279*** -0.272* 0.100 0.032 0.193
(0.078) (0.092) (0.145) (0.078) (0.088) (0.141)
Urban -0.109 -0.123 0.112 0.396*** 0.402*** 0.178
(0.131) (0.149) (0.179) (0.107) (0.121) (0.158)
Northern 0.536*** 0.948** 0.337*** -0.308*** 0.117 0.130
(0.086) (0.425) (0.119) (0.087) (0.164) (0.115)
Central 0.049 0.043 0.077 0.079 0.027 0.243
(0.080) (0.082) (0.197) (0.070) (0.073) (0.168)
Constant -0.783 -1.039 0.092 0.628 0.651 -0.047
(0.567) (0.695) (0.980) (0.523) (0.634) (0.770)
Observations 4,605 3,455 1,150 4,701 3,539 1,162
26
Table 7. 2SLS Household Expenditure Shares With full set of household controls.
(1) (2) (3) (4) (5) (6)
Food Clothing Housing Health Educ Alc/Tobacco
Second Stage
Fem Share Inherited -0.143** 0.041** 0.000 0.018 -0.007 -0.012 (0.065) (0.016) (0.000) (0.017) (0.010) (0.032) Tobacco -4.451*** 1.038*** 0.002 0.628** 0.018 -0.506 (1.082) (0.318) (0.007) (0.298) (0.166) (0.530) Urban -6.342*** 0.482* 0.015** -0.216 0.520*** -1.028** (0.952) (0.247) (0.006) (0.182) (0.187) (0.420) Northern 0.218 1.875*** -0.041*** 0.236 0.001 -0.846 (2.442) (0.596) (0.015) (0.640) (0.360) (1.157) Central -1.348 0.295 -0.021*** 0.668** -0.056 0.602 (1.127) (0.290) (0.007) (0.309) (0.147) (0.474) Constant 84.554*** 4.652*** 0.153*** -0.656 -4.742*** 0.779 (3.952) (1.123) (0.025) (1.141) (0.508) (1.613)
First Stage
Matriliny 10.996*** 10.996*** 10.996*** 10.996*** 10.996*** 10.996***
(2.82) (2.82) (2.82) (2.82) (2.82) (2.82)
F-Stat 15.20 15.20 15.20 15.20 15.20 15.20
df (1, 733) (1, 733) (1, 733) (1, 733) (1, 733) (1, 733)
27
Table 8. Log of Real Annual Total Expenditures on Food from Own-Crop Productions OLS Estimates with full set of controls.
(1) (2)
Matrilineal Only
Ln Own-Crop Food Cons.
Ln Own-Crop Food Cons.
Fem Share Inherited 0.001* 0.001**
(0.000) (0.000)
Tobacco 0.240*** 0.259***
(0.045) (0.049)
Urban -0.305*** -0.303***
(0.085) (0.103)
Northern 0.576*** 0.655***
(0.066) (0.103)
Central 0.494*** 0.460***
(0.051) (0.054)
Constant 8.902*** 9.100***
(0.312) (0.355)
Observations 5,451 4,239
R-squared 0.139 0.128
28
Table 9. Days Household Consumed Food by Type
OLS estimates with interview month and regional controls, in addition to the full set of household controls.
(1) (2) (3) (4) (5) (6) (7) (8)
Carbs
Animal
Products Fruits/Veg Cereal/Grain Roots/Tubers Meat Milk Fats
Fem Share Inherited 0.001* -0.004*** 0.001 0.000 0.001 -0.002*** -0.001** -0.001 (0.001) (0.001) (0.001) (0.000) (0.001) (0.001) (0.001) (0.001) Tobacco -0.168* 0.013 0.251* 0.115*** -0.283*** 0.127 -0.114 0.085 (0.097) (0.125) (0.146) (0.027) (0.092) (0.086) (0.071) (0.113) Urban 0.060 1.990*** 0.746*** -0.006 0.066 0.634*** 1.357*** 2.149*** (0.155) (0.222) (0.230) (0.051) (0.147) (0.121) (0.158) (0.151) Northern 0.207 -0.062 -0.910*** -0.267*** 0.474*** -0.316** 0.254** -0.317* (0.143) (0.193) (0.254) (0.075) (0.152) (0.126) (0.108) (0.190) Central -0.006 0.062 -0.186 -0.061** 0.055 -0.021 0.083 -0.474*** (0.116) (0.127) (0.144) (0.028) (0.118) (0.093) (0.065) (0.106) Constant 7.505*** 1.254* 6.803*** 6.760*** 0.745 2.322*** -1.068** 0.283 (0.635) (0.755) (0.819) (0.193) (0.623) (0.549) (0.454) (0.728)
Observations 6,215 6,215 6,215 6,215 6,215 6,215 6,215 6,215
R-squared 0.149 0.124 0.133 0.031 0.144 0.072 0.118 0.181
29
Table 10. 2SLS Indicator for Expenditures on Clothing (3-Month Recall) With interview month and regional controls, in addition to the full set of household controls
(1) (2) (3) (4) (5) (6)
Boys' Girls' Childs' Infants'
Adult Males'
Adult Females'
Second Stage
Fem Share
Inherited 0.002 0.004* 0.006** 0.002 0.004* 0.003 (0.002) (0.002) (0.002) (0.001) (0.002) (0.002) Tobacco 0.059** 0.082** 0.120*** 0.009 0.112*** 0.062* (0.028) (0.032) (0.037) (0.021) (0.031) (0.034) Urban 0.000 0.041 0.073** 0.065*** 0.108*** 0.107*** (0.037) (0.041) (0.035) (0.021) (0.033) (0.037) Northern 0.152** 0.158** 0.255*** 0.091* 0.197*** 0.210*** (0.066) (0.072) (0.089) (0.050) (0.068) (0.075) Central 0.039 0.046 0.071* 0.040* 0.041 0.007 (0.030) (0.032) (0.039) (0.022) (0.031) (0.036) Constant 0.373*** 0.153 0.535*** 0.255*** 0.122 0.405*** (0.124) (0.122) (0.143) (0.089) (0.123) (0.130)
First Stage
Matriliny 10.853*** 10.853*** 10.853*** 10.853*** 10.853*** 10.853*** (2.814) (2.814) (2.814) (2.814) (2.814) (2.814)
F-Stat 14.87 14.87 14.87 14.87 14.87 14.87
30
Table 11. Wage Labor Participation OLS estimates with full controls
(1) (2) (3) (4) (5) (6)
Matrilineal Only Patrilineal Only
Male Female Head Male Male Head Male Male Fem Share
Inherited 0.002* 0.002 0.003* 0.003* -0.002 -0.002 (0.001) (0.004) (0.002) (0.002) (0.005) (0.004) Tobacco -1.140*** -1.003*** -1.281*** -1.226*** -1.197*** -0.980** (0.184) (0.338) (0.207) (0.199) (0.352) (0.450) Urban 1.510*** 1.157*** 1.646*** 1.634*** 0.852*** 0.786*** (0.264) (0.412) (0.302) (0.291) (0.255) (0.249) Northern -0.080 -0.008 0.112 0.176 0.132 0.207 (0.154) (0.377) (0.309) (0.301) (0.297) (0.291)
Central 0.136 0.447* 0.060 0.131 0.133 0.251
31
Table 12. Effect of Inherited Assets on Income Control
OLS with full set of household controls.
(1) (2) (3) (4) (5) (6) (7) (8) (9)
Full Sample Matrilineal Only Patrilineal Only
Female Control Joint Control Male Control Female Control Joint Control Male Control Female Control Joint Control Male Control
Fem Share Inherited 0.266*** 0.003 -0.269*** 0.261*** 0.005 -0.265*** 0.319*** -0.056 -0.263*** (0.012) (0.011) (0.014) (0.012) (0.012) (0.015) (0.041) (0.036) (0.040) Maize -4.769** 7.601*** -2.832 -2.154 5.660 -3.506 -5.392*** 5.079* 0.313 (1.975) (2.126) (2.407) (3.420) (3.566) (4.264) (2.030) (2.999) (2.852) Tobacco -7.858*** 24.374*** -16.515*** -8.357*** 25.578*** -17.221*** -5.326*** 19.251*** -13.925*** (0.927) (1.713) (1.649) (1.040) (1.939) (1.903) (2.049) (3.057) (2.725) Urban -1.805 -10.529*** 12.334*** -1.783 -12.472*** 14.255*** -1.741 0.478 1.262 (1.393) (1.949) (2.342) (1.639) (1.940) (2.431) (2.199) (3.255) (3.158) Share Female 20-65 y.o. 0.251*** -0.107 -0.144 0.250*** -0.106 -0.144 0.235 -0.106 -0.129 (0.067) (0.083) (0.092) (0.076) (0.089) (0.100) (0.145) (0.189) (0.211) Share Male 20-65 y.o. -0.140** 0.027 0.113 -0.136** 0.017 0.119 -0.153 0.097 0.056 (0.058) (0.081) (0.087) (0.067) (0.090) (0.095) (0.116) (0.170) (0.200) Northern -0.093 4.684* -4.591** 0.918 -0.061 -0.856 -1.615 11.235*** -9.620*** (1.224) (2.610) (2.315) (4.168) (3.384) (4.140) (1.901) (3.287) (3.110) Central -3.500*** 9.529*** -6.029*** -3.475*** 8.097*** -4.623*** -4.745* 22.140*** -17.395*** (0.998) (1.209) (1.372) (1.078) (1.286) (1.455) (2.586) (3.387) (3.324) Constant 16.682** 0.433 82.885*** 12.098 2.736 85.166*** 24.904* 0.947 74.148*** (6.888) (8.863) (9.663) (8.236) (10.534) (11.209) (13.893) (16.834) (20.574)