153
Copyright © 2011-15. Vandana Publications. All Rights Reserved.
Volume-5, Issue-3, June-2015
International Journal of Engineering and Management Research
Page Number: 153-158
Fabrication and Charachteristics Studies on Lithium Ion Coin Cells
S.Harika1, Prof. N. Chitti Babu2 1
Department of Chemical Engineering, ANITS, Sangivalasa, INDIA 2
Department of Chemical Engineering, Andhra University, Visakhapatnam, INDIA
ABSTRACT
Technologists are continuing their efforts to develop portable electronic devices with better performance. Ever increasing demand in use of electronic gadgets like cellular phones, laptops, i-pods etc motivated the continuous effort towards development of better life cycle batteries. The battery unit is the main power source to drive underwater weapons. With the advent of lithium-ion battery technology, efforts are being concentrated to develop a suitable battery unit for these devices. Lithium ion batteries are the state-of-the-art power sources for portable electronic devices and, due to their superior energy and power densities, are promising candidates for the demanding energy storage applications. The development of Lithium ion batteries starts with the fabrication and electrical performance evaluation of the coin cells. The quality of the materials involved in the fabrication gets identified by the performance of coin cells and necessary measures will be taken to improve them. Subsequently, the same can be scaled up for higher capacity and higher energy for adapting to under water applications.
I.
INTRODUCTION
The present work consists of the fabrication of coin cells and their electrical characterization. The fabricated coin cells were used to study the discharge voltage under constant current mode using C/10, C/5, C/2 rates. Charging characteristics of coin cell were also studied at C/5 rate.
Keywords--- Li ion coin cells, C rate, Charging,
Discharging
The exponential growth in portable electronic devices such as cellular phones, laptop computers, etc., has motivated enormous interest in developing safe, compact, lightweight and high energy density batteries with better cycle life [1]. Also, growing environmental concerns around the globe are driving the development of advanced batteries for electric vehicles [2]. The
lithium ion batteries are more suitable to meet the above mentioned applications, since they provide high energy density compared to other available rechargeable batteries, such as lead acid, nickel-cadmium, nickel- metal hydride,etc.,
154
Copyright © 2011-15. Vandana Publications. All Rights Reserved.
lithium content than other class of intercalationcompounds.
Layered LiCoO2, LiNiO2 and LiMnO2, spinel LiMn2O4, inverse spinel LiNiVO4 and olivine LiFePO4 are the most studied cathode materials in the last two decades. Although, numerous classes of cathode materials were studied, only 40 to 65 % of the theoretical capacity of the cathode materials could be practically utilized owing to the chemical and structural instabilities due to the lithium intercalation during the charge and discharge process [8]. Present work has been attempted at coin cell level to understand the electrical performance. Subsequently, the same can be scaled up for higher capacity and higher energy for adapting to under water applications.
II.
METHODOLOGY
Methodology includes the procedure for fabrication of coin cell, Assembly of coin cell, and experimental set-up for carrying charging and discharging studies at various C- rates.
Procedure for fabrication of Lithium ion coin cell:
The development of lithium ion coin cell fabrication steps and establishment of proper electrode recipes for battery research are the primary objectives of this work.
Materials chosen for the development of coin cell in this work were commercially available graphite for anode (specific capacity: 330 mAh/g) and lithium cobalt oxide (Specific capacity: 145 mAh/g) for cathode, polyvinylidene fluoride(PVDF) for polymer binder to fabricate the electrodes, N-Methyl-2-Pyrrolidone(MNP,C5H9NO) for solvent of PVDF binders, stainless steel spacers for current collectors, poly ethylene for separator material, 1M LiPF6 and a mixture of 10 ml dimethyl carbonate (DMC), and 10 ml of ethyl diethyl carbonate (DEC) for electrolyte.
The coin cell casings (stainless steel) consisted of four components: top case (cathode side), bottom case (anode side), spacer (15.4 mm X 1.1 mm), and spring (15.8 mm X 0.5 mm). Fig. 2.1 Shows all the components required for coin cell
Active Material Preparation: Electrolyte Preparation:
Preparation of 1M LiPF6
1. 10ml of dimethyl carbonate (DEC) was taken. in (1:1) DEC : DMC solution the following steps were followed.
2. 10ml of dimethyl carbonate (DMC) was taken. 3. Solution was prepared by mixing DEC and DMC
in a conical flask.
4. 3.0356 g of LiPF6 was transferred into a volumetric flask and by stirring it for one minute, solution was prepared.
Negative electrode Preparation:
For the preparation of graphite anode slurry (80 wt% of graphite, 15 wt% acetylene black, 5 wt% of binder) the following steps were followed.
1. 80mg of graphite and 15mg of acetylene black were weighed and grained in mortar with pestle for 45minutes. This is called dry mix.
2. 5 mg of PVDF binder and 2-3 drops of NMP solvent were taken and mixed for 5minutes. This is called wet mix.
3. The disc and plate holder with acetone were cleaned and the disc was weighed.
4. The dry mix was added to wet mix and grained again very fast and vigoursly for 2 minutes. NMP was added when it was required.
5. The slurry was applied on the disc with the help of OHP sheet.
6. The coated disc was placed into hot air oven for overnight at 100 0
Fig. 2.2 Shows schematic of hot air oven. C.
7. After drying the dried disc was weighed.
Positive electrode Preparation:
For the preparation of lithium cobalt oxide cathode slurry ( 80 wt% of lithium cobalt oxide, 15 wt% acetylene black, 5 wt% of binder) the following steps were followed .
1. 80 mg of lithium cobalt oxide and 15mg of acetylene black were weighed and grained in mortar with pestle for 45minutes. This is called dry mix.
2. 5 mg of PVDF binder and 2-3 drops of NMP solvent were taken and mixed for 5minutes. This is called wet mix.
3. The disc and plate holder with acetone were cleaned and the disc was weighed.
4. The dry mix was added to wet mix and grained again very fast and vigoursly for 2 minutes. NMP was added when it was required.
5. The slurry was applied on the disc with the help of OHP sheet.
6. The coated disc was placed into hot air oven for overnight at 100 0
7. After drying the dried disc was weighed. C.
Assembly of coin cell:
1. Negative case was placed at the bottom. 2. Gasket was placed inside in the negative case. 3. Spring was placed above the negative case. 4. Spacer was placed above the spring.
155
Copyright © 2011-15. Vandana Publications. All Rights Reserved.
6. Again 2 drops of electrolyte was added andcounter electrode facing downwards was placed. 7. Finally positive case was placed on the counter
electrode and crimped with the help of crimping machine. Fig.2.3 shows the schematic of the crimping machine.
8. Assembled coin cell was handled with the help of plastic tweezers (to avoid short circuiting).. 9. Excess electrolyte was cleaned from the sides of
cell using a paper napkin.
Experimental setup for carrying out discharge studies
The apparatus and equipment employed to carry out the discharge studies of the coin cell in the present study essentially consisted of an electronic load bank. The photograph of the Electronic Load Bank was shown in Fig.2.4.
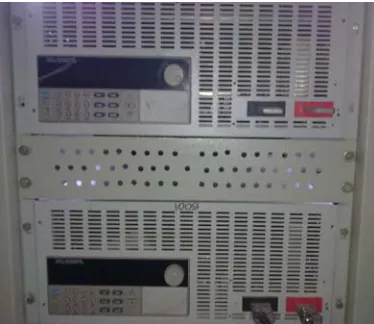
Experimental setup for carrying out charging studies
The apparatus employed to carry out the charging studies of the coin cell employed in the present study essentially consisted of the charging unit, the cell to be charged and a voltmeter to measure the voltage across the battery terminals. The charging unit is shown in Fig.2.5.
III.
RESULTS AND DISCUSSION
In the present experimental study, the discharge voltage characteristics of a Lithium ion coin cell have been studied under constant current mode of operation. The discharge voltage has been measured in the case of a single cell with different C-rates. The charging voltage for CR 2032 (which has an outer diameter of 20 mm and height of 3.2 mm) at constant current mode has also been obtained.
The measured data consist of discharge voltage at various C rates, charged voltage, and discharge voltage. The calculated data consisted of theoretical capacity of four coin cells made as part of experiment in laboratory. The experimental conditions and the range of variables for 5 mAh cell employed in the present investigation have been compiled and presented in Table 3.1.
Table. 3.1.Experimental conditions and output capacity in the present experiment
The discussion in the chapter is presented in five sections. The theoretical capacity calculations are presented in the section 3.1. The variation of battery voltage during stabilisation after fabrication of the cells is shown in section 3.2. The charging characteristics of a cell are shown in section 3.3. The discharge characteristics at various C rates are provided in section 3.4.
3.1. Theoretical capacity calculations of the cell.
Weight of electrode disc with current collector = WED Weight of unwanted current collector disc of the same diameter = WCC
Weight of electrode material, WEM is given by WEM = WED - WCC
Weight of active material in the electrode, WAM is given by
WAM = WEM * 0.8
Theoretical capacity of the electrode disc, CED is given by CED = WAM * C
Where C is theoretical specific capacity of active material.
( For anode C = 330 mAh/g and for cathode C = 145 mAh/g )
Theoretical capacity of the cell CT, is given by CT
The discharge voltage obtained by keeping current constant at 0.5mA were plotted against time and shown in Fig.3.3. OCV of the cell was 3.6V and as the load was applied, the voltage immediately falls to operating voltage of 3.35V and slowly falls to the cut off voltage of 3V over a period of 564 minutes. This yields an effective and realizable capacity of 4.7 mAh. This
= Theoretical capacity of anode + Theoretical capacity of cathode
3.2. Voltage stabilisation in the first one hour.
The variation in voltage during this stabilization process is plotted against time and is shown in fig.3.1. It is observed from the plot that the voltage raised rapidly and is stabilised beyond the time of 20 minutes.
3.3 Charging characteristics of a cell.
It is very important to know the charging characteristics of a cell. In the present experiment charging was done at a constant rate of 1mA. The battery is charged fully in about 5 hours time. Then the cell was disconnected from the charger, kept idle for 2 hours for stabilisation before subjecting it to discharge. The voltage reading during charging against time was plotted and shown in Fig.3.2 During charging, as observed from the plot of Fig.3.2, the voltage increased from 3.01 V to 3.6 V in a time period of 5 hours.
3.4 Discharge characteristics of coin cell at different C - Rates.
Discharge voltage characteristics are examined by obtaining discharge voltage data versus time for the constant current mode operation.
Discharge at C/10 Rate: Parameters
studied
Range of parameters
Output Capacity
Charging rate (Input capacity)
1 mA if it is 0.2 C rate
5 mAh
Discharging rate C/10, C/5, C/2.
C-rate
Current Duration Output Capacity C/10 0.5 mA 564 min 4.7 mAh
C/5 1 mA 270 min 4.5 mAh
156
Copyright © 2011-15. Vandana Publications. All Rights Reserved.
indicates the good health of the cell that is fabricated. It isgenerally not possible to realize the 100% of input capacity due to loss of capacity in the form of heat and other polarization effects [9]. In the present case more than 90% of input capacity is realized, which is high as expected.
Discharge at C/5 Rate:
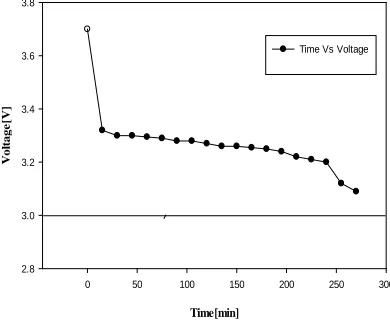
The discharge voltages obtained by keeping current constant at 1mA were plotted against time and shown in Fig.3.4 It can be seen from Fig. 3.4, the realised capacity is 4.5 mAh which is nearly 90%, as can be observed, when the cell is discharged at 1mA current. This is marginally less than the capacity realized when discharged at 0.5 mA. It is known that the capacity realised is less at higher current loads and more energy is lost as heat.
Discharge at C/2 Rate:
The discharge voltage obtained by keeping current constant at 2.5 mA were plotted against time and shown in Fig.3.5. As the current loads are higher and higher more and more energy is lost as heat and other polarization effects. The same can be evinced from Fig. 3.5. The realised capacity is relatively less as compared to discharge at C/10 and C/5 rate. The overall realised capacity is only 80% when discharged at C/2 rate.
Discharge characteristics at various C - Rates
The consolidated discharge voltage curves at different C-rates as shown in Fig.3.6. It is observed from the plots that the realised is less when the cell is discharged at C/2 rate than the cell was discharged at C /10 and C/5 rates (or) cell discharge rates are rapid when the applied load is high.
IV.
CONCLUSION
The present investigation was carried out to fabricate lithium ion coin cell and to study the discharge characteristics at various C – Rates. Based on the analysis of these data, the following conclusions were drawn:
1. A coin cell with graphite and lithium cobalt oxide of capacity 5 mAh is fabricated successfully. 2. Gain of voltage and / or capacity is very gradual
and is in line with the standard voltage - time history during charging.
3. The discharge profiles at different C – rates also were normal and as per typical profiles. As the discharge load currents increased the realized capacities decreased. This is attributed to loss of energy as heat and polarization effects.
4. The realised is less when the cell is discharged at C/2 rate than the cell was discharged at C /10 and C/5 rates.
V.
NOMENCLATURE
T Time [min]
WED Weight of electrode disc with current collector [g]
WCC Weight of unwanted current collector disc of the same diameter. [g]
WEM Weight of electrode material [g] WAM Weight of active material in the electrode
[g] CED Theoretical capacity of the electrode disc
[mAh] C Theoretical specific capacity of active material
[mAh/g] CT Theoretical capacity of the cell
[mAh]
REFERENCES
[1] B. Scrosati, Challenges of portable power sources, Nature, 373, (1995), 557 - 559.
[2] N. Takeda, S. Imai, Y. Horii, H. Yoshida, Development of high performance Lithium ion batteries for hybrid electric vehicles, Technical Review, 15, (2003), 68-72. [3] B. B. Owens, W. H. Smyrl, J. J. Xu, R &D on Lithium ion batteries in the USA, high energy electrode materials, J. Power Sources, 81, (1999), 150-155.
[4] M. Salomon, Lithium batteries: Present trends and prospects, 936, (1996), 666 – 678.S. Yoda, K. Ishihara, Development of Lithium batteries for energy storage and EV, J. Power Sources, 68, (1997), 3-7.
[5] Y. Nishi, Development of Lithium ion secondary batteries, Chem. Record, 1, (2001), 406-413.
[6] K.M.Abraham, Directions in secondary lithium battery research and development, Electrochimal Act, 38, (1 993), 1233-1248.
[7] R. T. Carlin, K. S. Lyons, Recent advances in lithium ion batteries, Journal of power sources, 6, (2002), 25-30. [8] D. Linden, Basic Concepts, Chapeter-2 in: D. Linden and T.B. Reddy, Handbook of batteries, 3/e, McGraw Hill, NY, USA (2002).
157
Copyright © 2011-15. Vandana Publications. All Rights Reserved.
Fig. 2.1 Components required for coin cell fabrication.
Fig.2.2Hot air oven
Fig. 2.3 Crimping machine.
Fig. 2.4 Photograph of electronic load bank
.
Fig. 2.5 Dual coin cell charger.
Time[min]
0 10 20 30 40 50 60 70
V
ol
tage
[V
]
0.30 0.35 0.40 0.45 0.50 0.55 0.60
Time Vs voltage
158
Copyright © 2011-15. Vandana Publications. All Rights Reserved.
Time [min]0 50 100 150 200 250 300 350
V
ol
tage
[
V
]
2.9 3.0 3.1 3.2 3.3 3.4 3.5 3.6 3.7
Time Vs Voltage
Fig.3.2 Rise in voltage with time during charge phase at current of 1 mA
Time[min]
0 100 200 300 400 500 600
V
ol
tage
[V
]
2.9 3.0 3.1 3.2 3.3 3.4 3.5 3.6 3.7
Time Vs Voltage
Fi Fig.3.3 Fall of voltage of coin cell with time when discharged at C/10 Rate (0.5 mA)
Time[min]
0 50 100 150 200 250 300
V
ol
tage
[V
]
2.8 3.0 3.2 3.4 3.6 3.8
Time Vs Voltage
Fig. 3.4 Fall of voltage of coin cell with time when discharged at C/5 rate ( 1 mA).
Fig 3.5 Fall of voltage of coin cell with time when dicharge at C/2 rate (2.5 mA) Time[min]
0 20 40 60 80 100 120
V
ol
tage
[V
]
2.9 3.0 3.1 3.2 3.3 3.4 3.5 3.6 3.7
Time Vs Voltage
Time[min]
0 200 400 600
V
ol
tage
[V
]
2.0 2.5 3.0 3.5 4.0
C\10 Rate C\5 Rate C\2 Rate