101
Copyright © 2018. IJEMR. All Rights Reserved.
Volume-8, Issue-4, August 2018
International Journal of Engineering and Management Research
Page Number: 101-113
DOI:
doi.org/10.31033/ijemr.8.4.13
Individual and Business Environment: How Effective Interaction Affects
SME Development
Supriyo Das1 andAmit Kundu2 1
Research Scholar, Department of Business Management, University of Calcutta, INDIA 2Professor & Dean, School of Management, Techno India Group, INDIA
1
Corresponding Author: [email protected]
ABSTRACT
Exploring and conceptualizing different aspect of entrepreneurship is top priority of policymakers at present days. Importance of entrepreneurial research is increasing day by day in the present complex and changing business environment. In this regard, it has become absolutely pertinent to re-examine the mechanism of interaction between environment and personality in entrepreneurial ecosystem to understand its impact on entrepreneurial development on MSME perspectives. Perfect interaction of personality characteristics with institutional variables can lead towards sustainable development. Significant personality characteristics or optimum business environment can’t alone make any difference. It is the magnitude of proper interaction between them which can increase the resultant vector in many folds. An attempt has been made in this paper to identify the significant interaction variables that can create impact during different entrepreneurial growth stage. The research is of a dynamic and multiregional structure and was conducted on the target sample based on the longitudinal study of GEDI (Global Entrepreneurship Development Institute report) report 2012-2016. The study confirms that interaction within ecosystem is complex as well as different in nature for different stage of business. The present study also explores the intricate situation and developed a suitable model for each stage of business development. The most notable part of this study is considering the heteroscedasticity and autocorrelation of the data. Panel Corrected Standard Error (PCSE) model has been used in our paper. The analysis of the present study indicates the positive and negative interaction variables for each stage of business development that can be used for policy making considering the present situation of the country.
Notation Used: In equation [1], [2], [3], i indicates individual Country, t indicates year, indicate Nascent
Entrepreneurship Rate, Established Business Ownership Rate and Sustainability. α and β are coefficients and € indicate error term. In equation [4] X represents the explanatory variables, whereas Ω is the covariance matrix for all error terms.
Keywords--- Small and Medium Enterprise,
Entrepreneurship, Business Environment, Stages of Business
I.
INTRODUCTION
102
Copyright © 2018. IJEMR. All Rights Reserved.
firms exit the market within the first five years of activity(Audretsch and Mahmood, 1995; Audretsch, Santarelli and Vivarelli, 1999a; Johnson, 2005). This unfortunate discontinuation rate indicates some loophole in entrepreneur ecosystem. There may be different reasons for failure. Inadequate entrepreneur attitude is one of them. As we indicate previously about the role of government, i.e., beside creating favorable environment for entrepreneurs it is also important to develop entrepreneurial attitude among small business owners through training or some social inclusion programmers. An entrepreneur would certainly be defined from non-entrepreneur in terms of some trait developed within him by some external influences but a successful entrepreneur need not have these entire traits together in all stages.
To develop suitable model that can enhance overall entrepreneurial development it is essential to have detail knowledge of how personality characteristics interact with institutional variables at different stage of Entrepreneurship development i.e. nascent entrepreneurship stage, new Business Ownership stage and for sustainable stage. Better understanding of all these interaction variables can help government for effective policy formulation that can boost economic performance of a country. An attempt has been made by the present researchers to explore all interaction variables i.e. Personality attributes along with proper institutional variables and reveals their influence at nascent entrepreneurship stage, New Business Ownership stage and for sustainability stage. It is identified that two major schools of entrepreneurial thought, (Kurtako DF, Nodgetts 2007) namely, the macro view and micro view, keeping in mind the success and failure issue, where the macro view identifies a number of environmental variables that may determine the success and failure of modern entrepreneurial ventures. Most of the factors are always beyond the control of the entrepreneurs. On the other hand, The Micro view identifies the factors that are controlled by entrepreneurs. This thought indicates that the potential entrepreneur has the ability to direct or adjust the outcome of each major influence.
Literature Review: Entrepreneurial Trait School of Thought is one of the major thoughts under this category. This approach focuses on researchers about successful entrepreneurs and recognized key traits and characteristic. The literature on entrepreneurship illustrate many issues of entrepreneurship, among this one of the vital issues is personality of entrepreneur. There are different personality dimensions that are quite likely to be present in successful entrepreneurs. The combination of many of these dimensions, with the right support ensure high growth and sustainable businesses. There is a plethora of empirical literature on the relevance of entrepreneurial personality in the framework of entrepreneurship research. These authors explain that understanding entrepreneurial personality is important in order to better understand entrepreneurship as
a whole. It is logical to differentiate between different phases during the entrepreneurship development (Shane/Venkataraman 2000; Davidsson2006). Most of the empirical evidence is based upon nascent entrepreneurs (e.g., Gartner et al. 2004), although they are not defined in the same way in all studies. Researchers found that age, experience and education can create the outline of the personality of the entrepreneurs. Davidson 2000 found a negative or curvilinear effect of age on the probability of becoming a nascent entrepreneur. Older people tend to be more risk-averse than younger people, a fact that offsets the influence of age and experience (Parker 2004: 70). Research Gap: Most of the researchers concentrated on the personality dimension, like according to Westhead et al. (2011) the possession of certain personality characteristics exposes an individual toward entrepreneurial behavior. Studies shows that personality traits are one of the most common psychological theories used to explain and predict the actions of humans, including in entrepreneurship (Ahmad 2010: 203). Major part of this research examined the characteristics that determine who is more likely to start a business.
Another part of the research consists of measuring the relationship between personality traits and firm performance. Empirical evidence supports that an entrepreneur’s personal characteristics have a direct effect on the business’ performance. (Zhang and Bruning 2011: 82-86). But connecting the personal traits of entrepreneurs to the success of a business venture can be very problematic because the methodological problems that arose when attempting to measure the personality characteristics of entrepreneur because the characteristics are not stable for different countries where degree of development is not same, Different measures usually ignored environmental and cultural influences. The role of learning, training and education is many times left out and issues such as sex, social class, race and age also ignored. (Burns 2005: 20-21). For a long time, researchers have studied what decisive factor makes entrepreneurs more successful. Still, a thorough theory of success is still missing. (Zhang and Bruning 2011: 94).
103
Copyright © 2018. IJEMR. All Rights Reserved.
parameters within the external environment and theirrelative importance. A group of scholars mainly concentrated on one or two major parameters and discussed briefly about their impact on overall business situation but the existing measures of entrepreneur orientation or environmental related models fail to describe stage base interaction model of entrepreneurship, empirically or conceptually. Interaction mapping, in general, is necessary to identifying the significant factors of personality along with optimum contact variables at different stage of entrepreneur development considering the stage of development of that particular country. Research Objective: In light of the broader impact of reforming the entrepreneurial ecosystem, and the necessity of a greater impact of the SME sector, it seems relevant to think about how redesigning the entrepreneur’s characteristics and institutional conditions can reform entrepreneurial ecosystem.
An attempt has been made in this paper to understand the role of specific identified traits for new business development in the both developing and developed nations. The paper also aims at looking into the existence of inter-linkage between personality traits of entrepreneurs, institutional variables and firm development stage. The research objectives may be recapitulated as the identification of important dimensions within entrepreneur ecosystem which is favorable for business startup, its continuation and sustainability and also find out other variables which create negative impact for business development at different stages of business.
In order to do so the subsequent sections are arranged in order to the following sections correspond to these objectives. In Section II we discuss the choice of dependent and independent variables followed by section III which talk about sources of data and the methodology. Section IV explores the data and conducts the analysis. Section V gives the major findings and policy recommendations. Section V concludes the paper.
II.
DETERMINANTS OF
ENTREPRENURIALINTERACTION
Dependent variables
Opportunity Perception: This opportunity perception potential is an essential ingredient of entrepreneurial start-ups. The individual variable within this pillar is Opportunity Recognition. It measures the percentage of the population that can identify good opportunities to start a business in the area where they live.’
Start-Up Skills: Launching a successful venture requires the potential entrepreneur to have the necessary start-up skills. Skill Perception measures the percentage of the population who believe they have adequate start-up skills. Non-Fear of Failure: Non-Fear of Failure or Risk Perception is defined as the percentage of the population who do not believe that fear of failure would prevent them
from starting a business. Business Risk reflects the availability and reliability of corporate financial information, legal protections for creditors, and institutional support of intercompany transactions.
Networking: Networking combines an entrepreneur’s personal knowledge with their ability to use the Internet for business purposes.
Cultural Support: This pillar is a combined measure of how a country’s inhabitants view entrepreneurs in term of status and career choice, and how the level of corruption in that country affects this view.
Opportunity Start-up: This is a measure of start-ups by people who are motivated by opportunity but face regulatory constraints. Opportunity entrepreneurs are believed to be better prepared, to have superior skills, and to earn more than what we call necessity entrepreneurs. The institutional variable applied here is Business Freedom.
Technology Absorption:The Technology Level variable is a measure of the businesses that are in technology sectors. The institutional variable Tech Absorption is a measure of a country’s capacity for firm-level technology absorption, as reported by the World Economic Forum.
Human Capital: The prevalence of high-quality human capital is vitally important for ventures that are highly innovative and require an educated, experienced, and healthy workforce to continue to grow. An important feature of a venture with high growth potential is the entrepreneur’s level of education.
Competition: Competition is a measure of a business’s product or market uniqueness, combined with the market power of existing businesses and business groups. The variable Competitors is defined as the percentage of Total Entrepreneurship Activity of businesses that have only a few competitors offering the same product or service. Product Innovation: New Product is a measure of a country’s potential to generate new products and to adopt or imitate existing products. In order to quantify the potential for new product innovation, an institutional variable related to technology and innovation transfer seems to be relevant.
Process Innovation: Applying and/or creating new technology is another important feature of businesses with high growth potential. New Tech is defined as the percentage of businesses whose principal underlying technology is less than five years old. An appropriate institutional variable applied here is research and development (R&D). Gross Domestic Expenditure on Research and Development (GERD) is the R&D percentage of GDP as reported by OECD.
104
Copyright © 2018. IJEMR. All Rights Reserved.
Growth combines high growth potential with asophisticated strategy.
Internationalization: A widely applied proxy for internationalization is exporting. Exporting demands capabilities beyond those needed by businesses that produce only for domestic markets. A country’s openness to international entrepreneurs—that is, the potential for internationalization—can be estimated by its degree of globalization. The internationalization pillar is designed to
capture the degree to which a country’s entrepreneurs are internationalized, as measured by the exporting potential of businesses, controlling for the extent to which the country is economically globalized.
Risk Capital:The availability of risk finance, particularly equity rather than debt, is an essential precondition for fulfilling entrepreneurial aspirations that are beyond an individual entrepreneur’s personal financial resource.
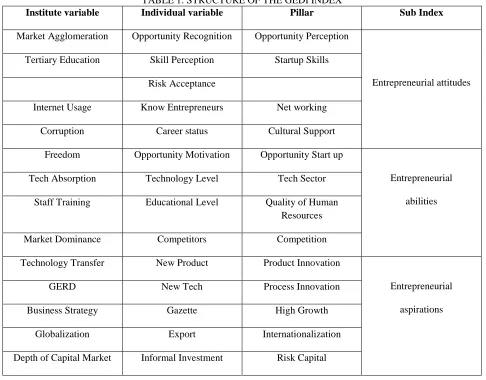
TABLE 1:STRUCTURE OF THE GEDI INDEX
Institute variable Individual variable Pillar Sub Index
Market Agglomeration Opportunity Recognition Opportunity Perception
Entrepreneurial attitudes Tertiary Education Skill Perception Startup Skills
Risk Acceptance
Internet Usage Know Entrepreneurs Net working
Corruption Career status Cultural Support
Freedom Opportunity Motivation Opportunity Start up
Entrepreneurial
abilities Tech Absorption Technology Level Tech Sector
Staff Training Educational Level Quality of Human Resources
Market Dominance Competitors Competition
Technology Transfer New Product Product Innovation
Entrepreneurial
aspirations GERD New Tech Process Innovation
Business Strategy Gazette High Growth
Globalization Export Internationalization
105
Copyright © 2018. IJEMR. All Rights Reserved.
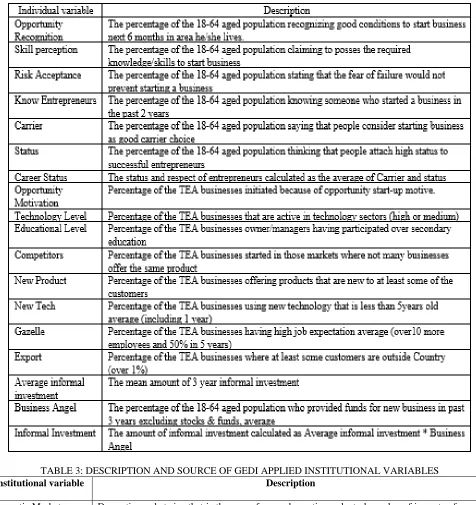
TABLE 2:DESCRIPTION OF THE INDIVIDUAL VARIABLES USED TO CREATE THE GEDI INDEX
TABLE 3:DESCRIPTION AND SOURCE OF GEDI APPLIED INSTITUTIONAL VARIABLES
Institutional variable Description
Domestic Market Domestic market size that is the sum of gross domestic product plus value of imports of goods and services, minus value of exports of goods and services.
Urbanization Urbanization that is the percentage of the population living in urban areas.
Market Agglomeration The size of the market: a combined measure of the domestic market size and the urbanization that later measures the potential agglomeration effect.
106
Copyright © 2018. IJEMR. All Rights Reserved.
Business Risk The business climate rate ―assesses the overall business environment quality in a country. It reflects whether corporate financial information is available and reliable, whether the legal system provides fair and efficient creditor protection, and whether a country’s institutional framework is favorable to intercompany transactions
Internet Usage The number of Internet users in a particular country per 100 inhabitants, 2013 data
Corruption The Corruption Perceptions Index (CPI) measures the perceived level of public-sector corruption in a country. ―The CPI is a ‘survey of surveys’, based on 13 different expert and business.
Economic Freedom ―Business freedom is a quantitative measure of the ability to start, operate, and close a business that represents the overall burden of regulation, as well as the efficiency of government in the regulatory process.
Independent variables
Nascent Entrepreneurship Rate: is defined as the percentage of 18-64 population who are currently a nascent entrepreneur, i.e., actively involved in setting up a business they will own or co-own; this business has not paid salaries, wages, or any other payments to the owners for more than three months.
Established Business Ownership Rate: Percentage of 18-64 population who are currently an owner-manager of an established business, i.e., owning and managing a running business that has paid salaries, wages, or any other payments to the owners for more than 42 months.
Sustainability: is estimated by the ratio of percentage increase in new entrepreneurial venture and percentage discontinuation of existing one
III.
SOURCES OF DATA AND
METHODOLOGY
Methods of Collection of Data: The research is of a dynamic and multiregional structure and was conducted on the target sample based on the longitudinal study of GEDI report 2012-2016 (Global Entrepreneurship Development Institute report).
The Global Entrepreneurship and Development Index (GEDI) project came to alive to provide a suitable measure of entrepreneurship based on the multidimensional definition of entrepreneurship and to present a useful platform for policy analysis and outreach. The distinguished features of GEDI are (1) the contextualization of individual-level data by a country's institutional conditions; (2) the use of 14 context-weighted measures of entrepreneurial attitudes, abilities and aspirations; (3) the recognition that different pillars combine to produce system-level performance; and (4) the consequent recognition that national entrepreneurial performance may be held back by bottleneck factors - i.e. poorly performing pillars that may constrain system
performance (Acs et al., 2013a).This research also uses the data of GEM (Global Entrepreneurship Monitor) report, 2012-2016, which was conducted on the target sample based on the longitudinal study. The GEM research project was designed as a long-term multinational endeavor with the purpose of providing a database to study the complex relationship between entrepreneurship and economic growth (Reynolds, Hay, and Camp, 1999) and facilitating evidence-based policies that enhance entrepreneurship (Reynolds et al., 2005)
Methodology: This study attempts to empirically investigate the determinant of nascent entrepreneurship rate at stage 1, determinant of new business ownership rate at stage 2 and also determinant of sustainability at stage 3 from entrepreneur’s personality point of view. For this the methodology adopted in this paper is Panel Regression Analysis.
107
Copyright © 2018. IJEMR. All Rights Reserved.
Baltagi,2010). Hausman (1978) provides a test fordiscriminating between the estimators of fixed and random effects. The two estimators of the coefficient vectors of FEM and REM are compared in the test.
We used ordinary least square (OLS), Fixed effect model (FEM) and random effect model (REM) to estimate the effective interaction variable i.e. interaction of personality with appropriate institutional variable of an entrepreneur. Hausman specification test and Breusch-Pagan Lagrange Multiplier test are also used (see Breusch and Pagan, 1979, Gujarati,2003, Hsiao, 2003 etc.). The two estimators of the coefficient vectors of FEM and REM are compared in Hausman test. The estimator of random effects is efficient and consistent under the null hypothesis and inconsistent under the alternative hypothesis. Then testing for homoscedasticity is performed by using modified Wald test for the null hypothesis of homoscedasticity against the heteroscedastic alternative. Panel Corrected Standard Error (PCSE) model has been used in our paper. In PCSE model the problem of heteroscedasticity, autocorrelation and correlation across panels will be eliminated, whereas fixed and random effects models allow for including the individual effects. Econometric Modeling:To explore the true picture of the effective interaction of personality and institutional variable with respect to nascent entrepreneurship rate, new business rata and sustainability ratio the fixed effects model and the random effects model which are the most common panel data model is used. If the country effects are correlated with the independent variables, then they are known as fixed effects. The fixed effects model is:
[1]
Here i indicate the country, t stands for the year, is the error term for the fixed effects model and indicate
nascent entrepreneurship rate at stage 2/new business ownership rate at stage 2 / sustainability at stage 3.
If the country effects are uncorrelated with the independent variables, they are known as random effects. In the random effects model, there is no correlation between the country specific effects and the independent variables. The random effects model is:
[2]
If there is no country specific effect in the model, then the model becomes as the pooled ordinary least squares regression which is:
[3]
Both fixed and random effects models include strong assumptions regarding the error terms. For this before making any conclusions, the validity of error term’s features has to be checked. So, heteroscedasticity and autocorrelation must be checked. If the error terms are auto correlated or heteroscedastic, fixed and random effects estimators is no longer effective. For such cases Beck and Katz [1995] suggested estimating the parameters of the model by Prais-Winsten method and then adjusting the standard errors for the panel data. Panel Corrected Standard Errors (PCSE) are calculated with the use of following formula:
[4]
Var{β^PCSE} =(X`X)-1X`ΩX(X`X)-1
Matrix X represents the explanatory variables, whereas Ω is the covariance matrix for all error terms. In PCSE model the problem of heteroscedasticity, autocorrelation and correlation across panels will be eliminated.
Model Development:
Model I –Stage I- Nascent-Interaction Model: At first was examined whether the intercept take a common value of i.e. test for heterogeneity. For this we go for F test first.
F (14, 284) = 8.00 and Prob> F = 0.0000
p-108
Copyright © 2018. IJEMR. All Rights Reserved.
value is less than 0.05 that indicate heteroskedasticity inthe data. In this study F (1, 297) = 4.70Prob> F = 0.0309 So, the pooled ordinary least squares model is not suitable here and recommend for random effect.
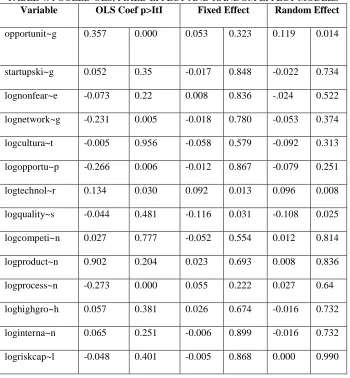
TABLE 4: POOLED OLS, FIXED EFFECT AND RANDOM EFFECT MODELS
Variable OLS Coef p>ItI Fixed Effect Random Effect
opportunit~g 0.357 0.000 0.053 0.323 0.119 0.014
startupski~g 0.052 0.35 -0.017 0.848 -0.022 0.734
lognonfear~e -0.073 0.22 0.008 0.836 -.024 0.522
lognetwork~g -0.231 0.005 -0.018 0.780 -0.053 0.374
logcultura~t -0.005 0.956 -0.058 0.579 -0.092 0.313
logopportu~p -0.266 0.006 -0.012 0.867 -0.079 0.251
logtechnol~r 0.134 0.030 0.092 0.013 0.096 0.008
logquality~s -0.044 0.481 -0.116 0.031 -0.108 0.025
logcompeti~n 0.027 0.777 -0.052 0.554 0.012 0.814
logproduct~n 0.902 0.204 0.023 0.693 0.008 0.836
logprocess~n -0.273 0.000 0.055 0.222 0.027 0.64
loghighgro~h 0.057 0.381 0.026 0.674 -0.016 0.732
loginterna~n 0.065 0.251 -0.006 0.899 -0.016 0.732
logriskcap~l -0.048 0.401 -0.005 0.868 0.000 0.990
Fixed effects model is rejected in the analysis based on Hausman specification test (1978), the higher value of Hausman Test i.e. Prob>chi2 = 0.3838 rejects the validity of Fixed effect model. The empirical results (Table 5.3) obtained from Random Effect model shows that regression model with dependent variable Nascent Entrepreneurship rate fits well with independent determinant variables as value of rho in case of Random Effect is 0.86., i.e. 87 percentage of the variation is explained by individual specific effect. Butthe goodness of fit of both mod-els as assessed by R
2
is low. After performing Modified Wald test for group wise heteroskedasticity It was found that error variance matrix reveals heteroscedasticity and correlation across panels (Prob>chi2 = 0.0000). Therefore, PraisWinsten estimation
with panel corrected standard errors was carried out. The results are shown in Table 5.
TABLE 5: RESULT-1
Prais-Winsten model with PCSE and common AR (1) for all panels
Variable Coeff. Prob.
opportunit~g 0.267492 0
startupski~g -0.01422 0.823
lognonfear~e -0.07541 0.129
lognetwork~g -0.16359 0.044
109
Copyright © 2018. IJEMR. All Rights Reserved.
logopportu~p -0.20626 0.019logtechnol~r 0.102399 0.113
logquality~s -0.0652 0.418
logcompeti~n 0.067036 0.456
logproduct~n 0.036598 0.606
logprocess~n -0.1508 0.004
loghighgro~h 0.042144 0.578
loginterna~n 0.027206 0.631
logriskcap~l -0.00226 0.965
Total 0.267492 0
R 2
0.4529 -
rho .5503242 -
In terms of goodness of fit, the PCSE model seems to be the best. In general, opportunity perception, networking, opportunity start up and process innovation are found significant.
The study confirms that statistically significant positive associations have been found between opportunity perception and nascent entrepreneurship rate. Rest of the variables holds negative association.
Model II –Stage II-Established Business Ownership Rate -interaction Model: In the Established Business Ownership Rate model, the pooled OLS, Fixed Effect, Random effect analysis has been performed directly considering Established Business Ownership Rate as dependent variable with respect to fourteen personality parameters.
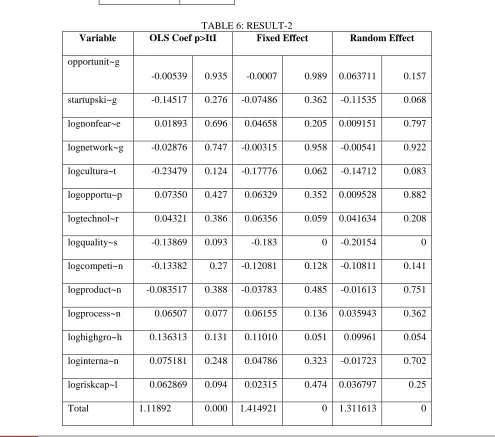
TABLE 6:RESULT-2
Variable OLS Coef p>ItI Fixed Effect Random Effect
opportunit~g
-0.00539 0.935 -0.0007 0.989 0.063711 0.157
startupski~g -0.14517 0.276 -0.07486 0.362 -0.11535 0.068
lognonfear~e 0.01893 0.696 0.04658 0.205 0.009151 0.797
lognetwork~g -0.02876 0.747 -0.00315 0.958 -0.00541 0.922
logcultura~t -0.23479 0.124 -0.17776 0.062 -0.14712 0.083
logopportu~p 0.07350 0.427 0.06329 0.352 0.009528 0.882
logtechnol~r 0.04321 0.386 0.06356 0.059 0.041634 0.208
logquality~s -0.13869 0.093 -0.183 0 -0.20154 0
logcompeti~n -0.13382 0.27 -0.12081 0.128 -0.10811 0.141
logproduct~n -0.083517 0.388 -0.03783 0.485 -0.01613 0.751
logprocess~n 0.06507 0.077 0.06155 0.136 0.035943 0.362
loghighgro~h 0.136313 0.131 0.11010 0.051 0.09961 0.054
loginterna~n 0.075181 0.248 0.04786 0.323 -0.01723 0.702
logriskcap~l 0.062869 0.094 0.02315 0.474 0.036797 0.25
110
Copyright © 2018. IJEMR. All Rights Reserved.
F test imply that there is a country specific effectsin the model specification. So, the pooled ordinary least squares model is inconsistent. Howeverhausman suggest fixed effect model.
The most important assumptions of the fixed effects estimator are homoscedasticity, no serial correlation and no contemporaneous correlation. Testing for homoscedasticity is performed by using modified Wald test for the null hypothesis of homoscedasticity against the heteroscedastic alternative. (Prob>chi2 = 0.0052)
The Wald test (also called the Wald Chi-Squared Test) is a way to find out if explanatory variables in a model are significant. The goodness of fit of both models as assessed by R
2
is also low (0.13). To address the issue, PraisWinsten estimation with panel corrected standard errors (PCSE) was carried out. The results are shown in Table 7.
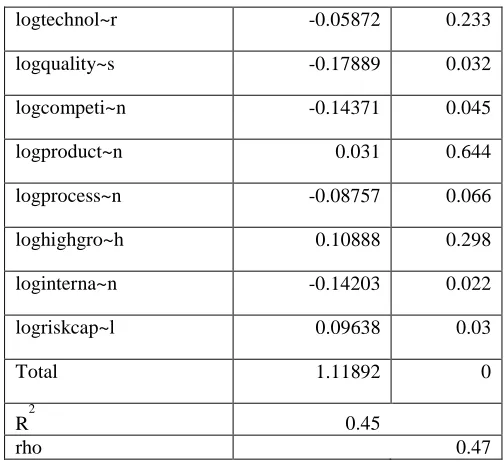
TABLE 7:RESULT-3
rais-Winsten model with PCSE and common AR (1) for all panels
Variable Coeff. Prob.
opportunit~g 0.19538 0
startupski~g -0.11743 0.073
lognonfear~e -0.1193 0.035
lognetwork~g -0.0381 0.585
logcultura~t 0.09403 0.363
logopportu~p -0.05177 0.581
logtechnol~r -0.05872 0.233
logquality~s -0.17889 0.032
logcompeti~n -0.14371 0.045
logproduct~n 0.031 0.644
logprocess~n -0.08757 0.066
loghighgro~h 0.10888 0.298
loginterna~n -0.14203 0.022
logriskcap~l 0.09638 0.03
Total 1.11892 0
R 2
0.45
rho 0.47
Here in PSCE model goodness of fit, seems to be the best. (R2 0.45). It is found that, opportunity perception, non-fear of failure, quality of human-resources, competition and risk capital and international are found important influencing traits of en entrepreneurs. Among these opportunity perception and risk capital hold positive relationship with new business development.
Model III –Stage III-Sustainability -Interaction Model: In case of sustainability personality model at first simple OLS, Fixed effect test have been carried out.
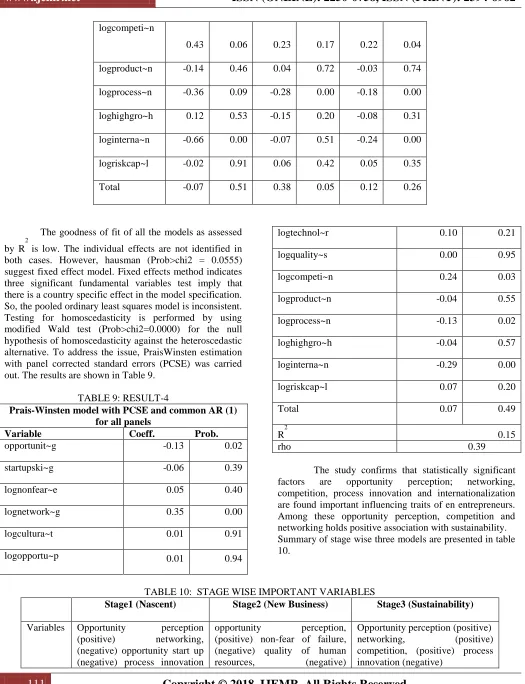
TABLE 8:ESTIMATED RESULTS OF TWO TYPE OF PANEL MODELS
Variable OLS Coef p>ItI Fixed Effect Random Effect
opportunit~g
-0.21 0.18 -0.03 0.74 -0.10 0.13
startupski~g 0.04 0.77 -0.24 0.16 -0.08 0.27
lognonfear~e 0.01 0.96 0.11 0.17 0.08 0.22
lognetwork~g 0.74 0.00 0.47 0.00 0.39 0.00
logcultura~t 0.02 0.95 0.39 0.06 0.06 0.63
logopportu~p 0.22 0.39 -0.13 0.37 -0.06 0.58
logtechnol~r -0.13 0.56 0.19 0.01 0.16 0.01
111
Copyright © 2018. IJEMR. All Rights Reserved.
logcompeti~n0.43 0.06 0.23 0.17 0.22 0.04
logproduct~n -0.14 0.46 0.04 0.72 -0.03 0.74
logprocess~n -0.36 0.09 -0.28 0.00 -0.18 0.00
loghighgro~h 0.12 0.53 -0.15 0.20 -0.08 0.31
loginterna~n -0.66 0.00 -0.07 0.51 -0.24 0.00
logriskcap~l -0.02 0.91 0.06 0.42 0.05 0.35
Total -0.07 0.51 0.38 0.05 0.12 0.26
The goodness of fit of all the models as assessed by R
2
is low. The individual effects are not identified in both cases. However, hausman (Prob>chi2 = 0.0555) suggest fixed effect model. Fixed effects method indicates three significant fundamental variables test imply that there is a country specific effect in the model specification. So, the pooled ordinary least squares model is inconsistent. Testing for homoscedasticity is performed by using modified Wald test (Prob>chi2=0.0000) for the null hypothesis of homoscedasticity against the heteroscedastic alternative. To address the issue, PraisWinsten estimation with panel corrected standard errors (PCSE) was carried out. The results are shown in Table 9.
TABLE 9:RESULT-4
Prais-Winsten model with PCSE and common AR (1) for all panels
Variable Coeff. Prob.
opportunit~g -0.13 0.02
startupski~g -0.06 0.39
lognonfear~e 0.05 0.40
lognetwork~g 0.35 0.00
logcultura~t 0.01 0.91
logopportu~p 0.01 0.94
logtechnol~r 0.10 0.21
logquality~s 0.00 0.95
logcompeti~n 0.24 0.03
logproduct~n -0.04 0.55
logprocess~n -0.13 0.02
loghighgro~h -0.04 0.57
loginterna~n -0.29 0.00
logriskcap~l 0.07 0.20
Total 0.07 0.49
R2 0.15
rho 0.39
The study confirms that statistically significant factors are opportunity perception; networking, competition, process innovation and internationalization are found important influencing traits of en entrepreneurs. Among these opportunity perception, competition and networking holds positive association with sustainability. Summary of stage wise three models are presented in table 10.
TABLE 10: STAGE WISE IMPORTANT VARIABLES
Stage1 (Nascent) Stage2 (New Business) Stage3 (Sustainability)
Variables Opportunity perception (positive) networking, (negative) opportunity start up (negative) process innovation
opportunity perception, (positive) non-fear of failure, (negative) quality of human resources, (negative)
112
Copyright © 2018. IJEMR. All Rights Reserved.
(negative) competition, (negative) riskcapital (positive) international (negative)
internationalization (negative)
IV.
IMPLICATION AND CONCLUTION
The outcome of this research paper has several implications for researchers and policymakers. First of all, the findings of this study support the importance of the role of effective interaction of personal and institutional variables in entrepreneurial ecosystems. These findings also suggest an integrated approach which can minimize the negative influence and maximize the positive ones to develop the competent entrepreneurial situation in terms of nascent entrepreneurship rate, new business development rate and sustainability.
In nascent stage, future entrepreneurs are actively involved in setting up a business and they are highly motivated by the opportunity perception i.e. they are looking for new opportunities to start a business. In business development stage, entrepreneurs manage its ongoing business. Opportunity perception again could be the important one for scale up its existing one or invest in the new business having potential in future. It indicates that the size of the market/potentiality of the market can motivate a person to startup but this market potentiality can be utilized by the organization with their potential human resources to beat the competition. Risk capital also play significant role here because the availability of risk finance, particularly equity rather than debt, is an essential precondition for fulfilling entrepreneurial aspirations that are beyond an individual entrepreneur’s personal financial resources.
Market opportunity remains the dominating factors even in the stage of sustainability and the outcome is quite justified as the success of the business venture depends mostly on the business growth in the existing market as also creation of the new potential area of business. Networking emerge as one of the positive influential factors at this stage because it enhances the spectrum of understanding of the entrepreneurs regarding business environment, new technology, process invention, latent market demand and also new challenges of the business. Market competition is also becoming an influencing factor for the improvement of the business as the entrepreneurs look for process and product innovation as well as finding new markets with their existing products for their sustenance. As a result, they go for product or market uniqueness that can save them from profit sharing. On the other hand, negative attributes are those which are hindering the total entrepreneurial development. Process innovation which is reflected by using new technology and making expenditure towards R&D also hold negative relation with nascent entrepreneurship rate and sustainability. That can be explicated by crunch of financial resources and improper training which may lead
further fund shortage. In business development stage when entrepreneur began to take things more seriously and increases his investment then always undergo with fear for competition and failure. It has also been noticed that increased quality of human resource holds back an entrepreneur to start a new business. That reflect cultural bottleneck of society where entrepreneurship is seen as a secondary choice. When countries entrepreneurs are more internationalized then new entrepreneur registration rate decrease because of incompetency fear and also at later stage mainly big companies take the full advantage of export-oriented profit. Also exporting more without inventory management and creating global image without proper technology up gradation seems to lead a firm towards unstable condition. It is now matter of question that how Gross Domestic Expenditure on Research and Development (GERD) help small entrepreneurs. For this Process Innovation also consider as negative influential factor at sustainable stage. To overcome financial crisis and technical incompetency government can play pivotal role and it is the time to redesign the entrepreneur ecosystem which is mainly control by government.
V.
FUTURE SCOPE
Extension of this study can be used to ascertain the extent of differences in the context of the relationships between the interaction variables and entrepreneurial development across different segmentations, segmentation being made on the basis of the magnitude of the interaction traits such as low and high and also on the basis of developed and developing nations.
REFERENCES
[1] Acs, Z. J., Szerb, L., & Autio, E. (2013). The Global
Entrepreneurship and Development Index 2013.
Cheltenham: Edward Elgar Publishers. Available at: https://www.elgaronline.com/view/9781849808446.xml [2] Ahmad, H. (2010). Personality traits among entrepreneurial and professional CEOs in SMEs.
International Journal of Business and Management, 5(9),
203-213.
[3] Audretsch, D.B. & Mahmood, T. (1995). New firm survival: New results using a hazard function. Review of
Economics and Statistics, 77(1), 97-103.
[4] Audretsch, D.B., Santarelli, E., & Vivarelli, M. (1999). Startup size and industrial dynamics: Some evidence from Italian manufacturing. International Journal of Industrial
113
Copyright © 2018. IJEMR. All Rights Reserved.
[5] B.H. Baltagi. (2010). Econometric analysis of paneldata. (4th Edition). Chichester, U.K: John Wiley & Sons Ltd.
[6] Burns, P. (2005). Corporate entrepreneurship:
Building an entrepreneurial organisation. New York:
Macmillan.
[7] Carree, M., Stel, A., Thurik, R. & Wennekers, S. (2002). Economic development and business ownership: An analysis using data of 23 OECD countries in the period 1976–1996. Small Business
Economics, 19(3), 271-290.
[8] Carter, N., W.B. Gartner, & P.D. Reynolds. (1996). Exploring startup event sequences. Journal of Business Venturing, 11(3), 51-66.
[9] Castrogiovanni, G. (1996). Pre-startup planning and the survival of new businesses: Theoretical linkages. Journal
of Management, 22(6), 801-822.
[10] Davidsson, P. (2006). Nascent entrepreneurship: Empirical studies and developments. Foundations and
Trends in Entrepreneurship, 2(1), 1-76.
[11] Delmar, F., Davidsson, P. (2000). Where do they come from? Prevalence and characteristics of nascent entrepreneurs. Entrepreneurship and Regional
Development, 12(1), 1-23.
[12] Gartner, W.B., Shaver, K.G., Carter, N.M. & Reynolds, P.D. (2004). Handbook of entrepreneurial
dynamics: The process of business creation. Thousand
Oaks, United States: SAGE Publications. Available at:
https://in.sagepub.com/en-in/sas/handbook-of-entrepreneurial-dynamics/book225701
[13] Kurtako DF. & Hodgetts RM. (2007).
Entrepreneurship: Theory Process Practice. Mason, Ohio:
Thomson South-Western. Available at:
https://trove.nla.gov.au/work/19557691?q&sort=holdings+ desc&_=1535518669328&versionId=46638813
[14] Parker, S.S. (2004). The economics of
self-employment and entrepreneurship. Cambridge: Cambridge
University Press.
[15] Thomas, A. S., Muller, S. L. (2000). A case for comparative entrepreneurship: Assessing the relevance of culture. Journal of International Business Studies, 31(2), 287-301.
[16] Van Auken, H.E. & L. Neeley. (2000). Pre-launch preparations and the acquisition of start-up capital by small firms. Journal of Developmental Entrepreneurship, 5(2), 169-182.
[17] Stuart Paul. (2011). Entrepreneurship: Perspectives and cases. International Journal of Entrepreneurship and
Innovation, 12(4), 316-317.
[18] Zhang, D. & Bruning, E. (2011). Personal characteristics and strategic orientation: Entrepreneurs in Canadian manufacturing companies. International Journal