A method for the spatial targeting of tidal stream
energy policies
Angela Vazquez
#1, Sharay Astariz
#2, Gregorio Iglesias
*3#Hydraulic Engineering, University of Santiago de Compostela EPS, Lugo, Spain
1[email protected] 2[email protected] *Plymouth University
School of Marine Science and Engineering, Plymouth, United Kingdom
Abstract— Policy making is called to play a decisive role in the commercialisation of tidal stream energy projects. For they are site-specific, spatial targeting of policies is needed, so that tidal stream regulations (financial supporting mechanisms, consenting procedures, etc.) could be concentrated to sites where they can achieve the greatest benefits. With this in view, the aim of this paper is: (i) to develop a new method to delimit the most suitable (target) areas for tidal stream energy policy intervention within a coastal area of interest, and (ii) to apply it to the Bristol Channel and Severn Estuary (UK). The method includes spatial numerical analysis by means of a Matlab-based code coupled with a Navier-Stokes solver. The programme works in steps, in which different constraints are imposed with a view to carry out a zoning process. As a result of this zoning process, four hotspots are selected, for which a set of policy interventions is proposed. This includes the specific levels of subsidisation for closing the grid parity gap of potential projects in each area. The method can be viewed as a supporting decision mechanism for spatially targeted policy-making and management of tidal stream energy across the Bristol Channel and Severn Estuary.
Keywords
—
Tidal stream energy; levelised cost of energy; spatial economics; energy policy; spatial planning.I. INTRODUCTION
Tidal stream energy is at the centre of global efforts towards climate change mitigation. In the wake of the Paris climate conference (COP21) in December 2015 and the ensuing Treaty, whereby 195 countries adopted the first-ever universal, legally binding global climate deal [1], the interest of a policy framework to promote the large-scale penetration of tidal stream energy projects, which could contribute substantially to the reduction of carbon emissions, has become apparent.
A variety of policies affecting ocean environments and resources have been proposed so far [2]. A case in point is the EU Renewable Energy Directive (Directive 2009/28) [3]. Setting a target for the production of energy from renewable sources (which includes tidal energy) of 20% final energy consumption by 2020 in the EU, such a policy gives context to developing and forthcoming tidal stream energy projects. In particular, the aforementioned Directive frames EU National Renewable Energy Plans, where targets for tidal stream
energy installed power are presented by EU countries [4]. To materialise this targeted installed power, consenting processes were specifically designed for the ocean energy sector [5]. At the same time, different economic mechanisms of subsidisation emerged as a market pull strategy [6] – which are called to contribute to overcoming the economic disadvantage of tidal stream energy with respect to conventional sources of energy, and to push the tidal sector towards grid parity [7]. Also, subsidisation could be seen as a way of internalising the positive externalities of tidal stream energy [8]. The most popular types of short-term strategies for the economic support of renewable energy are: direct subsidies, tax cuts for projects, and charging taxes for a certain amount of CO2 emissions. For their part, feed-in tariffs (FIT) constitute one of the most important and known mechanisms for promoting tidal energy in the long term [9]. Furthermore, as ocean energy installations become more prevalent, it is likely that they will be increasingly sited within, or near, existing international shipping lanes, areas of conservation, etc. [10] – for which Marine Spatial Planning (MSP) policies have been seen as a solution to overcome problems with overlapping jurisdiction and to support ocean energy to tap the full potential [2].
While the aforementioned policies are either sector-wide or cross-country, (i.e. stablished for the whole tidal stream energy industry [4] and/or for a group of countries (e.g. Ireland [11], UK or France [12]), tidal stream energy projects are site-specific [13]. This means that such policies need to be detailed and targeted to specific regions, where greatest benefits can be achieved. To this aim, the first step is to develop a zoning process that allows the identification of target areas of intervention. In this vein, a recent work presented the spatial variation of the levelised cost of tidal stream energy projects [14], thereby suggesting that fixed values of mechanisms of subsidisation such as FITs may not close the grid parity gap in all the areas of a certain region. Also, another study presented results on how functional constraints (competing uses for tidal stream energy in the marine space) would reduce potential areas for tidal stream energy, stating the need for negotiation with marine shipping traffic authorities, among others [15].
SPECIAL ISSUE OF THE TWELFTH EUROPEAN WAVE AND TIDAL ENERGY CONFERENCE, 27 SEPTEMBER - 1 AUGUST 2017, CORK, IRELAND ©EWTEC 2017. THIS IS AN OPEN ACCESS ARTICLE DISTRIBUTED UNDER THE TERMS OF THE CREATIVE COMMONS ATTRIBUTION 4.0 LICENCE (CC BY
h p://creativecommons.org/licenses/by/4.0/). UNRESTRICTED USE (INCLUDING COMMERCIAL), DISTRIBUTION AND REPRODUCTION IS PERMITTED PROVIDED THAT CREDIT IS GIVEN TO THE ORIGINAL AUTHOR(S) OF THE WORK, INCLUDING A URI OR HYPERLINK TO THE WORK, THIS PUBLIC LICENSE AND A COPYRIGHT NOTICE.
These previous works drew attention to the need for holistic and site-specific energy policies – which thereby could be led to an optimal allocation of resources and effort. In other words, the interests of both the traditional and the new users of the marine environment need to be balanced across macro/micro levels of analysis [16], with special attention to accurate overlaps between framing and site-dependant policies. While the challenge for both governments and industry is to find ways to harness tidal currents at an acceptable cost for the tidal industry (microeconomic level) [17], the real economic value of the related projects needs to be maximised (through positive externalities) [8] and their impacts on other marine users – inherent macroeconomic constraints – need to be rendered negligible.
With this in view, the aim of this paper is: (i) to develop a new method to delimit the most suitable target areas for tidal stream energy policy intervention within a coastal area of interest, and (ii) to apply it to the Bristol Channel and Severn Estuary (UK), an area that concentrates one of the highest tidal power potential in the world. The article is structured as follows. Section 2 deals with the development and implementation of the new method. Section 3 presents the results and discussion. Finally, conclusions are drawn in Section 4.
II. MATERIALS AND METHOD
The new method consists of several steps (Fig. 1). The first step is the assessment of the tidal stream resource across the selected domain (study area). The main parameters of tidal stream energy converters (rotor diameter, efficiency, etc.) are then used to estimate the potential power output over the study area. On this basis, an economic assessment is carried out through the spatial distribution of the levelised cost of energy (LCOE). Aspects of relevance such as port proximity (for grid connection) are also included in the economic analysis. Furthermore, socioeconomic impacts, such as potential conflicts with other activities, are mapped out as a final step.
The proposed method, which is materialised in a Matlab-based program coupled with a Navier-Stokes solver, is illustrated in Fig. 1 and explained throughout this section.
Fig. 1 Workflow of the new method.
A. Study area
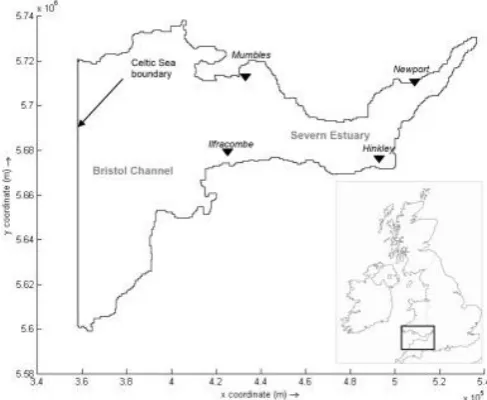
The study area is the Bristol Channel and Severn Estuary (UK), extending from the mouth of the Severn to the Celtic Sea, with the open ocean boundary between St Govan’s Head and Trevose Head (Fig. 2). It is the single largest resource area for tidal energy in the UK, and is considered of national strategic significance to meet the future demand for low carbon energy. Therein, spring tidal range exceeds 14 m and the peak currents are higher than 3 m s-1[18]. This location has also sufficient depth, access to ports and grid connectivity for device deployment. However, it is a complex hydrodynamic system that supports a wide range of marine habitats, marine communities and economic interests, as well as providing a major sea transport route into the UK heartland [19].
Fig. 2 Study area: the Bristol Channel and Severn Estuary (UK).
B. Resource assessment
The assessment of the tidal stream resource was based on results from a Navier–Stokes solver with a finite-difference scheme (Delft 3D-FLOW). Vertically-averaged expressions of the governing equations (conservation of mass, momentum and the transport equation) were used in their baroclinic form:
(1) (2) (3)
Q y V d x U dt
Ud dz x g x g fV y U V x U U t U h bx sx d 2 0 0
Vd dz y g y g fU y V V x V U t V h by sy d 2 0 0
R c d c D y Vc d x Uc d t c d dh
where U and V stand for the vertically integrated velocity components in the east (x) and north (y) directions, respectively; d represents the local water depth relative to a reference plane; Q is the intensity of mass sources per unit area; f is the Coriolis parameter,
h is the kinematic horizontal eddy viscosity, ρo is the reference density, ρ’ is the anomaly density, τsx, τsy, τbx and τby are the shear stress components [20]. As regards Eq. (3) (the transport equation),c stands for salinity or temperature, Dh is the horizontal eddy diffusivity, λd represents the first order decay process, and R is the source term per unit area [21].
The model was forced at the open boundary with a Dirichlet condition [22], i.e. with the sea level prescribed as a function of time. In particular, the following constituents were obtained from the global ocean tide model TPXO 7.2 [23], which proved to produce accurate results in a number of previous works, e.g. [21]: M2, S2, N2, K2, K1, O1, P1, Q1, M4. Salinity and temperature at the Sea Celtic boundary were imposed using data from the British Oceanographic Data Centre (BODC) [24]. Concerning the land margins, the boundary conditions were free slip (zero shear stress) and null velocity. The spatial resolution of the model was set to 500 m × 500 m (Cartesian grid cells of 0.25 km2). The bathymetry was interpolated onto the grid from the General Bathymetric Chart of the Oceans (GEBCO) [25].
Once set up, the model was run to cover a spring neap cycle plus 31 days of spinup period, which aimed to adjust dynamically the flow field so that the initial conditions did not affect the numerical results during the period of interest. The initial hydrodynamic conditions were null velocity and surface elevation throughout the grid (cold-start) [20].
The model was validated against measured tide levels at four gauge stations obtained from the UK tide gauge network and tidal stream data at five tidal diamonds from Admiralty Chart No.1165. On the whole, a high correlation between observed and predicted data was obtained (R2 > 0.87) (see [14]), which indicates the capability of the model to properly simulate the hydrodynamics in the study area.
C. Energy production
Resource assessment is a crucial first step in selecting potential areas for tidal stream energy development, for it provides valuable information about the hydrodynamics of the site in question [26]. Nevertheless, what determines the viability of a project, and therefore, decisions concerning tidal stream energy deployment in a coastal area, is the amount of energy production ([27]). In other words, the performance of a specific Tidal Energy Converter (TEC) at a given location needs to be assessed [28]. The energy production (technical potential) (Et) at each grid cell of the model was calculated by using Eq. (4):
(4)
where ρ is the water density, Cp is the power coefficient, A is the area swept by one rotor, n is the number of TECs, v(t) is the unperturbed fluid velocity (vertically averaged velocity in
each grid cell), and time t = 0 to time t = T1 is the period of time considered (one year).
Eq. (4) was included in an ad hoc Matlab-based program that worked coupled with the numerical model, thereby delivering an estimation of the energy output in a continuous manner across the study area. The program considered the following assumptions:
- Each 0.25 km2 cell accommodates the maximum number of TECs disposed in a staggered configuration, with lateral distances of 5 times the rotor diameter (D) and longitudinal distances of 10 times the rotor diameter ([29]) (Fig. 3).
- The diameter of the turbines considered in each grid cell was calculated as 70% of the water depth at Lowest Astronomical Tide (LAT). In other words, bathymetry was considered a limiting factor of the size of the potential rotors at each grid cell.
Fig. 3. Tidal stream energy turbines disposed in a staggered configuration.
D. Economic assessment
The economic potential was investigated on the basis of the levelised cost of energy (LCOE), which is a fundamental economic parameter that represents the cost of one electricity unit (kWh) produced by a tidal stream energy farm averaged over its entire expected lifetime ([30]) (estimated at 20 years):
(5)
where t stands for time, T represents the expected lifetime of the project, r is the discount rate and CAPEX and OPEX are the capital and operational costs, respectively. Eq. (5) was included in the aforementioned Matlab program, being resolved as explained below.
Capital expenditures (CAPEX) were calculated spatially, following a previous work [17], in which the Eqs. (6)-(9) were considered:
(6)
were CR represents the rotor costs (£), n is the number of turbines per grid cell, a1=80.388, b1=2.687, and D is the turbine diameter in meters.
(7)
vt dt AnC E
T t
t p
t
1
0 3 ) ( 2
1
10
0 1 1
t T tt t
T t
t
t t
t OPEX r E r
CAPEX LCOE
1
b 1D
na CR
were CCrepresents the cable costs (£), a2= 169.79 and L is the cable length, calculated as the minimum distance from the considered grid point to the shore in km.
3 5 10 25 . 1 1875 .
0 d
CF
3 5
10 5 4375 .
0 d
CF
(8)
d CF 0.18750.02
were CF stands for the foundation costs (in GBP per MW) and d is the water depth (imported from the numerical model) [31].
Operational costs (OPEX) were calculated by means of Eq.(9), which is based on the installed power (P) per cell in MW ([32]):
(9)
Finally, 20-year technical and economic lifetime (T) was assumed, together with a 10% annual discount rate (r) [17].
Table 1 summarizes the main cost categories included in the model and the related equations.
TABLE I
COST CATEGORIES INCLUDED IN THE MODEL
Cost (£) Variables Model
Rotor cost Rotor diameter (D) Number of converters (n)
n 80.388(2010) D2.687
Foundation costs
Water depth (d) d(0-30): 0.1875 + 1.25∙10-5d3 d(30-60): 0.4375 + 5∙10-5d3 d(>60): 0.1875 + 0.02d3
Cable costs Distance to the shoreline
169.79(2010)L
O&M Installed capacity (P)
310000P (MW)
Other Remaining
percentage of CAPEX
30%
E. Functional potential/competing uses
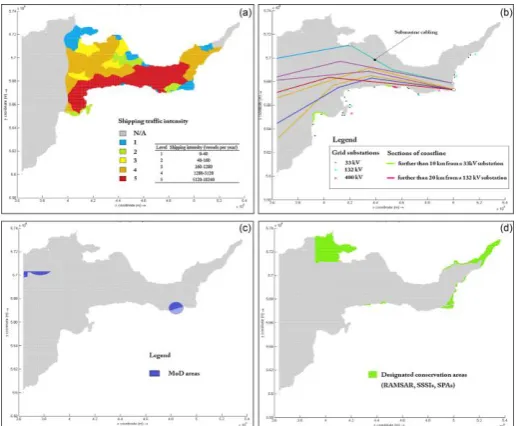
A number of competing uses for tidal stream energy deployment across the study domain were considered and interpolated into the model grid, including (Fig. 4): (a) shipping traffic; (b) submarine cabling and grid connection points; (c) MoD (ministry of defence) areas; (d) conservation areas [33]. In principle, grid points overlapping any of the previous uses were given the value “1”, while the rest were coded as “0”. Note that for shipping traffic activity, the “zero-areas” were those with lower density of vessels (less than 40-160 vessels per year).
An overlay function was included in the program. Capable of accessing simultaneously all the aforementioned spatial data, the function delivers an overall suitability map or in other words it demarcates target areas for tidal stream policy intervention.
Fig. 4. Competing uses for tidal stream deployment at Bristol Channel: (a) shipping traffic; (b) submarine cabling and grid connection points; (c) MoD (ministry of defence) areas; (d) conservation areas. [Reprinted from A holistic method for selecting tidal stream energy hotspots under technical, economic and functional constraints, 117, 420-430, Copyright (2016), with permission from Elsevier].
III. RESULTS AND DISCUSSION
A. Target areas for tidal stream energy development
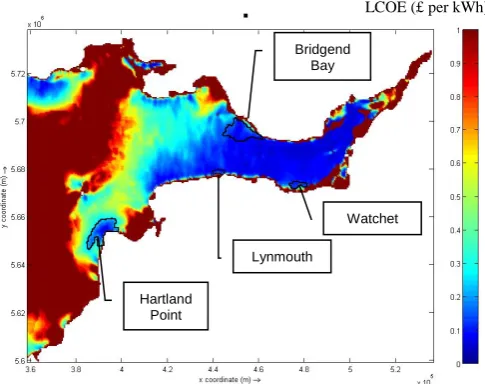
As a result of the method presented above, four areas were selected for potential tidal stream energy projects (Fig. 5). They are regions in which the LCOE is below £0.25 per kWh (maximum LCOE to provide adequate returns for investors over a 20-year period and to maintain momentum in the tidal stream energy sector [34]) and the maximum level of shipping intensity traffic is 2 (40–160 vessels per year) (Fig. 4). Apart from shipping, there is no overlay with other activities in the selected areas. Table 2 summarizes the results of each target area, which are further explained below.
- Hartland point is located on the north-western tip of the Devon coast in England. The surrounding area has spring rates above 1.5 m s-1, which results in power potentials in the range of 2-4 kW m-2.This potential could be exploited by up to 25 m tidal stream energy turbines, since the water depths in the area are in the range of 15-30 m. Provided that these turbines had a
Cp of 35%, 10 GWh per year could be produced (Fig. 6), with an associated LCOE of ~ £0.15 per kWh. According to [33], a closer electrical substation would be needed to deliver to the grid the electricity produced by the exploitation of tidal currents. Indeed, the area is further than 10 km from a 33 kW electrical substation.
- Lynmouth, on the North Devon coast, constitutes an excellent tidal stream site [35]. It was the scenario of the world’s first tidal current installation to be deployed in a working environment (the 300 kW tidal stream turbine “Seaflow” of Marine Current Turbines) and it has been recently included as a new tidal stream energy demonstration zone to be managed by the Wave Hub and the South West Marine Energy Park [36]. Lynmouth stands out for tidal P
streams over 2.25 m s−1 in conjunction with water depths in the range 15–25 m, which make it an ideal location for the deployment of the majority of first generation tidal energy converters (e.g. SeaGen). This site would have potential for producing up to 6 kW per m2 with a LCOE of ~ £0.15 per kWh. The nearby grid connection point at Lynton (at a distance of ~ 3.5 km) could allow the pool of up to 18 GWh per year in some points - an advantage that would accelerate the tidal energy penetration in this area.
Fig. 5. Tidal stream energy target areas across the study domain.
- Watchet is located in the inner part of the Bristol Channel, where spring flows are above 1.5 m s-1. This velocity, in conjunction with water depths of 15-20 m, results in power densities of 1-1.5 kW m2. By installing tidal stream energy turbines of 10-15 m of rotor diameter and power coefficients of 35%, the annual energy production would reach 20 GWh (Fig. 6) with LCOE values around £0.20 per kWh. Watchet has the advantage of being close to a grid substation. This provides an opportunity for early commercial expansion, without increasing the overall grid transmission costs of a future project. Although the area is located near a port, the degree of traffic intensity is 1 (Fig. 4a).
- Bridgend Bay lies on the Welsh coast (north Bristol Channel). In terms of tidal resource, this is one of the hotspots with higher spring flows (above 2.5 m s-1), which results in an annual energy density of around 20 MWh per m2. Water depths in this area are mostly below 20 m and located not further than 10 km to the shoreline. These values deliver LCOE values of 0.12 per kWh in some of the best points. The only drawback of this hotspot is that the traffic intensity is up to grade 2, which means that there are 40–160 vessels per year in the nearby and therefore, conflicts may ensue with shipping activity.
To sum up, the combined area of the previous hotspots represents 11.16% of the most economic area (i.e. area with LCOE values below £0.25 per kWh). From all the constraints, shipping activity is the one that has an overwhelming impact on the reduction of the economic potential for tidal stream
energy deployment. Indeed, areas with lowest LCOE values overlay with the main shipping routes and the highest density of vessels (level 5: 5120–10240 vessels per year) (Fig. 4a). The harder constraints, MoD and conservation areas, do not reduce significantly the areas where the resource is substantial (and the cost is low), with the exception of the space between Watchet and Bridwater Bay.
Fig. 6. Annual Energy Production (AEP) across the study domain.
TABLE II
TARGET AREAS FOR POLICY INTERVENTION
Target area AEP*
(GWh/year)
Cost (GBP2010
per kWh)
Distance to the shoreline (km)
Hartland point 10 0.11 - 0.25 <10
Lynmouth 18 0.10 - 0.18 <5
Watchet 20 0.09 - 0.20 <20
Bridgen Bay 30 0.11 - 0.18 <8
*AEP indicates an average of the annual energy production (AEP) at each
target area
For project developers, this method could contribute to enhancing the economic and consenting viability of a tidal stream energy farm, thereby reducing the risk of denial. On the other hand, policy makers could benefit from the results presented herein, for this work highlights the areas that require MSP, reinforcement of the network, and sheds light on the level of subsidisation needed to promote tidal stream energy projects in the target areas. The next section is devoted to discuss the implications of these results for policy making.
B. Implications for policy-making
Some interventions for the selected areas are presented below, showing the process of how the method and the results could be used for policy making.
- Avoided CO2 emissions: Provided that tidal stream energy projects were materialised in the target areas, thereby displacing conventional sources of energy, they could avoid LCOE (£ per kWh)
Hartland Point
Lynmouth
Watchet Bridgend
Bay
0.527 kg CO2 per kWh. The savings (Table 3) would contribute to meeting CO2 goals across the UK – a country that aims to reduce the UK’s greenhouse gas emissions by at least 80% (from the 1990 baseline) by 2050 [37]. In addition, avoided CO2 emissions are considered positive externalities, which means that they can be expressed in monetary terms as economic benefits [38]. Furthermore, the related benefits would be materialised in the form of subsidies for promoting the sector, thereby contributing to the long-claimed internalisation of positive externalities [8].
TABLE III
KEYPOINTS FOR POLICY INTERVENTION IN THE TARGET AREAS
Target area Avoided CO2
emissions (Tones)
FITs for grid parity (GBP2010
per kWh)
Hartland point
5,270 0.12
Lynmouth 9486 0.05
Watchet 15,810 0.08
Bridgen Bay 10,540 0.05
- Subsidies: They are called to play a decisive role in the attainment of grid parity. In other words, such mechanisms are designed to fill the gap between the cost of tidal stream energy and grid costs. Table 3 shows grid parity gaps for each target area, which shed light for the establishment of site-dependant FIT’s. This way, the distribution of economic resources would be optimized.
- Marine Spatial Planning (MSP): MSP is a key point in the European Integrated Coastal Zone Management (ICZM) Directive [39] which may apply to the study area. Excluding conflicts of use (e.g. conservation and military zones) were avoided for the selection of the target areas, however negotiation may be needed with traffic shipping for the exploitation of the tidal stream energy resources in the four areas. Such a negotiation may imply the establishment of buffer distances, which strongly depend on installed power and size of the installation – results presented in this case study.
IV. CONCLUSIONS
In this work, a new method for the spatial targeting of tidal stream energy policies was developed and applied to a case study in the Bristol Channel and Severn Estuary (UK). The method accounts for technological, economic and functional constrains that may alter the potential for tidal energy production in the study area, giving as a result number of target areas for policy intervention.
To materialize the method a new tool was developed, performing four fundamental steps: (1) resource assessment, by means of a numerical model calibrated and validated with field data; (2) energy output calculation, by coupling the numerical model with an ad hoc Matlab-based program in which the main technical specifications of a tidal turbines were taken into account; (3) LCOE estimation, by means of a
program that includes a number of equations dependent on spatial variables; and (4) exclusion of zones with competing uses for tidal stream energy deployment. As a result of the process, four hotspots were identified, i.e. economical and conflict-free areas for tidal stream energy development.
Then, for each hotspot a series of accurate policies were discussed, showing the interest of the proposed method for particularizing the interventions set for each location. In particular, results were linked to three axis of actuation: CO2 emissions, subsidies and marine spatial planning. For each of them, policy interventions – framed within the existing regulations – were discussed, e.g. accurate level of subsidization to attain grid parity in each area.
The methodology presented herein is new and could be applied by future owners, investors and funding bodies related to tidal stream energy systems, since it is based on maps and thus easy to manage. Also, governmental bodies involved in the design or selection of support mechanisms for tidal stream energy (throughout e.g. feed-in tariffs) may find it useful. Last, but not least, the interest of this work goes beyond the results of the case study presented herein, in that the proposed method can be applied to any tidal stream region of interest where similar data are available.
ACKNOWLEDGMENT
The authors wish to thank the British Oceanographic Data Centre for providing tide gauge records and bathymetric data. During this work A. Vazquez has been supported by the FPU grant 13/03822 of the Spanish Ministry of Education, Culture and Sports (Ministerio de Educación, Cultura y Deporte) and by the Barrie Foundation through a grant to undertake a predoctoral fellowship at Plymouth University, UK.
REFERENCES
[1] United Nations Climate Change Conference, Paris 2015. [Online]. Available: http://www.cop21.gouv.fr/en/
[2] A. Uihlein, D. Magagna, “Wave and tidal current energy – A review of the current stage of research beyond technology,” Renewable and Sustainable Energy Reviews, vol. 58, pp. 1070-1081, 2016.
[3] Directive 2009/28 of the European Parliament and of the Council of 23 April 2009 on the promotion of the use of energy from renewable sources and amending and subsequently repealing Directives 2001/77/EC and 2003/30/EC/EC; 2009.
[4] A. Vazquez, S. Astariz, G. Iglesias, “A strategic policy framework for promoting the marine energy sector in Spain,” Journal of Renewable and Sustainable Energy, vol. 7, pp. 061702, 2015.
[6] H. Jeffrey, J. Sedwick, G. Gerrad, “Public funding for ocean energy: A comparison of the UK and U.S,”
Technological Forecasting and Social Change, vol. 84, pp. 155-170, 2014.
[7] A. Vazquez and G. Iglesias, “Grid parity in tidal stream energy projects: An assessment of financial, technological and economic LCOE input parameters,”
Technological Forecasting and Social Change, vol. 104, pp. 89-101, 2016.
[8] A. Vazquez and G. Iglesias, “Public perceptions and externalities in tidal stream energy: a valuation for policy making,” Ocean and Coastal Management, vol. 105, pp. 15-24, 2015.
[9] G. Aquila, E. de Oliveira Pamplona, AR. De Queiroz, P. Rotela Junior, M. Nunes Fonseca, “An overview of incentive policies for the expansión of renewable energy generation in electricity power systems and the Brazilian experience,” Renewable and Sustainable Energy Reviews, vol. 70, pp. 1090-1098, 2017.
[10] Wright, AM. O’Hagan, J. de Groot, Y. Leroy, N. Soininen, R. Salcido, M. Abad Castelos, S. Jude, J. Rochette, S. Kerr, “Establishing a legal research agenda for ocean energy,” Marine Policy, vol. 63, pp. 126-134, 2016.
[11] A.M. O’Hagan, A.W. Lewis, “The existing law and policy framework for ocean energy development in Ireland,” Marine Policy, vol. 35, pp. 772-783, 2016. [12] I. Bailey, J. de Groot, I. Whitehead, A. Vantoch-Wood,
P. Connor, “Comparison of national policy frameworks for marine renewable energy within the United Kingdom and France,” MERiFIC – Task 4.1.2. MERiFIC; 2012. [13] V. Ramos, R. Carballo, M. Alvarez, M. Sanchez, G.
Iglesias, “A port towards energy self-sufficiency using tidal stream power,” Energy, vol. 71, pp. 432-444, 2014. [14] A. Vazquez and G. Iglesias, “LCOE (levelised cost of
energy) mapping: A new geospatial tool for tidal stream energy,” Energy, vol. 91, pp. 192-201, 2015.
[15] A. Vazquez and G. Iglesias, “A holistic method for selecting tidal stream energy hotspots under technical, economic and functional constraints,” Energy Conversion and Management, vol. 117, pp. 420-430, 2016
[16] G. Dalton, G. Allan, N. Beaumont, et al., “Economic and socio-economic assessment methods for ocean renewable energy: Public and private perspectives,”
Renewable and Sustainable Energy Reviews, vol. 45, pp. 850-878, 2015.
[17] A. Vazquez and G. Iglesias, “Capital costs in tidal stream energy: a spatial approach,” Energy, vol. 107, pp. 215-226, 2016.
[18] ABPmer. Atlas of UK marine renewable energy resources. 2008 [Online]. Available:
http://www.renewables-atlas.info/
[19] Regen SW. Bristol Channel Energy – a balanced technology approach, 2012 [Online]. Available: http://regensw.s3.amazonaws.com/bristol_channel_energ
y_balanced_technology_approach_20121127_dc91be5ef c7914f8.pdf
[20] R. Carballo, G. Iglesias, “Numerical model evaluation of tidal stream energy resources in the Ría de Muros (NW Spain)”, Renewable Energy, vol. 34(6), pp. 1517–24, 2009.
[21] V. Ramos, R. Carballo, M. Álvarez, M. Sánchez, G. Iglesias, “Assessment of the impacts of tidal stream energy through high-resolution numerical modelling,”
Energy, vol. 61, pp. 541–54, 2013.
[22] M. Sanchez, R. Carballo, V. Ramos, G. Iglesias, “Floating vs. bottom-fixed turbines for tidal stream energy: a comparative impact assessment,” Energy, vol. 72, pp. 691-701, 2014
[23] BD. Dushaw, GD. Egbert, PF. Worcester, BD. Cornuelle, BM Howe, KA. Metzger, “A TOPEX/POSEIDON global tidal model (TPXO 7.2) and barotropic tidal currents determined from long-range acoustic transmissions,” Process in Oceanography, vol. 40, pp. 337-67, 1997.
[24] The British Oceanographic Data Centre (BODC) website [Online]. Available: https://www.bodc.ac.uk/
[25] The General Bathymetric Charts of the Ocean (GEBCO) website [Online]. Available: http://www.gebco.net/ [26] M. Lewis, SP Neill, PE Robins, MR Hahemi, “Resource
assessment for future generations of tidal stream energy arrays,” Energy, vol. 83, pp. 403-415, 2015.
[27] R. Carballo, M. Sanchez, V. Ramos, F. Taveira-Pinto, G. Iglesias, “A high resolution geospatial database for wave energy exploitation” Energy, vol. 68, pp. 572-583, 2014 [28] M. Sanchez, R. Carballo, V. Ramos, G. Iglesias, “Energy
production from tidal currents in an estuary: a comparative study of floating and bottom-fixed turbines,” Energy, 77, pp. 802-811, 2014
[29] R. Malki, I. Masters, AJ. Williams T. Nick, “Planning tidal stream turbine array layouts using a coupled blade element momentum – computational fluid dynamics model,” Renewable Energy, vol. 63, pp. 46-54, 2014. [30] S. Astariz, A. Vazquez, G. Iglesias, “Evaluation of the
levelised cost of tidal, wave and offshore wind energy,”
Journal of Renewable and Sustainable Energy vol. 7:053112, 2015.
[31] J Serrano, M Burgos, J Riquelme, “An improved evolutive algorihtm for large offshore wind farm optimum turbines layout”. In: 2011 IEEE PowerTech, 1-6, 2011
[32] Ernst and Young. Cost of a financial support for wave, tidal stream and tidal range generation in the UK. A report for the Departament of Energy and Climate Change and the Scottish Government, 2010
[33] MC. Ashley. Ecosystem service mapping in the Severn Estuary and inner Bristol Channel. Report for NERC Marine Renewable Energy knowledge Exchange Project. September 2014; RSPB and Plymouth Marine Laboratory, Plymouth.
[Online].Available:
https://hub.globalccsinstitute.com/publications/wave- and-tidal-energy-uk-conquering-challenges-generating-growth
[35] A. Vazquez and G. Iglesias, “Device interactions in reducing the cost of tidal stream energy,” Energy Conversion and Management, vol. 97, pp. 428-438, 2015. [36] WaveHub Ltd. [website]. Available:
https://www.wavehub.co.uk/north-devon-tidal-zone [37] Gov.uk [Online]. Available:
https://www.gov.uk/government/publications/2010-to-
2015-government-policy-greenhouse-gas- emissions/2010-to-2015-government-policy-greenhouse-gas-emissions
[38] A. Vazquez and G. Iglesias, “Should tidal stream energy be publicly funded? Evidence from a choice experiment study,” Proceedings of 11th European Wave and Tidal Energy Conference (EWTEC); 2015