P
age
35
Tiruchirapalli District: A Spatio-Temporal Analysis of
Change in Occupational Structure (1971-2011)
Dayalan N.* & Pavendar. T**
*Guest Lecturer, Department of Geography, Periyar E.V.R College (Auto.), Triuchirappalli, Tamil Nadu, India. **Assistance Professor, Department of Geography, Periyar E.V.R College (Auto.), Triuchirappalli, Tamil Nadu,
India.
ABSTRACT
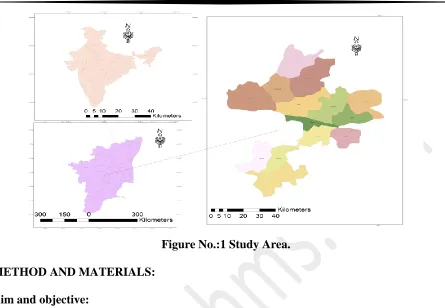
A study on the changing pattern of occupational structure may be helpful in the planning process for further development of the region. The study area lies between 10° 15’ and 11° 12’ North latitudes and 78° 10’ and 79° 5’ East longitudes (fig.2.1).The study area lies along the east coastal plain and form a part of the Deccan plateau, one of the natural divisions of India. These regions Poverty and Unemployment are major problems in the country. The decline in labor force from primary sector may enhance poverty and unemployment situation. In this context a study on population characteristics has to test the significance of change in the occupational structure statistically. Hence the Analysis of Variance One-Way classification is used to test the significance of change in Occupational structure. Now the participation of males and females are almost similar in any type of occupation. Hence there is a need to experiment the significance of change in Occupational Structure among males and females also, which is also performed using Analysis of Variance One Way classification.
Key words: Occupational structure, Male Workers, ANOVA, Tiruchirappalli, Agricultural, Agriculture Labour
INTRODUCTION:
A geographical analysis of changes in population characteristics enables us to identify the direction of change and their significance and its impact on other related phenomenon. Moreover the present study may form the base for further studies.
Change in occupational structure is a significant feature in any area. Empirical observation in various parts of Tamil Nadu has brought to light a change in occupational structure. The recent trend is a shift from primary sector to either secondary or tertiary sector. Such changes are the result of introduction of machineries in farming, increase in the proportion of wasteland due to degradation of the quality of land, decline in the fertility of the soil and the haphazard urban expansion on the good quality agricultural lands. It is worth stating that the decrease in the proportion of workers from the agricultural sector is not a healthy symptom of development. In a country like India where the size of population is huge ranking only next to China, the need for food is also a major basic requirement.
P
age
36
those of 1895, 1930, and 1950. Structural changes in Mexico's labor force have never been adequately studied, and the results of the present research shed considerable new light on Mexico's development. The findings also suggest important paradoxes and discontinuities in the early stages of industrialization that merit systematic recognition in models and measurements of structural change over the course of development.
Dr. Sherap Bhutia: The study of occupational structure dealing with working (main and marginal) and non-working population has been carried out in the present study. It reveals from the study that the area under study proves to be a complicated region requiring considerable care & attention in the matter of intensive development.
Sean Lowery and Allen G. Noble: This paper examines the changes in occupational structure among the Amish of Holmes County, Ohio, the largest Amish settlement in the world. It also investigates differences in occupations among the three leading sects of Amish in this county. Occupations listed by the Amish themselves in the Ohio Amish Directory are used to trace the decline in farming, as well as to identify the growing types of non-farm employment. Not only are numbers of Amish in non-agricultural jobs increasing, so also is the range of employment opportunities available.
Vıctor Aguirregabiria and Cesar Alonso-Borrego: Recent studies have found evidence for the complementarity between white-collar labor and technological capital. However, the estimated elasticities appear too small to explain the observed changes in labor occupational structure.
STUDY AREA
P
age
37
Figure No.:1 Study Area.
METHOD AND MATERIALS:
Aim and objective:
So far Geographers have analyzed the change in occupation based on maps. But the change if measured statistically could be of immense use for planning. Hence using the Analysis of Variance an attempt is made to measure statistically.
1. The significance of change in occupational types among total workers. 2. The significance of change in the occupational types among male workers. 3. The significance of change in the occupational types among female workers.
A statistical analysis may yield fruitful results when the observation is made for a reasonably longer period. Hence in the present analysis the analysis in performed for the statistical data obtained from the Tamil Nadu census reports for the census period 1971and 2011.
Technique
One of the most powerful tools of statistical analysis to study variation is “Analysis of Variance” a systematic procedure developed by R.A Fishers in 1920s and 1930s Analysis of variance is a statistical technique, which assesses the contribution made by each separate factor to the total variability of a set of data. The analysis of variance is the separation of variance ascribable to one group of causes from the variance ascribable to another group. It is a procedure by which the variation embodied in the data may be resolved with component variation due to the independent factors. Each of the components yields an estimate of the population variance and these estimates are tested for homogeneity by means of „F‟ table.
P
age
38
present study the analysis of variance one-way classification is performed using Data Analysis procedure in Micro Soft Excel® software and SPSS-10 through computer.
DISCUSSION AND RESULT:
Total Workers
In the present analysis the proportion of total workers in different occupational types namely cultivators, agricultural labourers, secondary workers and tertiary workers is calculated as percent to total workers for the five census periods namely 1971, 1981, 1991, 2001 and 2011. The difference in the percentage values (table 1.1,) are computed and subjected for the ANOVA (table 1.2).
The analysis of variance one way classification is used to test the significance of change in the occupational structure in Tiruchirappalli district. The analysis is performed using Microsoft Excel® and SPSS10 through computer. For the purpose of interpretation the calculated F value is compared with the table F value. When the calculated F value is greater than the table value, it
is concluded that the change in the occupational structure is significant and vice versa. Table 1.1
Total Workers
Difference in Percentage (1971- 2011) Panchayat Unions/
Blocks CU AG SEC TER
Uppiliyapuram -19.34 18.86 -2.44 2.93
Thuraiyur -7.81 4.11 -4.35 8.06
Thathiyangarpetai -7.68 4.61 -5.90 8.97
Manachanallur -19.55 5.88 -8.37 22.03
Musiri -20.40 11.43 -2.73 11.72
Pullambadi -16.09 17.18 -9.05 7.77
Thottiam -17.35 15.95 -3.43 4.83
Lalgudi -17.33 10.01 -5.38 12.70
Andhanallur -14.82 1.32 -12.82 -21.79
Thiruverambur -4.75 -0.54 -25.36 30.66
Manikandam -26.33 -8.53 -17.10 2.35
Vaiyampatti -15.47 12.60 -2.04 4.92
Manapparai -19.48 3.77 -6.05 21.75
Marungapuri -18.10 13.75 -1.12 5.47
P
age
39
Table 1.2
ANOVA ONE WAY CLASSIFICATION (1971- 2011)
Source of
Variation
Sum of Squares Df Mean sum F
Between Occupation Error Total
6173.85 3706.19 9880.04
3 52 55
2057.95 71.27
28.87*
Table value at 1% 4.2 and 5% 2.79 * Significant at 1%& 5% level.
The overall change in the occupational structure of total workers between 1971 and 2011 is presented in table 1.2. The calculated F value of 28.87 indicates a significant change at 1% and 5% level when compared with the table value. Thus the hypothesis that the study area has experienced a change in the occupational structure is proved.
Male Workers
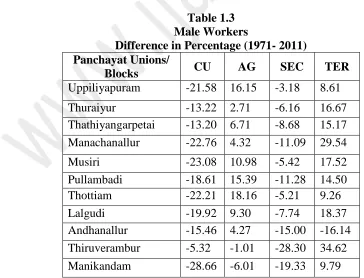
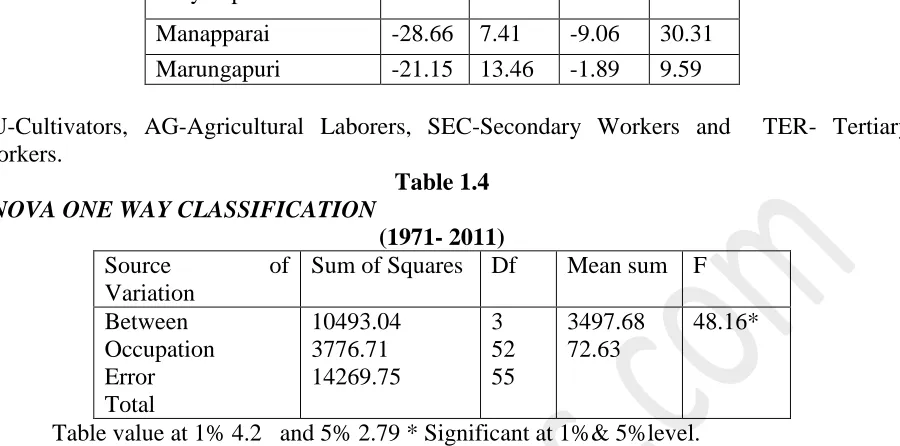
Having proved the significance of change in the occupational structure in Tiruchirappalli districts among the total workers between 1971 and 2011, an attempt is made to test the significance of change in terms of male and female workers. Hence the proportion of the males employed as cultivators, agricultural laborers, secondary workers and tertiary workers to total male workers are expressed as percent for the census years 1971 and 2011. The difference in the occupational types in the panchayat unions between 1971- 2011 is (table 1.3) calculated and subjected to analysis of variance one way classification. (Table 1.4).
Table 1.3 Male Workers
Difference in Percentage (1971- 2011) Panchayat Unions/
Blocks CU AG SEC TER
Uppiliyapuram -21.58 16.15 -3.18 8.61
Thuraiyur -13.22 2.71 -6.16 16.67
Thathiyangarpetai -13.20 6.71 -8.68 15.17
Manachanallur -22.76 4.32 -11.09 29.54
Musiri -23.08 10.98 -5.42 17.52
Pullambadi -18.61 15.39 -11.28 14.50
Thottiam -22.21 18.16 -5.21 9.26
Lalgudi -19.92 9.30 -7.74 18.37
Andhanallur -15.46 4.27 -15.00 -16.14
Thiruverambur -5.32 -1.01 -28.30 34.62
P
age
40
Vaiyampatti -19.13 11.90 -2.61 9.84
Manapparai -28.66 7.41 -9.06 30.31
Marungapuri -21.15 13.46 -1.89 9.59
CU-Cultivators, AG-Agricultural Laborers, SEC-Secondary Workers and TER- Tertiary Workers.
Table 1.4
ANOVA ONE WAY CLASSIFICATION
(1971- 2011)
Source of
Variation
Sum of Squares Df Mean sum F
Between Occupation Error Total
10493.04 3776.71 14269.75
3 52 55
3497.68 72.63
48.16*
Table value at 1% 4.2 and 5% 2.79 * Significant at 1%& 5%level.
The significance of change in occupation among male workers between 1971 and 2011 is tested using ANOVA one way classification (table 1.3 and 1.4).
The overall change in the occupational structure of male workers calculated using Analysis of Variance one way classification shows a high significance with calculated F value of 48.16. Thus the occupational structure of male workers has also undergone significant change between 1971 and 2011 in the study area.
Female Workers
The analysis of change in occupational structure has revealed a change among female workers also Hence the need arises to test the significance of change among female workers classed as cultivators, agricultural laborers, secondary workers and tertiary workers. The workers in each occupation are calculated as percent to total female workers in each of the panchayat unions. The difference in percent in each category between 1971-2011 is calculated and tabulated (table 1.5) the change in the occupation among female workers is subjected to ANOVA one way classification (table 1.6).
The significance of change in the female occupational structure over a longer period of time namely 1971 and 2011 is attempted and presented in table 1.5 and 1.6.
Table 1.5 Female Workers
Difference in Percentage (1971- 2011) Panchayat Unions/
Blocks CU AG SEC TER
Uppiliyapuram 1.12 -1.72 0.45 0.14
Thuraiyur 8.22 -10.27 0.90 1.16
P
age
41
Manachanallur -7.07 -6.50 -0.69 14.26
Musiri -8.38 -2.77 4.01 7.14
Pullambadi -5.26 5.51 -0.74 0.48
Thottiam -0.48 -2.40 0.37 2.51
Lalgudi -4.30 -3.22 0.92 6.60
Andhanallur -4.37 -25.81 -2.00 -23.51
Thiruverambur -0.88 -3.70 -8.83 13.40
Manikandam -8.08 -34.79 -8.62 -4.99
Vaiyampatti 0.95 -3.76 0.53 2.28
Manapparai 3.57 -17.68 1.38 12.74
Marungapuri -4.88 1.08 0.65 3.15
CU-Cultivators, AG-Agricultural Laborers, SEC-Secondary Workers and TER- Tertiary Workers.
Table 1.6
ANOVA ONE WAY CLASSIFICATION
(1971- 2011)
Source of
Variation
Sum of Squares Df Mean sum F
Between Occupation Error Total
936.45 3268.18 4204.63
3 52 55
312.15 62.85
4.97*
Table value at 1% 4.2 and 5% 2.79 * Significant at 1%& 5%.
The overall change in occupational structure between 1971-2011 calculated using Analysis of Variance one way classification is presented in table 4.24, It could be inferred that the calculated F value 4.97 is higher than the table value at 1% and 5% level, so it could be safely concluded that the change in occupational structure of female workers is also significant.
In the light of this analysis it could be concluded that in the study area the proportion of male workers engaged in various occupations has experienced a change. Male workers when compared to female workers have experienced a highly significant change. However there is decrease in male workers engaged in primary activities much more than the female workers. This is not a healthy trend as it indicates a declining trend in agricultural activities.
Further the data subjected to ANOVA reveals a decline in the workers classed as Cultivators and Agricultural labourers and an increase in the workers in the Secondary and Tertiary sector.
CONCLUSION:
P
age
42
1. The study area has experienced a significant change in the occupational structure between 1971 and 2011.
2. The change in the occupational structure is also significant among male and female population.
3. The workers engaged in tertiary sector have experienced a significant increase in the case of both male and female population.
4. The workers engaged in primary activities as cultivators and agricultural labourers have experienced a decline in the case of male workers, while female workers exhibit less significant change.
5. However the sizeable increase of female workers in tertiary sector is an inviting trend towards women development.
REFERENCE:
i. Adam ka-lok cheung and wei-jun jean yeung temporal-spatial patterns of one-person households in china, 1982–2005 volume 32, article 44, pages 1209−1238 Published 3 june 2015.
ii. Aguirregabiria.v, C. Alonso-borregoroccupational structure, technological Innovation, and reorganization of production, Labour Economics 8(2001)43–73.
iii. Bhagat, R. B and Das, K. C. (2008). „Levels, Trends and Structure of Workforcein India: Census Based Study 1982001‟, International Institute for Population Sciences, pp. 1-182.
iv. Dr.N.Sayira Banu, Changing Occupational structure and Economic Condition of Farm
labourers in India: A Study., Indian Economy, May - June, 2015
v. Dr. Sherap Bhutia A Spatio-Temporal Study on Occupational Structure of Population in
Darjeeling District of West Bengal RJSSM: Volume: 04, Number: 04, August 2014 Page 233.
vi. Karamvir1, Manoj Kumar2 Work Participation and its Occupational Structure in Haryana: A Spatio-Temporal Analysis International Journal of Science and Research (IJSR) Volume 6 Issue 4, April 2017.
vii. Leigh Shaw-Taylor and E.A. Wrigley ,Occupational structure and population change Department of Geography, University of Cambridge.
viii. Leigh Shaw-Taylor Male Occupational Change and Economic Growth 1750-1851.
Department of Geography, University of Cambridge.
ix. Lowery and no ble. Changing occupational structure of the amis. The great lakes geographer, vol. 7, no. 1, 2000
x. Effect of change in the occupational structure on extending life expectancy in Germany--a cohort analysis. https://www.ncbi.nlm.nih.gov/pubmed/8369603.
xi. Lahoti, R. (2013). „Economic Growth and Female Labour Force Participation in India‟,
P
age
43
xii. Structural Change Early in Development: Mexico's Changing Industrial and Occupational Structure from 1895 to 1950. https://www.cambridge.org/core/journals/journal-of- economic-history/article/structural-change-early-in-development-mexicos-changing-
industrial-and-occupational-structure-from-1895-to-1950/136AED3A634C55AD9655D281497CCE72.
xiii. www.censusofindia.gov.in
xiv. www.mapofindia.com
xv. www.tiruchirappalli.nic.in