IJPAR |Vol.5 | Issue 1 | Jan- Mar -2016 Journal Home page: www.ijpar.com
Research article Open Access
Preparation and evaluation of microspheres loaded with ranolazine for
controlled release with polyacrylic polymer
Niraj
1, Srikrishna R.M
2*, Prof. V Gowda
3, Prof. K.V. Ramana Murthy
41
Alembic Pharmaceuticals Ltd, Alembic Road, Gowra, Vadodara, Gujarat-390003
2
Laurus Labs, Plot No:DS1, IKP Knowledge Park, Turkapally, Shameerpet, Hyderabad – 500078
3
Professor, JSS College of Pharmacy, Sri Shivarathreeshwara Nagar, Mysore-570 015
4
Professor, Department of Pharmaceutical Sciences College of Pharmacy, Andhra University,
Visakhapatnam-530 003
*Corresponding author: Srikrishna. R.M
E-mail:[email protected]
ABSTRACT
Microencapsulation of drugs in a hydrophobic matrix such as Eudragit microspheres controls the release of drugs. Eudragit polymers are series of acrylate and methacrylate polymers available in different ionic forms. Eudragit L 100 and EudragitL 100-55 are insolublein aqueous media but they are permeable and both have pH-independent release profiles.Polymer Eudragit and drug Ranolazine (earlier passed through sieve no. 100) were dissolved in specified quantity of acetone-methanol mixture. Required quantity of Aluminum stearate was added as deflocculating agent and the mixture was stirred at 500 rpm on a magnetic stirrer at 10°C. The resulting emulsion was stirred at 35°C for four hr. The organic solvent acetone-methanol was completely removed by evaporation; finally the prepared solidified microspheres were filtered, and then washed 6 times with an aliquot of 50 ml n-hexane to remove all the presence of liquid paraffin from microspheres. Dissolution studies were carried out at pH 1.2 HCl buffer for 2 hrs followed by 7 hrs in pH 7.4 phosphate buffer using USP XXI dissolution apparatus type II(basket type). Dissolution media having volume of 900ml was kept at 37ºC ± 0.5 ºC. Initial drug release from Eudragit microspheres at intestinal environment by biphasic manner and associated with an initial burst release of 21.27 % to 74.94 %, 10.19 % to 67.57 %, 8.35 % to 61.53 %, 27.92 % to 75.69 %, 31.32 % to 72.37 % and 37.48 % to 65.89 % drug from F1, F2, F3, F4, F5 and F6 microspheres respectively. The burst release in intestinal pH might be due to the release of surface accumulated drug. After initial burst effect, the subsequent release of drug was slow and sustained. F1 formulation can be supposed to be the optimized formulation. This optimization can be attributed to good percent release of drug at end of 9th hour. Also F1 formulation has shown a good consistency in shape, sphericity and uniformity in the preparation of microspheres.
Keywords:
Ranolazine, Microencapsulation, Solvent evaporation method.
INTRODUCTION
The characteristics of microspheres containing drug should be correlated with the required therapeutic action and are dictated by the materials and methods employed in the manufacture of the delivery systems. Oral controlled release dosage forms such as microparticles are becoming more popular than single unit dosage forms. The uniform distribution of these multiple unit dosage forms along the gastro intestinal tract can result in more reproducible drug absorption and reduced risk of local irritation.
Microencapsulation of drugs in a hydrophobic matrix such as Eudragit microspheres controls the release of drugs. Eudragit polymers are series of acrylate and methacrylate polymers available in different ionic forms. Eudragit L 100 and EudragitL 100-55 are insolublein aqueous media but they are permeable and both have pH-independent release profiles. The permeability of Eudragit L 100 and L 100-55 in aqueous media is due to the presence of quaternary ammonium groups in their structure; Eudragit L 100 has a greater proportion of these groups and as such is more permeable than EudragitL 100-55.
Acrylic polymers are widely used as tablet coatings and as release retardants polymer. The most interesting thing amonghigh permeable acrylic polymers Eudragit L 100 and low permeable EudragitL 100-55, both are neutral co-polymers of poly (ethylacrylate, methyl methacrylate) and trimethylaminoethyl methacrylate chloride and are insoluble in water and digestive juices, but bothswell and are permeable, which means that the drugs can be released by diffusion. Therefore, the permeability of the drug through Eudragit RS and/or RL is independent of the pH of the digestive tract.
Ranolazine, a drug which is used as antianginal agent and it exhibits short half life, and has good solubility in gastro acidic medium, so has been desired to formulate it with pH dependent binder to sustain the release upto intestinal pH and to extend the action of antianginal effect. In the present study, Ranolazine is formulated as microspheres by employing solvent evaporation method using Eudragit as carrier, which has the ability to retard drug release. The technique involves emulsification and evaporation of solvents. Acetone and methanol are the solvents used for preparation of emulsion of Eudragit and Ranolazine which is further added with aluminum
stearate as deflocculating agent and is followed by dispersing the whole mixture in liquid paraffin with continuous stirring. The Ranolazine microspheres were evaluated using scanning electron microscopy (SEM), FTIR, DSC, sphericity and micromeritic properties. Release kinetics was studied in simulated gastric fluid and simulated intestinal fluid. The present study suggests that Ranolazine microsphere prepared by solvent evaporation technique is a novel approach to formulate controlled release dosage form.
Ranolazine is selected as model drug based on
certain criteria such as,
Drug shall exhibit dissolution dependent bio absorption.
The prescribed dose of the drug should be low and requires less frequent dosing.
Short plasma half-life.
Gastro intestinal tract irritation and dose related side effects.
Preclinical data proves that Ranolazine reduces myocardial ischemic injury without reducing blood pressure and heart rate. There are no clinically significant changes in blood glucose, lipid values, or liver function, suggesting that the metabolic effect of Ranolazine does not extend to systemic glucose regulation or lipid metabolism. Ranolazine solubility is good at gastric pH
MATERIALS AND METHODS
Preparation of Microspheres
The solution of n-hexane is UV spectrophotometrically analyzed for the presence of drug in it. This analysis helps in calculating encapsulation efficiency of Eudragit microspheres.
Characterization of Microspheres
Characterization of microspheres is important in order to develop a drug product of high quality. The parameters generally used to characterize the microspheres include the average particle diameter, their size distribution, morphology, drug loading, physical state of drug within the Eudragit and drug releasing properties.
Compatibility studies
In the microspheres, drug is in intimate contact with one or more excipients, which could affect the stability of the drug. Knowledge of drug excipients interactions is therefore essential for selecting appropriate excipients. This was studied using FT-IR spectrophotometry and differential scanning calorimetry (DSC).
Fourier transform infrared spectroscopy
(FTIR)
IR spectra of pure drugs, polymers, and of formulation were obtained with a Perkin-Elmer 1600 spectrophotometer (Monza, Italy), using KBr disks (about 10-mg sample for 100 mg dry KBr). The scanning range used was 2000 to 500 cm_1 at a scan period of 1 minute. FTIR spectrum of drug was compared with FTIR spectra of formulations. Disappearance of peaks or shifting of peaks in any of the spectra was studied.
Differential scanning calorimetry (DSC)
DSC is a technique in which the difference in heat flow between the sample and a reference is recorded versus temperature. DSC thermal analytical profile of a pure chemical represents its product identity. By comparing the DSC curves of a test sample with that of a reference, the presence of an impurity can be detected in a test sample. The scanning temperature for reference sample and test sample are the same when dynamic measurements are performed, and hence the required heat energy for chemical transformation is directly recorded on a heat flow versus temperature graph.
Yield of the process
The yield was determined by weighing the microspheres and then finding out the percentage yield with respect to the weight of the input materials, i.e., weight of drug and Eudragit used. The formula for calculation of % yield is as follows;
% yield = wt. of drug + wt. of Eudragit x 100 wt. of microsphere
Drug loading and encapsulation efficiency
Drug loading is important with regard to release characteristics. Generally, increased drug loading leads to an acceleration of the drug release. Drug entrapment efficiency represents the proportion of the initial amount of drug, which has been incorporated into the microspheres.
100 mg of Eudragit microspheres were weighed and transferred to 100 ml volumetric flask containing pH 7.4 phosphate buffer. From this, 1 ml of solution was transferred to 10 ml volumetric flask and diluted up to the mark. Further 1 ml of this solution is diluted to 10 ml and absorbance was measured at 272 nm. The drug content was calculated by using the formula, Amount = Conc. from standard graph X dilution factor of drug 1000
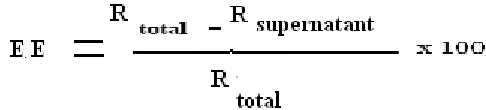
Percentage encapsulation efficiency is found out by calculating the amount of drug present in 100 mg of pellets. The Ranolazine microspheres in powdered form were obtained by mechanical stirring process, then they were washed with n-hexane and the surfactant aluminum stearate and the nonencapsulated drug had been removed following repeated stirring at 400 rpm and continuous washing with n-hexane. The suspension was filtered through a membrane filter to remove the polymer; total amount of drug present in n-hexane is assessed by properly diluting it with the mobile phase and they are then analyzed by UV as described below. The percentage of drug in n-hexane is the total free amount of drug. The percentage of drug entrapped in the Eudragit microspheres is represented by following equation,
Where E.E represents the encapsulation efficiency of microspheres, and Rtotal is amount of drug Ranolazine
Particle Size distribution
Particle size characteristics are of great importance for microspheres. Modification of the size significantly influences the release rate of incorporated drug, content uniformity, taste, texture and stability of the microspheres. Microspheres having size range between 50 and 1500 µm are estimated by sedimentation method by malvernmastersizer. This method helps to measures the diameter of a microsphere that are suspended in a liquid in which is not soluble and directly gives size distribution of the suspended microspheres. The suspension is placed in calibrated pipette from which the samples may be drawn from a fixed depth at various times. These samples are evaporated to dryness and the residue is weighed. Each sample withdrawn has a smaller particle size then that corresponding to the setting velocity, because all particles of larger size will have fallen below the level of the tip of the pipette. The effective or the stroke diameter is calculated by strokes equation,
d = √ 18 hη / (Pi-Pe) gt
Where,
η is the viscosity of the suspending liquid in Poises.
h is the distance between liquid surface and tip of pipette.
(Pi-Pe) is the difference in density between the particle and the suspending medium.
g is the gravitational constant.
t is second from the start of the measurement.
Angle of repose
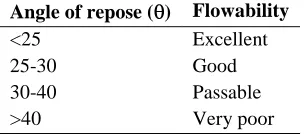
The flow characteristics of microspheres are measured by angle of repose. Improper flow of microspheres is due to frictional forces between the microspheres. These frictional forces are quantified by an angle of repose. Angle of repose is the maximum angle possible between the surface of a pile of the microspheres and the horizontal plane.
Fixed funnel method was employed. A funnel that was secured with its tip at a given height above the graph paper was placed on a flat horizontal surface. Microspheres were carefully poured through the funnel until the apex of the conical pile just touches the tip of the funnel. The radius and height of the pile were then determined.15The angle of repose ( ) for samples were calculated using the formula,
tan ( ) = height/radius.
Table no. 1: Relationship between angle of repose and powder flow
Angle of repose ( ) Flowability
<25 Excellent
25-30 Good
30-40 Passable
>40 Very poor
Compressibility
Carr’s index is a dimensionless quantity, which proved to be useful to the same degree as the angle of repose values for predicting the flow behavior. Apparent bulk density was determined by pouring the samples in bulk in to a graduated cylinder. Tapped density was determined by placing a graduated cylinder containing a known mass of powder on a mechanical tapper apparatus (Electro lab tap density tester). Samples were tapped until no further reduction in volume of the sample was observed. Carr’s index is calculated using the formula,
Carr’s index = (tapped density – bulk density) / tapped density.
Sphericity of the microsphere
The sphericity of the prepared microspheres can be confirmed using a camera lucida by taking the tracings of the microspheres on a black paper. The tracings help to calculate the circulatory factor and confirm the sphericity of microspheres if the obtained values are nearer to 1.
To determine the sphericity, the tracings of Eudragit microspheres (magnification 45X) were taken on a black paper using camera lucida, (Model -Prism type, Rolex, India) and circulatory factor(S) was calculated as,
S = P2 12.56 x A
Scanning electron microscopy (SEM
)
SEM photographs were taken for the prepared microspheres with a scanning electron microscope, Joel- LV-5600, USA, at the required magnification in room temperature. The photographs were observed for morphological characteristics and to confirm the spherical nature of microspheres.
In vitro
release studies
In vitro release studies are useful for quality control as well as for the prediction of in vitroandin vivo correlation. Depending on the type of carrier, drug release from microspheres can take place through several processes. Dissolution studies were carried out for all the batches of the prepared formulations (6 batches), the details of which are given in Table 7. Dissolution tester apparatus, USP XXI (TDL O8L) was employed in the present study. The dissolution media of 900ml was maintained at 37 ºC ± 0.5 ºC and stirred at 100 rpm. Drug release from the formulations was determined by withdrawing 10 ml of samples using guarded pipette at 60 min interval for nine hours and then estimating them using UV Visible spectroscopy after appropriate dilution.
Stability studies
The stability of pharmaceutical preparation should be evaluated by stability studies. The objective of stability studies is to predict the shelf life of a product by accelerating the rate of decomposition, preferably
by increasing the temperature and % relative humidity (RH) conditions.
Eudragit microspheres weight equivalent to 100 mg of drug were packed individually in capsules kept in glass bottles and subjected to following protocol. The optimized formulation was subjected to stability studies by storing at 25ºC/60% RH, 30ºC/65% RH and 40ºC/75% RH for 90days. These samples were frequently checked and evaluated for changes in physical appearance and drug content.
Preparation of microspheres
Ranolazine is the model drug selected for the preparation of microspheres. It is soluble in acetone, methanol and dichloromethane, so the method mainly suitable for the microspheres preparation was solvent evaporation technique. The preparation method is represented in the figure no. 7
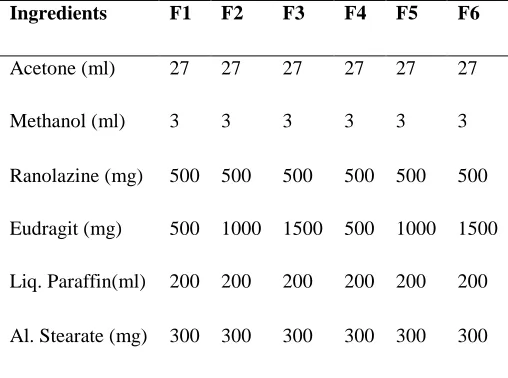
The acetone/liquid paraffin system for various formulations with different drug: polymer ratio was tried. Stirring speed was also adjusted accordingly to obtain good microspheres. Keeping the drug amount and the solvent volume constant and changing the polymer concentration, the microspheres were obtained in 1:1, 1:2, 1:3 ratios for both Eudragit L 100 and Eudragit L 100-55. Two grades of polymer of Eudragit were selected to optimize the drug release and for the consistency in preparation of microspheres formation. Formulation chart is presented in table no.2
Table no. 2: Formulation chart for the preparation of Ranolazine microspheres
Ingredients F1 F2 F3 F4 F5 F6
Acetone (ml) 27 27 27 27 27 27
Methanol (ml) 3 3 3 3 3 3
Ranolazine (mg) 500 500 500 500 500 500
Eudragit (mg) 500 1000 1500 500 1000 1500
Liq. Paraffin(ml) 200 200 200 200 200 200
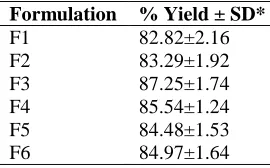
Yield of the process
During the process of microencapsulation, the mechanical variables cause loss of final product and hence process yield is not 100%. Microspheres were
weighed after drying and the percentage yield was calculated. The obtained data is shown in Table 3.
Table no.3: Percent Yield for Ranolazine loaded Eudragit microspheres
Formulation % Yield ± SD*
F1 82.82±2.16
F2 83.29±1.92
F3 87.25±1.74
F4 85.54±1.24
F5 84.48±1.53
F6 84.97±1.64
* Standard deviation, n = 3
Micromeritic properties
The flow property of the Eudragit microspheres was studied by calculating the angle of repose, θ and % compressibility index, I. The obtained data along with related parameters are presented in Table 10. The values of θ ranged from 25.56 to 29.24 indicating that the obtained values were well within the limits. This result clearly shows that the prepared microspheres
have reasonably good flow potential. The value of I, was found to be in the range of 10.22 to 13 %.
The values of tapped density ranged between 0.44 to 0.51 g/cm3. Density difference between the formulations is negligible and the density values of formulations were well within the limits, indicating that the prepared microspheres were non-aggregated and spherical in nature.
Table no. 4: Micromeritic properties of Ranolazine loaded Eudragit microspheres
Formulation
0
mean SD* I%
mean SD*
Tapped density gm/cm3 mean SD*
F1 25.56 ± 0.14 13.00 0.59 0.4958±0.016
F2 27.92 ± 0.19 10.22 0.39 0.4888±0.028
F3 27.47 ± 0.28 11.32 0.40 0.4423±0.034
F4 29.24 ± 0.46 12.48 0.57 0.4887±0.019
F5 28.81 ± 0.42 12.72 0.29 0.5138±0.013
F6 27.02 ± 0.16 13.87 0.37 0.4701±0.015
* Standard deviation, n = 3
Particle size determination
Particle size analysis is done by Malvern mastersizer 2000 at 37°C by sedimentation method. Particle size distribution is expressed as the number or weight of the particles lying within a certain size range. Prepared microspheres may have the same mean size, but they may differ in size distribution.
the stirring speed was slower than 500 rpm, the average size of the spheres was found to be large for all the prepared microspheres. In the present study,
sizes of the prepared microspheres were obtained at optimum stirring speed 700 rpm and particle size range is shown in figure 1.
Figure no. 1:FTIR of Ranolazine (pure drug)
Figure no.3: FTIR (F4) of Ranolazine L 100-55 microspheres
Differential scanning calorimetry (DSC)
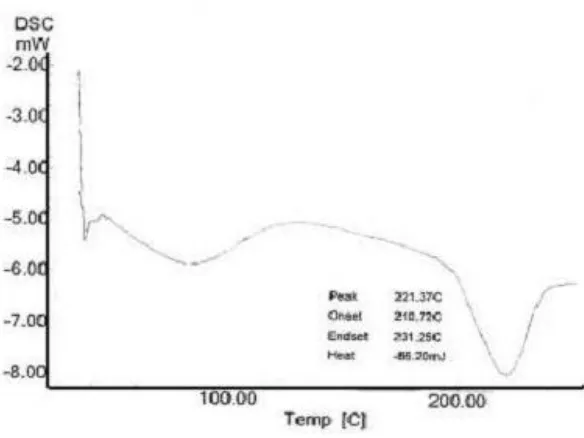
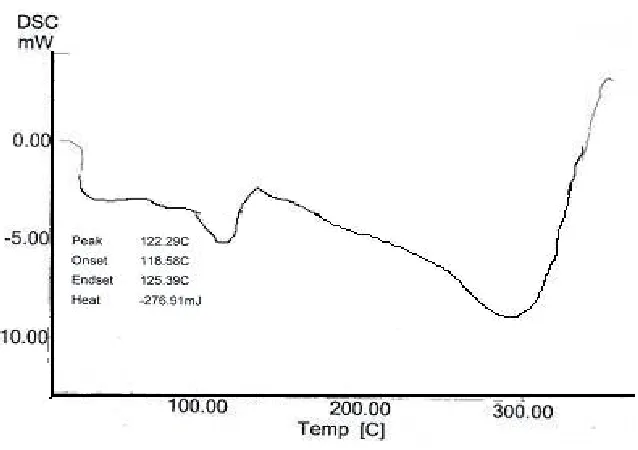
In order to investigate the possible interaction between the drug and polymers, differential scanning calorimetry (DSC) studies were carried out. DSC thermogram of the formulation was compared with the DSC thermogram of pure drug sample. About 70 mg of powdered sample was placed in a platinum crucible and the DSC thermograms were recorded from 25 °C to 300 °C
at a heating rate of 5 °C/min. Ranolazine exhibits a sharp endothermic peak at 122.06 °C. Absence of the sharp endothermic peak at 122.06 °C in the drug loaded microspheres indicated that, the drug is molecularly distributed in the microspheres29. The obtained DSC thermograms are reported in figures 4-6.
Figure no. 6: DSC of Ranolazine microspheres prepared by Eudragit L 100
Figure no. 7: DSC comparison of Ranolazine (pure drug) and formulation
SEM and sphericity
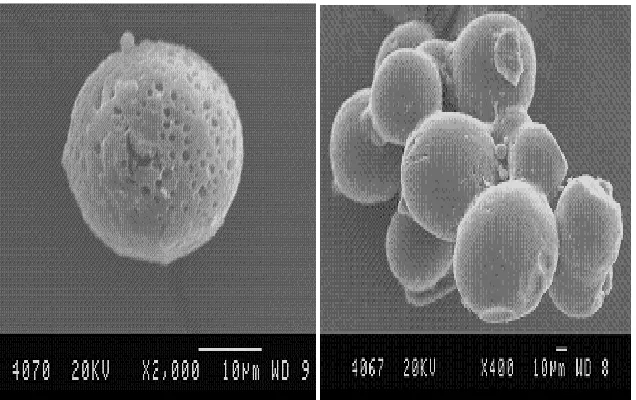
The scanning electron microscopy study (SEM) was done to identify and study the morphology of the prepared Eudragit microspheres and the obtained microphotographs are presented in Figures 8 and 9. The SEM photographs showed that the Eudragit microspheres were spherical in nature, having a smooth surface with inward dents and shrinkage due
Table no.5: Sphericity values obtained for Eudragit microspheres
Sl.No. F1
mean SD* F2
mean SD* F3
mean SD* F4
mean SD* F5
mean SD*
F6 mean SD*
1 1.00 0.4 1.04 0.7 1.00 0.4 1.03 0.4 1.01 0.1 1.07 0.8
2 1.03 0.2 1.03 0.5 1.00 0.6 1.01 0.7 1.01 0.5 1.04 0.5
3 1.01 0.4 1.01 0.8 1.01 0.5 1.01 0.6 1.01 0.8 1.05 0.3
4 1.04 0.5 1.01 0.4 1.01 0.7 1.00 0.3 1.00 0.7 1.00 0.4
5 1.00 0.9 1.01 0.3 1.00 0.2 1.03 0.9 1.01 0.2 1.01 0.7
6 1.03 0.2 1.00 0.2 1.01 0.1 1.01 0.8 1.03 0.4 1.03 0.3
7 1.01 0.4 1.00 0.6 1.01 0.6 1.01 0.7 1.00 0.9 1.03 0.4
8 1.00 0.8 1.03 0.7 1.00 0.5 1.00 0.5 1.01 0.7 1.02 0.9
9 1.02 0.6 1.00 0.5 1.00 0.7 1.00 0.3 1.02 0.2 1.01 0.2
10 1.01 0.7 1.00 0.2 1.00 0.3 1.01 0.4 1.00 0.5 1.01 0.5
* Standard deviation, n = 3
Drug loading
The test for drug content was carried out to ascertain that the drug is uniformly loaded in the formulation. 100 mg of the drug containing microspheres were taken in 100 ml volumetric flask containing 7.4 pH buffer solution and shaken for 45 min and kept for overnight for total extraction of drug
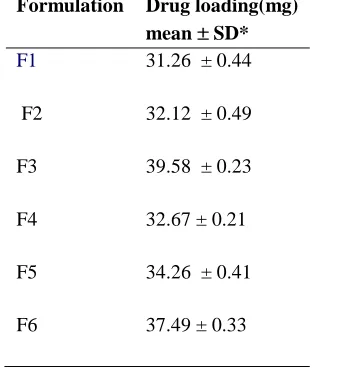
from microspheres, then filtered through Whatmann No.1 filter paper. The amount of Ranolazine present in the buffer solution was determined spectrophotometrically at 272 nm. The percent of drug loading in the formulations was found to be in the range of 31.26 % to 39.58 %. The results obtained are given in Table 6 and figure 10.
Table no. 6: Drug loading of prepared Eudragit microspheres Formulation Drug loading(mg)
mean SD*
F1 31.26 ± 0.44
F2 32.12 ± 0.49
F3 39.58 ± 0.23
F4 32.67 ± 0.21
F5 34.26 ± 0.41
F6 37.49 ± 0.33
*Standard deviation, n = 3
Figure no. 10: Graph showing drug loading profile
Encapsulation efficiency of the microspheres
The Ranolazine microspheres in powdered form were obtained by mechanical stirring process. A known amount of weighed microsphere (100 mg) were washed with n-hexane and the surfactant
aluminum stearate and the nonencapsulated drug had been removed, following repeated stirring at 400 rpm and continuous washing with n-hexane. The suspension was filtered through a membrane filter to remove the polymer; total amount of drug present in n-hexane is assessed by properly diluting it with the
0 5 10 15 20 25 30 35 40
% d
ru
g l
oad
in
g
F1 F2 F3 F4 F5 F6
mobile phase to be analyzed by UV as described below. The percentage of drug in n-hexane is the total free amount of drug. The encapsulation efficiency was found to be in a range of 90.07 % to 97.83 %. The percentage of drug entrapped in the Eudragit microspheres is represented by following Equation and shown in table 7 and figure 11.
Table no. 7: Encapsulation efficiency of prepared microspheres
Formulation Encapsulation efficiency (%) mean SD*
F1 92.62 1.15
F2 93.28 1.16
F3 97.83 0.38
F4 90.07 1.26
F5 92.18 1.19
F6 96.74 1.21
Figure no. 11: Graph showing encapsulation efficiency of Eudragit microspheres
In-vitro
drug release
Dissolution studies were carried out at pH 1.2 HCl buffer for 2 hrs followed by 7 hrs in pH 7.4 phosphate buffer using USP XXI dissolution apparatus type II(basket type). Dissolution media having volume of
basket for the drug release. The cotton cloth is used for preventing the loss of microspheres from the basket during the drug release and during changing the media from pH 1.2 HCl buffer to pH 7.4 phosphate buffer solution. During the drug release the shape of microspheres changes and it becomes 0
10 20 30 40 50 60 70 80 90 100
%
e
n
c
a
p
su
la
ti
o
n
F1 F2 F3 F4 F5 F6
Formulations
that the hydrophobic nature of drug will not help in continuing the release of drug from microspheres after 9th hr. Dissolution rate-time data for different formulations of Eudragit L100 and L100-55 microspheres are given in Table 16 and shown graphically in Figure 12.
From the release studies it was observed that, there is no significant release of drug in gastric pH from Eudragit microspheres and this indicates that the used pH dependent binder was gastro resistant in nature. Drug was released in a biphasic manner consisting of initial fast release stage followed by a slow release in intestinal pH from microspheres. At the end of 9thhr, drug release for the prepared formulations ranged from 61.73 % to 75.69 %. The in vitro drug release was considerably more in the case of L 100-55 as compared to L100 Eudragit microspheres. Formulation F1 to F3 represents 1:1, 1:2 & 1:3 drug: polymer ratios of Eudragit L100 and, formulation F4 to F6 represents 1:1, 1:2 & 1:3 drug: polymer ratios of Eudragit L 100-55. The drug release of L100 was from 61.73 to 74.94 and that of L100-55 was from 65.89 to 75.69. The drug release shows that the increase in polymer ratio retards the drug release in both type of Eudragit polymer.
Initial drug release from Eudragit microspheres at intestinal environment by biphasic manner and associated with an initial burst release of 21.27 % to 74.94 %, 10.19 % to 67.57 %, 8.35 % to 61.53 %, 27.92 % to 75.69 %, 31.32 % to 72.37 % and 37.48 % to 65.89 % drug from F1, F2, F3, F4, F5 and F6 microspheres respectively. The burst release in intestinal pH might be due to the release of surface accumulated drug. After initial burst effect, the subsequent release of drug was slow and sustained.
F1 formulation can be supposed to be the optimized formulation. This optimization can be attributed to good percent release of drug at end of 9th hour. Also F1 formulation has shown a good consistency in shape, sphericity and uniformity in the preparation of microspheres.
From the release kinetic studies obtained by mathematical model fitting it can be concluded that the drug release from Eudragit microspheres is diffusion controlled. Higuchi plotting of the cumulative drug release shows that the drug release is linear in nature. Peppas is the best fit model in most of the Eudragit microspheres formulation.42
Figure no. 12: Dissolution rate time profiles of Eudragit microspheres of Ranolazine
In-virto release profile
0 10 20 30 40 50 60 70 80
0 2 4 6 8 10
Time (hour)
%
R
e
le
a
se
F1
F2
F3
F4
F5
Mathematical model fitting of obtained drug
release data
The in vitro release studies data was fitted into various mathematical models to determine which one is the best-fit model. The results indicated that, the best-fit models were found to be Higuchi and Peppas models. Graph between amount of drug release in mg and square root of time was plotted known as Higuchi plot is shown in figure 13.
Higuchi plot
The amount of drug released versus square root of time was plotted. The plot should be linear if the release of drug from the delivery system is diffusion controlled.
The plots were linear and the results inferred that drug release from the microspheres delivery system was by diffusion.
The data are reported in Table 19 and the graph shown in Figure 14.
Peppas
equation
Mt/M∞ = 1- A (exp-Kt)
Log (1 - Mt/M∞) = log A – kt/2.303 Mt – Amount of drugs released at time t
M∞ - Total amount of drug loaded
K – Diffusion constant
Peppas plot data is tabulated in table 20.
According to values of K (diffusion constant), the model of system can be identified by following values,
K ≤ 0.45 – It follows Fickian (diffusion release). 0.45≤ K ≤ 0.89 – It follows anomalous non-fickian transport.
K = 0.89 – Zero order (case П). K > 0.89 – Super case П transport.
Table no. 8:Data of various parameters of model fitting of Ranolazine Eudragit microspheres formulations F1, F2 & F3
Model fitting Formulation code
F1 F2 F3
R K R K R K
Zero 0.9842 7.0551 0.9837 6.4514 0.9356 6.4769
First 0.9630 -0.1011 0.9665 -0.0888 0.9442 -0.0875
Matrix 0.8950 17.266 0.8828 15.712 0.8588 15.867
Peppas 0.9741 5.7172 0.9841 4.0109 0.9582 4.0109
Hixson 0.9724 -0.0297 0.9736 -0.0265 0.9416 -0.0265
Best fit model First order Peppas order Peppas order
Table no. 9: Data of various parameters of model fitting of Ranolazine Eudragit microspheres formulations F4, F5 & F6
Model fitting Formulation code
F4 F5 F6
R K R K R K
Zero 0.9340 4.0285 0.9065 4.3458 0.9151 4.2255
First 0.9917 -0.0461 0.9599 -0.0505 0.9901 -0.0487
Matrix 0.9594 9.6975 0.9212 10.4585 0.9440 10.2027
Peppas 0.9980 8.8167 0.9913 9.1018 0.9970 9.2566
Table no. 10: Higuchi plot data of formulations
Time in hrs √ time
Cumulative drug release in mg
F1 F2 F3 F4 F5 F6
1 1 10.82 9.92 2.70 7.74 11.52 10.08
2 1.14 35.22 13.54 6.30 13.76 15.14 14.32
3 1.73 42.54 20.38 16.70 55.84 62.64 47.96
4 2 44.60 44.44 67.64 74.52 80.26 85.46
5 2.23 74.52 75.58 97.72 95.91 100.04 94.30
6 2.44 104.64 95.98 106.32 113.68 118.68 104.30
7 2.64 124.12 117.62 111.44 128.78 131.22 115.34
8 2.82 143.71 127.62 113.84 143.38 135.22 123.61
9 3.0 149.88 135.14 123.46 151.38 144.74 131.78
Figure no. 14: Higuchi plot graph of formulation
Peppas model fitting
The data obtained from in vitro release studies was fit into Peppas model. The various parameters the
intercept, A, the release constant K and regression coefficient, R2 obtained are given in Table 11 and the graph of Peppas model is shown in figure 16.
Table no. 11: Data obtained for Peppas model fitting
Formulation Parameters
-20 0 20 40 60 80 100 120 140 160
0 1 2 3 4
Square root of time
C
u
m
u
la
ti
v
e
a
m
o
u
n
t
o
f
d
r
u
g
r
e
le
a
se
i
n
mg
F1
F2
F3
F4
F5
F6
Linear (F1)
Linear (F2)
Linear (F3)
Linear (F4)
Linear (F5)
K A R2
F1 -0.0325 0.191 0.970
F2 -0.0347 0.222 0.996
F3 -0.0429 0.153 0.947
F4 -0.0371 0.143 0.998
F5 -0.0320 0.045 0.991
F6 -0.0187 0.069 0.997
Figure no. 15: Peppas model graph of formulations
In all the cases the value of intercept, A were found to be less that 0.5. This indicates that the release of drug from all the formulations was found to be by fickian diffusion.
Stability studies
The objective of stability studies is to predict the shelf life of a product by accelerating the rate of decomposition, preferably by increasing the temperature and RH. The optimized formulation (F3)
was subjected to stability studies according to ICH guidelines by storing at 25 ºC/60% RH, 30 ºC/65% RH and 40 ºC/75% RH for 90days. These samples were analyzed and checked for changes in physical appearance and drug content at regular intervals28. The obtained data is presented in Table no.12from the table, it is clear that the formulation did not undergo any chemical changes/interaction during the study period.
Table no. 12:Stability study for drug content of formulation F1
Stability condition Sampling (in days) Drug content (in mg)
Mean SD*
25 ºC/60% RH
15 98.46 1.10
45 97.62 1.12
90 97.18 0.86
0 0.2 0.4 0.6 0.8 1 1.2 1.4 1.6 1.8 2
0 0.2 0.4 0.6 0.8 1
Log t
Log mt/
m
∞ F1F2
F3 F4 F5 F6
30 ºC/65% RH 45 97.98 1.18
90 96.51 1.06
40 ºC/75% RH
15 98.66 0.82
45 98.11 1.46
90 97.90 1.56
* Standard Deviation, n=3
DISCUSSION
Increase in the drug: polymer ratio affects the sphericity and release of drug. 1:1 ratio gives good percent release of drug in both the grades of Eudragit compared to other types of ratio. The release studied is mentioned in the table no.7.
Aluminum stearate was added as deflocculating agent to the formulations, as they stabilize the droplet coalescence during solvent evaporation method. An attempt was made to incorporate drug in the Eudragit microspheres without the addition of deflocculating agent, but the process failed and resulted in formation of aggregate cake like mass during the solidification of Eudragit microspheres. It may be due to repulsion resulting from high interfacial tension between the hydrophobic liquid paraffin material and internal aqueous phase of acetone and methanol.
In the present study, it was found that internal phase having 27 ml of acetone and 3ml of methanol was suitable for producing the microspheres. The drug and deflocculating were mixed to the above mixture solution of acetone and methanol. Then the solution is stirred continuously to prepare a transparent emulsion. The internal phase having drug polymer mixture maintained at 15°C is poured at once to external phase of liquid paraffin previously cooled at similar temperature of 15°C and with constant stirring at 700 rpm for 4 hr at constant temperature of 40°C the small droplets of Eudragit microspheres start appearing in the solution. Resultant microspheres did not have any surface irregularities and were non-aggregated. As the volume of external phase increased, the yield was reduced and the resultant microspheres were irregularly shaped. When the volume of the internal phase was less than 27 ml, the resultant microspheres were highly aggregated in nature and difficult to distinguish as individual microspheres. In order to avoid the formation of irregularly shaped larger particles, 27 ml of internal
phase was used. With same stirring speed of 500rpm at 40°C for almost 4 hr yielded good Ranolazine microspheres.
Another important factor which influenced the microspheres was the stirring speed. With an increase in the stirring speed from 500 to 700 rpm, reduction in the average size of the microspheres was observed. When the stirring speed was lower than 500 rpm, it leads to the formation of pellets. Microspheres prepared at different stirring speed (500 – 900 rpm) were selected and their size was measured. The sphericity of microspheres was evaluated. Here 1:1 and 1:3 ratios are selected from both the grades of Eudragit respectively. SEM photographs of the formulations are shown in figure 9 & 10.
The other factor influenced the percentage yield was the stirring time used for the preparation of microspheres. Stirring time of almost 4 hr was used to prepare the microspheres. An optimum stirring time of 3 hr produced a good yield of microspheres. An increase in stirring time from 4 to 5 hr resulted in decrease yield and sometimes breaking of microspheres. It was observed that the recovery of the microspheres was lower and the sphere size was smaller, because more amount of smaller microspheres were lost during successive washings. When the stirring time was less than 3 hr, the recovery yield also was reduced. Lesser stirring time produces larger pellets and some amounts of Eudragit materials adhered to the sides of the beaker walls during the cooling process, resulted in lower recovery of microspheres.
REFERENCES
[1]. SahooS. K, MallickA.A, BarikB.B, SenapatiPC.Formulation and evaluation of eudragit microspheres of Stavudine Topical J of Pharm research June 2005; 4(1): 369-375.
[2]. Kristmundsdottir.T, GudmundssonO.S, IngvarsdottirK. Release of Diltiazem from eudragit microparticles prepared by spray drying, Int J of Pharm 137 (2000) 159-165.
[3]. TatjanaMateovic-Rojnic, FrlanR, BogatajM, Peter Bukovec, Mrhar. A, Effect of preparation temperature in solvent evaporation process on eudragit RS microspheres properties, Chem Pharm Bull 2005; 53(1): 143-146. [4]. Choudhary K.P.R, koteswara Rao N, Malathi K, Ethyl cellulose microcapsule of glipizide: characterization,
in-vitro and in-vivo evaluation. Ind J of Pharm sci 2004; 66(4): 412-416.
[5]. Badri V N, Thomas P.A, Pnadit J.K, Kulakarnio M.G, Mashelker R.A, Preparation of non porous microspheres with high entrapment of proteins by a (water-in-oil)-in-oil emulsion technique. J of Cont rel. 1999; 58:9-20. .
[6]. Anderson, Joe R,Nawarskas, James J.Ranolazine: A Metabolic Modulator for the Treatment of Chronic Stable Angina. Cardiology in Review.July/August2005; 13(4): 202-210.
[7]. StenlyW C, Ranolazine: new approach for the treatment of stable angina pectoris. Expert review of cardiovascular therapy. Sep 2005; 3(5): 821-829.
[8]. Kondo A. Air suspension coating process.In Microcapsule processing and Technology. Wade Van Valkenburg J. (ed), New York: Marcel Dekker; 1979:142-145.
[9]. O’DonnellP. B and. McGinityJ W. Preparation of microspheres by solvent evaporation technique. Advances in drug delivery system.28 (1997) 25-42
[10]. Dan Li. Microencapsulation of protein with Eudragit S 100 polymer. American J of pharmacy. 1995: 1-78. [11]. SeitzJ.A, Mehta S.PandVeager. The Theory and Practice of Industrial Pharmacy, 3rd ed. Philadelphia: Lea
&Febiger; 1986:346.
[12]. Appelgren C, Eskilson C. Novel method for the granulation and coating of pharmacologically active substances. DrugDevIndPharm 1990;16(15):2345-2351.
[13]. Thies C. Microencapsulation. Encyclopedia of Polymer Science and Engineering. New York: John Wiley & Sons; 1987:724-745.
[14]. KibbeAH. Handbook of Pharmaceutical Excipients, 3rd ed. American Pharmaceutical Association and the Pharmaceutical Society of Great Britain, London; 2000:392.
[15]. Burgess. D.J, Hickey. A.J. Microspheres technology and applications. Encyclopedia of Pharma Tech, New York: Marcel Dekker; 1995:1-29.
[16]. Specifications of ranolazine, drug bank Ranolazine APRD01300.
[17]. CostaP, Jose Manuel S.L. Modeling and comparision of dissolution profiles. Eur. J. Pharm. Sciences. 13 (2001) 123-133.