1
Abstract— In the present study, genetic programming (GP) as a completely different approach in comparison with conventional methods, based on the imitation of natural evolution of living organism is proposed for the prediction of cellulose acetate (CA) polymeric membrane characteristics. The membrane preparation parameters of polymer concentration, additive concentration and coagulation bath temperature (CBT) were considered as model input parameters. GP model was developed to predict the pure water permeate flux of CA membranes based on the experimental data of a membrane pilot-scale system. Some statistical parameters were considered and calculated to investigate the reliability and accuracy of the proposed model. The model excellent general performance with R2=0.98 and the low error values confirmed the accuracy of the model. According to the results, GP has displayed the potential to be used as a reliable tool for identifying the characteristics of CA membranes.
Keywords: cellulose acetate, genetic programming, membrane preparation, modeling
I.INTRODUCTION
embrane separation processes present a number of important advantages such as low energy consumption, compact equipment, and less environmental impacts and capital investments. Thus, membranes have obtained an important place in chemical industries and have been used in a wide range of applications. Removal or recovery of toxic or valuable components, such as organic solvents and acids, from various industrial effluents; the production of high-quality water; and applications in the pharmaceutical and food industries are some examples of membrane technology applications in the chemical industries [1-4].
Among various membrane materials, polymers are the most widely used materials for membrane preparation owing to their proper mechanical properties, intrinsic transport property, flexibility in being formed into different shapes, and low cost [5]. Among different polymeric materials, cellulose acetate (CA) presents promising characteristics such as good toughness, noticeable biocompatibility, good desalting, low cost, and high potential flux. Thus it has been widely used in various membrane separation processes such as gas separation (GS), hemodialysis, reverse osmosis (RO), ultrafiltration
E. Saljoughi is with the Chemical Engineering Department, Faculty of Engineering, Ferdowsi University of Mashhad, Mashhad, Iran. Correspondence should be addressed to E. Saljoughi (e-mail:
(UF), and microfiltration (MF). Moreover, hydrophilic characteristic of CA membranes reduces fouling during a separation process [6-9].
There are different ways for the preparation of porous polymeric membranes including sintering, stretching, track etching, solution casting, and phase inversion [10]. Among these methods, phase inversion is the most extensively used technique for the preparation of asymmetric membranes. In this process, a homogeneous solution, which contains polymer, solvent and suitable additives, is cast onto a suitable support by using a casting knife, and then the support is immersed into a coagulation bath which commonly contains distilled water as a non-solvent. Subsequently, phase inversion occurs by exchange of solvent and non-solvent across the interface between the casting solution and the coagulation bath [11].
For a successful implementation of the membrane separation process it is necessary to obtain some information about the characteristics of a given membrane. On this basis, membrane preparation modeling based on fabrication parameters plays an important role in the characterization of a polymeric membrane and provides useful information about it. Mathematical models are usually complicated and do not provide sufficient information about the physical phenomena taking place. Moreover, such models are typically valid for specific conditions [12,13].
Artificial neural network (ANN) has shown the ability to model highly complex and non-linear systems without requiring detailed information about the physical parameters of the system. Madaeni et al. [14] and Tan et al. [15] successfully implemented ANNs to predict membrane characteristics and investigated the effects of different preparation parameters. Although ANNs have demonstrated to be an effective predictive tool for modeling of non-linear systems, its output for a specific system usually cannot be extended and used for other systems due to the specific ANN model structure and the dependence of the model to the initial assumptions of the parameters [16].
Therefore, alternative methods for predicting the characteristics of polymeric membranes by using available preparation data and extending it to a mathematical model, which can be applied simply on unavailable data, are so worthwhile. Genetic programming (GP), a branch of soft computing, is such a tool that can be widely used in various problems [17,18].
Because of the high degree of complexity and the high number of parameters that should be considered in prediction of membrane characteristics related to
M
Application of Genetic Programming as a Powerful Tool
for Modeling of Cellulose Acetate Membrane Preparation
fabrication parameters, it seems that GP is a potential tool for reliable and accurate prediction of membrane characteristics, including CA membranes. This paper utilizes GP as a novel way to develop a mathematical model for CA membrane characteristics in terms of pure water permeate flux as a function of CA and the additive (polyethylene glycol) concentrations and coagulation bath temperature (CBT), based on the experimental preparation parameters. The goal is to exploit GP flexible tree structure to build a prediction model for characterizing CA polymeric membranes.
II.OVERVIEW OF GENETIC PROGRAMMING
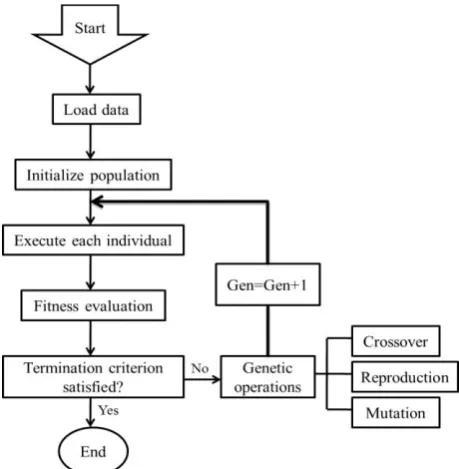
Genetic algorithm (GA) is an optimization technique based on the principles of genetics and natural selection [19]. This technique allows a population composed of many individuals to evolve under specified selection rules to minimize the cost function. GP is an extension to conventional GA proposed by Koza [20] to solve a given problem by automatically generating algorithms and expressions on the basis of natural evolution. Unlike GA which uses a string of numbers to represent the solution, GP automatically creates several computer programs with a parse tree structure to solve the problem at hand. These programs are coded as a tree structure with its nodes (functions) and terminals (leaves) [20]. The chosen function set is {+, -, *, /, sin, cos, exp, log, abs}. The function set may also include other mathematical functions, conditional operators or any user-defined operators [21]. The chosen terminal set contains the independent variable X or an integer. The GP model is explicit and free from conceptual designs, thus it has few requirements about the domain knowledge of the problem and is therefore less problem-dependent [22,23]. The main advantage of GP is that it does not require any priority knowledge about the relations among parameters and their interactions. Fig. 1 shows a brief flowchart of GP. As experimental data, input parameters, introduced to the program, the GP starts to random creation of the initial GP model populations and evaluates their fitness value quantifying how well the created models solve the problem. New generations of programs are iteratively created by selecting parents based on their fitness and breeding them via genetic operators including crossover, mutation and reproduction. Genetic operators introduce variability in the individuals and make evolution possible, which may produce better individuals in posterior generations. The crossover operator exchanges sub-trees from a pair of individuals, generating two offspring. The mutation operator replaces a randomly chosen sub-tree from an individual by a new sub-tree randomly generated. The reproduction operator simply copies individuals and inserts them in the next generation.
Because of selecting better individuals and passing their best characteristics to their offspring, the population tends to improve in quality along successive generations. This evolutionary process continues until a termination criterion, e.g. satisfactory fitness or maximum number of
generation, is verified. At last, the best-so-far individual is designated as the output of the GP operation.
Fig. 1. Schematic flowchart of genetic programming (GP) procedure.
III.EXPERIMENTAL
A. Materials
CA with an average molecular weight of 52,000 g mol–1 was purchased from Fluka for the preparation of CA polymeric membrane. 1-Methyl-2-pyrrolidone (NMP) with analytical purity of 99.5% (Merck) and distilled water were used as solvent and non-solvent agents, respectively. Polyethylene glycol (PEG) with an average molecular weight of 400 g mol–1 was obtained from Loba Chemie Ltd and used as an additive.
B. Membrane Preparation
Various CA/PEG/NMP polymeric solutions were prepared with different CA concentrations ranging from 13.5 wt% to 17.5 wt% and PEG concentrations ranging from 0 wt% to 10 wt% at a coagulation bath temperature (CBT) of 0 and 25°C. The details of the experimental procedure are provided in our previous work [4]. In brief, PEG was added to the homogeneous solution of CA in NMP, and was mixed by stirring for 12 h at room temperature. The prepared homogeneous solutions were cast using a film applicator with 180 µm clearance gap on a glass plate substrate. It was then moved to the distilled water coagulation bath for immersion precipitation. After primarily phase separation and membrane formation, the membrane was stored in water for 24 h to guarantee the complete phase separation. This allowed the water soluble components of the membrane to leach out.
C. Solution Viscosity Measurements
D. Scanning Electron Microscopy (SEM)
The membranes were snapped under liquid nitrogen to give a generally consistent and clean break. The membranes were then sputter coated with thin film of gold. The membranes were mounted on a brass plate using double-sided adhesion tape in a lateral position. Cross sectional images of the membranes were obtained using Cam Scan SEM Model MV2300 microscope.
E. Experimental Setup
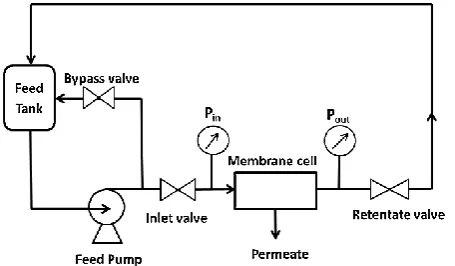
Permeation flux studies were carried out using a cross-flow filtration setup as shown schematically in Fig. 2. This apparatus consists of a UF disk module, a feed tank, a pump, pressure gauges installed on the feed and retentate pipes connected to the module, and some valves. Additionally, a bypass line was considered for the pump exit stream. A flat sheet membrane module made from stainless steel was used in all experiments. Effective filtration area of the membrane in the module was 24 cm2. Permeate water flux (PWF) experiments were done at a transmembrane pressure of 0.2 bar and their values were calculated using the following equation:
. Q Flux
A t
(1) where Q is the quantity of permeate (L), A is the effective membrane area (m2) and ∆t is the sampling time (h) [4, 24].
Fig. 2. Schematic diagram of the experimental set-up.
The experiments were carried out in batch mode in which both permeate and retentate were returned to feed reservoir to keep a constant concentration. The feed reservoir temperature was maintained at approximately 30°C.
IV.MODELING
The first population of mathematical models that simulated the investigated system in the first generation of GP was created randomly. Each model in the initial population consists of some nodes and terminals and represents a mathematical function. In this study, CA concentration, PEG concentration and CBT were
considered as independent variables and permeate water flux of CA membrane was considered as a function of them. Furthermore, 20% of the experimental data were used as test data for the evaluation of the performance of each model.
The search space of GP is virtually unlimited and programs tend to grow in size during the evolutionary process. Code growth is a healthy result of genetic operators in the search of better solutions, but it also permits the appearance of pieces of redundant codes that increase the size of the programs without improving their fitness; a phenomena known as bloating. Bloating can cause stagnation in the evolutionary process [25]. Bloating can be defined as an increase in the individual growth without improvement in their fitness. In order to prevent bloating, maximum depth of individuals was considered 16 and code growth by crossover and mutation operators was acceptable just if the fitness of an individual was improved.
Fitness function evaluates the sum of absolute difference between the expected output values and the value returned by the individuals. In the GP model development, input and output variables should be normalized first to match the unit levels of individual factors [23].
The evolutionary processes were controlled by evolutionary parameters of: population size 250, maximum number of generations to be run 50, probability of crossover 0.5, probability of mutation 0.4, probability of reproduction 0.1, maximum depth for initial random individuals 8, maximum depth of mutation fragment 8, and maximum permissible depth of individuals after crossover 16. The initial populations were generated with the Ramped Half-and-Half procedure [20]. Moreover, the maximum number of generations was considered as termination criteria in each run.
Some statistical parameters were obtained for better evaluation of the model. These statistical parameters are Normalized Bias (NB), Standard Square Error (SSE), Mean Square Error (MSE), Root Mean Square Error (RMSE), and R-square (R2) which are described in Eqs. (2)–(6). They were used for the fitness investigation and error determination of the model.
2 exp, mod ,
2 1
2 exp, mod , 1
2 mod , exp, 1
2 exp, mod , 1
( )
( )
( )
( )
n
i el mean
i n
i el mean
i
n
el i i
i n
i el mean
i
Y Y
R
Y Y
Y Y
Y Y
(2)
2
mod , exp,
1( )
n
el i i
i
SSE
Y Y (3)2 mod , exp,
1( )
n
el i i
i Y Y
MSE
n
2 mod , exp,
1( )
n
el i i
i Y Y
RMSE
n
(5)mod , exp, exp, 1
(
) /
n el i i i
i
Y
Y
Y
NB
n
(6)
where Yexp,i is the experimental value of permeate water flux, Ymodel,i is the value of permeate water flux predicted by the model, Ymodel,mean is the average value of the model permeate water flux prediction, and n is the number of experiments.
V.RESULTS AND DISCUSSION
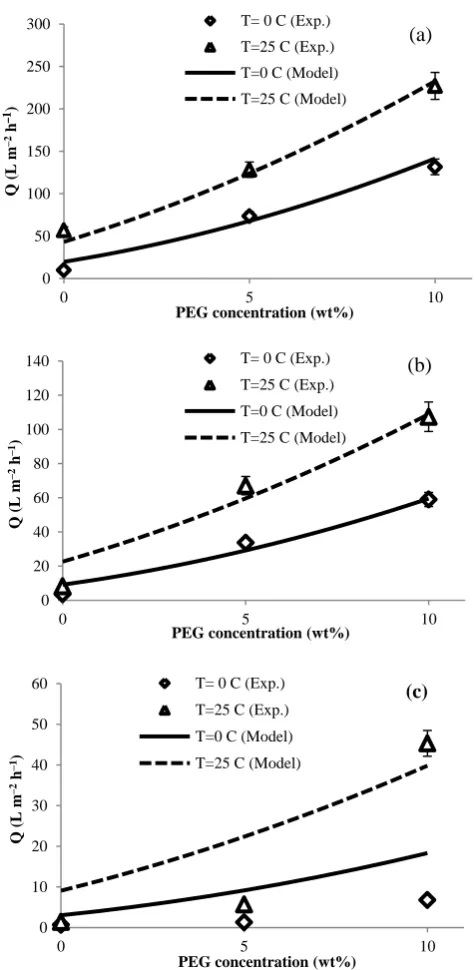
Some experiments were carried out in order to investigate the effect of CA concentration, PEG additive concentration, and coagulation bath temperature on the pure water permeation flux of the resultant CA membrane. The experimental results are shown in Fig. 3. As is observed,higher coagulation bath temperature causes more water permeation flux. This is more obvious in CA concentration of 13.5 wt%, where the water permeation flux is increased by more than two times via increasing the CBT from 0 to 25 °C. However, by increasing the CA concentration to 15.5 wt% and 17.5 wt%, this behavior becomes less significant. In all CA concentrations and CBTs, an increase in PEG concentration results in higher water permeation flux. In addition, at different levels of PEG concentration and CBT, the PWF (vertical axes in Fig. 3) tends to higher values regarding the membranes prepared from casting solutions containing less CA concentrations. Better presentation of above trend is observable in Table I. With respect to Fig. 3, in all CA levels, the flux is increased with increase in PEG concentration. This effect is more obvious in lower levels of CA.
TABLE I
EFFECT OF CACONCENTRATION ON THE PURE WATER FLUX (PWF) OF THE PREPARED MEMBRANES
CA concentration (wt%) CBT (°C) PWF* (L m–2 h–1)
13.5 0 72
25 137
15.5 0 32
25 61
17.5 0 3
25 17
*The average PWF of the membranes prepared from different PEG concentrations
Cross-sectional SEM images of the selected membranes presented in Fig. 4 confirm the above explanation regarding the effect of the polymer and PEG concentration as well as coagulation bath temperature on the water permeation flux of the prepared membranes. As is observed, an increase in CBT and PEG concentration along with a decrease in CA concentration result in the formation of membranes with higher porosity. It is evident
that the higher porosity of the prepared membranes reduces the resistance against water permeation flux [26].
Fig. 3. PWF as a function of CBT and PEG concentration at: a) CA=13.5 wt% , b) CA=15.5 wt% , and c) CA=17.5 wt%.
The CA and PEG concentrations along with the CBT were considered as independent variables to obtain a model for permeation flux of water by using GP. In the GP model development, input and output variables were normalized before running of the program by Eq. (7) in order to match the unit levels of individual factors. For simplicity, Xmin for all variables was set to zero. Indeed, its value hadn’t any effects on final results [23].
min max min
X X
X
Normalized X X
(7) 0
50 100 150 200 250 300
0 5 10
Q
(
L
m
–2 h
–
1)
PEG concentration (wt%)
T= 0 C (Exp.) T=25 C (Exp.) T=0 C (Model) T=25 C (Model)
(a)
0 20 40 60 80 100 120 140
0 5 10
Q
(
L
m
–2 h –1)
PEG concentration (wt%)
T= 0 C (Exp.) T=25 C (Exp.) T=0 C (Model) T=25 C (Model)
(b)
0 10 20 30 40 50 60
0 5 10
Q
(
L
m
–2 h –1)
PEG concentration (wt%)
T= 0 C (Exp.) T=25 C (Exp.) T=0 C (Model) T=25 C (Model)
80% of the available experimental data was used for developing of GP model and remaining was used for validation of the developed model.
The execution time of running the evolutionary algorithm for this case was approximately 18 min on a Dell server (Core i3, RAM 2GB, Windows Seven). Fig. 3 illustrates the prediction of water fluxes using genetic programming, and a comparison is done between experimental data and results obtained from the GP model. As it can be clearly seen, there is very good agreement between the model and the experimental results. In other words, the model predicts the system behaviors well. However, in CA concentration of 17.5 wt%, some deviations are observed between the experimental and GP model results. This can be attributed to and interpreted by the noticeable increase in viscosity. The viscosity of the polymeric solutions is presented in Table II. As is observed, only a 2 wt% increase in CA concentration from 15.5 wt% to 17.5 wt% results in a twofold increase in viscosity which noticeably affects the membrane formation mechanism in the coagulation bath. The noticeable increase in the viscosity of the cast film slows the diffusional exchange rate of the solvent (NMP) and nonsolvent (water) during the solidification process and consequently results in formation of a denser structure with less PWF [7]. In other words, the reduction of agreement between the model and the experimental results in the membranes prepared from polymeric solutions containing 17.5 wt% CA can be attributed to the effect of the solution high viscosity which noticeably affects membrane morphology and permeability.
The best-so-far GP model (model-1) that was obtained after satisfying termination criterion is:
2
2 1 1 3
2
1 2 2 2 3 2
6 1
cos cos sin sin 2
log cos cos sin sin
cos
Y X X X X
X X X X X X
X
(8)
where, Y, X1, X2, and X3 denote the normalized water permeation flux, the normalized CA concentration, the normalized coagulation bath temperature, and the normalized PEG concentration, respectively.
TABLE II
VISCOSITY OF CASTING SOLUTIONS solution composition
viscosity (cP) CA
(wt%)
NMP (wt%)
PEG (wt%)
15.5 84.5 0 37660
5 43366
10 51110
17.5 82.5 0 65049
5 81776
10 110083
Fig. 5 shows the fitness value, the node numbers, and the depth of the best-so-far individual in each generation. With respect to this figure, GP provides more accurate predictions by increasing the node numbers and depth, which result from an increase in the degree of freedom of the individuals.
Fig. 5. Plots of fitness value, depth and node numbers of the best-so-far individual vs. generation.
In order to investigate the reliability of the proposed model, some statistical parameters, Eqs. (2) – (6), which demonstrate the model performance in prediction of water permeation flux of the CA polymeric membranes, are presented in Table III.
TABLE III
VALUES OF THE STATISTICAL PARAMETERS OF THE GPMODEL statistical parameter value
R2 0.97807
SSE 2.62×10⁻²
MSE 1.46×10⁻³
RMSE 3.82×10⁻²
NB% 1.28695
The R-square (coefficient of fitting) value confirms that the GP model results are very well fitted to the experimental data. The values of standard square error, mean square error, and root mean square error in Table III indicate some insignificant errors of the model. With regard to NB value, the GP model slightly over predicts the water permeation flux.
All data presented in Table III confirm the accuracy of the proposed GP model for the prediction of pure water permeation flux of the CA membranes.
VI.
C
ONCLUSIONSIn this study, the ability of GP approach in estimation of CA membrane characteristics in terms of pure water permeation flux as a function of CA concentration, PEG concentration and CBT was investigated. An important benefit of GP modeling is that the model is explicit and does not require underlying description of the physical process. The proposed GP model is an empirical model based on the parameters that influence preparation of the CA membranes and consequently affect performance of the prepared membranes in a pilot-scale system.
The experimental data were used for model development and validation. The performance of the GP model was evaluated by comparing the predictions with the experimental results. The proposed model showed a very good general performance with strong correlation. GP displayed a promising tool for the prediction of CA polymeric membrane characteristics. This study is evidence for great potential of GP in obtaining models for complex and high non-linear approximation problems.
REFERENCES
[1] E. Shekarian, E. Saljoughi, and A. Naderi, “Polyacrylonitrile (PAN)/IGEPAL blend asymmetric membranes: Preparation, morphology and performance”, J. Polym. Res., vol. 20, no. 162, pp. 1-9, 2013.
[2] S. M. Mousavi, E. Saljoughi, and M. R. Sheikhi-Kouhsar, “Preparation and Characterization of Nanoporous Polysulfone Membranes with High Hydrophilic Property Using Variation in CBT and Addition of Tetronic-1107 Surfactant”, J. Appl. Polym. Sci., vol. 127, no. 5, pp. 4177–4185, 2013.
[3] H. Sardarabadi, S. M. Mousavi, and E. Saljoughi, “Removal of 2-propanol from water by pervaporation usingpoly(vinylidene fluoride) membrane filled with carbon black”, Appl. Surf. Sci., vol. 368, pp. 277–287, 2016.
[4] P. Shojaee-Nasirabadi, E. Saljoughi, and S. M. Mousavi, “Membrane Processes Used for Removal of Pharmaceuticals, Hormones, Endocrine Disruptors and Their Metabolites from Wastewaters: A Review”, Desal. Wat. Treat., [Online], 2016. Available:
http://www.tandfonline.com/doi/full/10.1080/19443994.2016.1140 081#abstract
[5] S. Kiani, S. M. Mousavi, N. Shahtahmassebi, and E. Saljoughi, “Hydrophilicity improvement in polyphenylsulfone nanofibrous filtration membranes through addition of polyethylene glycol”, Appl. Surf. Sci, vol. 359, pp. 252–258, 2015.
[6] A. Idris and L. K. Yet, “The effect of different molecular weight PEG additives on cellulose acetate asymmetric dialysis membrane performance”, J. Membr. Sci, vol. 280, pp. 920-927, 2006. [7] E. Saljoughi, M. Amirilargani, and T Mohammadi, “Cellulose
acetate asymmetric dialysis membranes: Synthesis, characterization and performance”, J. Appl. Polym. Sci, vol. 116, pp. 2251-2259, 2010.
[8] E. Saljoughi, M. Amirilargani, and T. Mohammadi, "Effect of Poly(vinyl pyrrolidone) Concentration andCoagulation Bath Temperature on the Morphology, Permeability, and Thermal Stability of Asymmetric Cellulose Acetate Membranes", J. Appl. Polym. Sci, vol. 111, pp. 2537–2544, 2009.
[9] E. Saljoughi, M. Sadrzadeh, and T. Mohammadi, "Effect of preparation variables on morphology and pure water permeation flux through asymmetric cellulose acetate membranes", J. Membr. Sci, vol. 326, pp. 627–634, 2009.
[10] R. W. Baker, Membrane Technology and Application, John Wiley & Sons, 2nd Edition, pp. 89-116, 2004.
[11] M. Amirilargani, E. Saljoughi, M. R. Moghbeli, and T. Mohammadi, “Effects of coagulation bath temperature and Polyvinylpyrrolidone content on flat sheet asymmetric polyethersulfone membranes”, Polym. Eng. Sci, vol. 50, pp. 885-893, 2010.
[12] M. A. Razavi, A. Mortazavi, and S. M. Mousavi, “Application of neural networks for cross flow milk ultrafiltration simulation”, Int. Dairy J. vol. 14, pp. 69-80, 2004.
[13] [13] H. Al-Zoubi, N. Hilal, N. A. Darwish, and A. W. Mohammad, “Rejection and modeling of sulphate and potassium salts by nanofiltration membranes: neural network and Spiegler–Kedem mode”l, Desalination, vol. 206, pp. 42-60, 2007.
[14] S. S. Madaeni, N. Tavajohi Hasankiadeh, A. R. Kurdian, and A. Rahimpour, “Modeling and optimization of membrane fabrication using artificial neural network and genetic algorithm”, Sep. Purif. Techol, vol. 76, pp. 33-43, 2010.
0 10 20 30 40 50 60
0 0.5 1 1.5 2 2.5 3 3.5
0 5 10 15 20 25 30 35 40 45 50
Depth
and
nod
e n
umb
er
s
Fi
tness
Value
Generation
[15] M. Tan, G. He, X. Li, Y. Liu, C. Dong, and J. Feng, “Prediction of the effects of preparation conditions on pervaporation performances of polydimethylsiloxane (PDMS)/ceramic composite membranes by backpropagation neural network and genetic algorithm”, Sep. Purif. Technol, vol. 89, pp. 142-146, 2012.
[16] A. Shahsavand and M. Pourafshari Chenar, “Neural networks modeling of hollow fiber membrane processes”, J. Membr. Sci, vol. 297, pp. 59-73, 2007.
[17] A. Fouladitajar, F. Zokaee Ashtiani, A. Okhovat, and B. Dabir, “Membrane fouling in microfiltration of oil-in-water emulsions; a comparison between constant pressure blocking laws and genetic programming (GP) model”, Desalination, vol. 329, pp. 41–49, 2013.
[18] H. Shokrkar, A. Salahib, N. Kasiri, and T. Mohammadi, “Prediction of permeation flux decline during MF of oily wastewater using genetic programming”, Chem. Eng. Res. Des, vol. 90, pp. 846–853, 2012.
[19] J. H. Holland, Adaptation in natural and artificial systems, The University of Michigan Press, 1975.
[20] [20] J. R. Koza, Genetic Programming: On the Programming of
Computers by Means of Natural Selection, MIT Press, Cambridge, 1992.
[21] S. Sette and L. Boullart, “Genetic programming: principles and applications”, Eng. Appl. Artif. Intel. Vol. 14, pp. 727-736, 2001. [22] Y. Yang and C. K. Soh, Automated optimum design of structures
using genetic programming, Comput. Struct, vol. 80, pp. 1537-1546, 2002.
[23] A. Okhovat and S. M. Mousavi, “Modeling of arsenic, chromium and cadmium removal by nanofiltration process using genetic programming”, Appl. Soft Comput, vol. 12, pp. 793-799, 2012. [24] M. Sivakumar, D. R. Mohan, and R. Rangarajan, “Studies on
cellulose acetate poly sulfone ultrafiltration membranes. II. Effect of additive concentration”, J. Membr. Sci, vol. 268, pp. 208-219, 2006.
[25] S. da Silva, “Controlling Bloat: Individual and Population Based Approaches in Genetic Programming”, Ph.D dissertation, University of Coimbra, USA, 2008.