DEMOGRAPHIC RESEARCH
VOLUME 29, ARTICLE 41, PAGES 1127-1152
PUBLISHED 5 DECEMBER 2013
http://www.demographic-research.org/Volumes/Vol29/41/ DOI: 10.4054/DemRes.2013.29.41
Research Article
Cause-specific measures of life years lost
Per Kragh Andersen
Vladimir Canudas-Romo
Niels Keiding
This publication is part of the Special Collection on “Multistate Event History Analysis,” organized by Guest Editors Frans Willekens and Hein Putter.
c
2013 Andersen, Canudas-Romo & Keiding.
2 A new definition of life years lost by cause of death 1131
3 Calculation of life years lost 1133
4 Comparison with other cause-specific measures of years lost 1136
5 An illustration: Danish and Russian national mortality data 1137
6 Discussion 1143
7 Acknowledgements 1144
References 1145
Cause-specific measures of life years lost
Per Kragh Andersen1
Vladimir Canudas-Romo2
Niels Keiding1
Abstract
BACKGROUND
A new measure of the number of life years lost due to specific causes of death is intro-duced.
METHODS
This measure is based on the cumulative incidence of death, it does not require “indepen-dence” of causes, and it satisfies simple balance equations: “total number of life years lost = sum of cause-specific life years lost”, and “total number of life years lost before agex
+ temporary life expectancy between birth and agex=x”.
RESULTS
The measure is contrasted to alternatives suggested in the demographic literature and all methods are illustrated using Danish and Russian multiple decrement life-tables.
1Department of Biostatistics, University of Copenhagen, Ø. Farimagsgade 5 PB2099, DK-1014 Copenhagen,
Denmark.
2Department of Biostatistics, University of Copenhagen, Ø. Farimagsgade 5 PB2099, DK-1014 Copenhagen,
1.
Introduction
Measures of life lost to specific causes of death have been discussed since the famous debate on smallpox between Bernoulli (1766) and d’Alembert (1761), chronicled several times, perhaps in greatest detail by Karn (1931, 1933) and Dietz and Heesterbeek (2002). The dominant assumption has been that removal of a cause of death may be modeled by equating the corresponding death intensity to zero in the relevant multiple decrement model. The effect of removal of a cause of death can thus be measured by comparing life expectancy with and without that cause operating. This view is still prevalent in demog-raphy, e.g. in the authoritative textbook by Preston, Heuveline, and Guillot (2001: Box 4.2), who as an example calculated that for U.S. females in 1991:
“... in the absence of neoplasms, life expectancy at birth would have been 82.46 years, a gain of 3.54 years relative to the life table with all causes present.”
However, there have been grave doubts about the relevance of the so-called indepen-dent competing risks model. Formally, indepenindepen-dent competing risks is defined as stochas-tic independence of latent cause-specific times to failure and it leads to a situation where the removal of one cause will leave the risk of dying from all other causes unchanged. Al-ready Makeham (1874) concluded his attractive, concise exposition of the discussion that:
“It will be observed that these solutions all proceed upon the assumption that the extermination of small pox does not affect the mortality arising from other causes. This must be proved before any reliance can be placed upon the conclusions arrived at. I give the investigation merely as an illustration of the comparative advantages of the different methods of solution.”
As formulated by Karn (1931):
A careful demographic discussion of multiple causes of death was given by Man-ton and Stallard (1984), who chose the laudable path of starting with a chapter on death certificates, so that the reader could not possibly be ignorant of the tenuous nature of classification of causes of death. Manton and Stallard basically presented the classical ‘cause-deletion’ approach but made the independence assumption very explicit and sug-gested various elaborations of the underlying multi-state model to reduce the assumptions to various forms ofconditionalindependence. Preston, Heuveline, and Guillot (2001: pp. 78-79) took the following problematic viewpoint:
“Equation (4.4) says that the probability of remaining in the defined state betweenxandx+nwhen many causes are operating ... is the product of each of the probabilities of remaining in that state if individual decrements were acting alone. (...) This multiplicative property pertains only when the outcomes ... are statistically independent: when one outcome does not de-pend on the others. Clearly, the assumption of indede-pendence ... entered at the point where we defined members of the set of decrements to be mutually exclusive and exhaustive. That is, the process of assignment of a cause to each particular decrement created a set of wholly separate and ‘independent’ entities. That these statistical entities are independent - admit no overlap or combinations or synergistic relations - does not mean that the underlying pro-cesses that they represent are independent. For example, it is very likely that an increase in the incidence of influenza in a population will raise death rates from certain cardiovascular diseases as well as from influenza. But whatever this synergistic relation among disease processes, the data will always come to the analyst in a set of cause-of-death assignments in which influenza and cardiovascular diseases are tidily separated; equation (4.4) will continue to hold.”
In our view the independent competing risks model precisely assumes ‘that the un-derlying processes that they represent are independent’. It is not enough that the risk categories ‘come to the analyst as mutually exclusive and exhaustive’.
epidemiol-ogy, particularly through the influence of Prentice and Kalbfleisch in their important paper (Prentice et al. 1978) and book (Kalbfleisch and Prentice 1980), in which they seem (pp. 168-169) to have introduced the termcumulative incidence. A later influential paper is by Benichou and Gail (1990).
One basic argument for focusing attention on the cumulative incidence is that it is an observable quantity in this world without counterfactual assumptions. Another is that it satisfies a simple balance equation, as seen below.
It should be mentioned that the cumulative incidence has been a well-integrated com-ponent also of demographic multiple decrement methodology for a long time. Thus the multiple decrement table in Box 4.1 of the above mentioned text by Preston, Heuveline, and Guillot (2001) contains a column`i
x describing how those who will ultimately die
from causei(neoplasms) will die out, the cumulative incidence being1−`i
x/`i0. Inter-estingly, Farr (1841) already had similar columns in his ‘nosometrical table’ describing the fate of a synthetic cohort of ‘lunatics’ according to time since admission into an asy-lum, the two competing events being death in the asylum and discharge from the asylum. Farr’s calculation was in principle the same as that of today.
Demographers frequently apply methods for decomposing change in life expectancy over time and corresponding life years lost to account for the age and cause of death contribution. Methods to calculate such contributions have been developed by a United Nations (1982) report, Pollard (1982, 1988), Arriaga (1984), Pressat (1985) and Andreev (1982), see also Andreev et al. (2002), who focused on the difference in life expectancy between two periods of time. Keyfitz (1977, 1985) considered continuous change and derived a formula that relates the time-derivative of life expectancy to the entropy of life table survivorship, although not as a general method of decomposition. More recently, efforts have also been taken to calculate cause-decomposition considering continuous change (Vaupel and Canudas-Romo 2003, Beltran-Sanchez et al. 2008).
The purpose of the present paper is to propose a more descriptive concept of life years lost based only on the directly observable cumulative incidences and to compare this with some of the above-mentioned proposals in demography. A central property of the cumulative incidence is the simple balance equation
Prob.(still alive)+Prob.(have died of cause 1)+· · ·+Prob.(have died of causek) = 1,
which holds when there are in totalk mutually exclusive causes of death. From this a similar simple balance equation holds for the proposed measure of life years lost
In Section 2 the new definition of life years lost due to specific causes is discussed fol-lowing Andersen (2013), with computational details in Section 3 (and in the Appendix). Thus, Andersen (2013) introduced the quantity given in equation (3) below, discussed its mathematical properties in a biostatistical context, and showed how regression analysis targeting cause-specific years lost can be performed. The purpose of the present paper is to compare current methods from the demographic literature which are reviewed in Section 4 and all methods are illustrated in Section 5 using published life-tables from Denmark and Russia. A brief discussion is found in Section 6.
2.
A new definition of life years lost by cause of death
We consider the standard multiple decrement life-table as in Preston, Heuveline, and Guil-lot (2001: Section 4.3) and denote the mortality rate at ageabyµ(a). This is the sum of the cause-specific mortality ratesµi(a)for causesi= 1, . . . , k, which are assumed to be mutually exclusive and exhaustive:
µ(a) =X
i
µi(a).
The probability at birth of surviving past agexis then
xp0= exp(− Z x
0
µ(a)da),
and the life expectancy at birth is
ωe0= Z ω
0
ap0da,
whereω is the maximally attainable age. Thetemporary life expectancybetween birth and agexis
xe0= Z x
0
ap0da,
e.g., (Arriaga 1984). In biostatistics this quantity is known as therestricted mean life time, e.g., (Irwin 1949). The probability at birth of dying from causeibefore agex, that is the causeicumulative incidenceas introduced in Section 1, is
xqi0= Z x
0
and it follows that thebalance equation
xp0+ X
i
xq0i = 1 (1)
holds, since at agexevery member of the population is either alive or has died from one of thekcausesi= 1, . . . , k. Integrating equation (1) fromx= 0tox=awe get another balance equation,
ae0+ X
i
Z a
0
xqi0dx=a,
saying thata, the maximum number of life years at birth before agea, can be decomposed intoae0, the temporary life expectancy between birth and agea, plus the sum
aλ0= X
i
aλi0, (2)
where
aλi0= Z a
0
xq0idx. (3)
In this respectaλ0is the expected number oflife years lost before ageaand it was shown by Andersen (2013) that each termaλi0defined in equation (3) can be interpreted as the expected number of life years lost before ageadue to causei.
Thus, in summary we have shown that the total number of years,abetween birth and agea, can be written as the temporary life expectancy before age aplus the sum over causes of death,i, of the expected number of life years lost due to causeibefore agea:
a=ae0+ X
i
aλi0. (4)
Note that all quantities can be defined conditionally on survival untill agex. This is described in the Appendix. Also, note that there is an obvious age-decomposition of both the cumulative incidence, the temporary life expectancy, and the number of life years lost. This is because splitting the age interval froma0 = 0toam=ainto sub-intervals, say
[0, a1),[a1, a2), . . . ,[am−1, am), we have
aq0i =
m
X
j=1 Z aj
aj−1
xp0µi(x)dx, (5)
ae0=
m
X
j=1 Z aj
aj−1
and
aλi0=
m
X
j=1 Z aj
aj−1
xq0idx. (7)
This will be used when computing life-table based estimates for these quantities in Section 3.
3.
Calculation of life years lost
The temporary life expectancy and the number of life years lost can be estimated based on data collected in a multiple decrement life-table. To do this, consider a single age interval, say fromxtox+n. The data needed for the calculations include:
• `x, the fraction of survivors at agex, (so that we assume`0 = 1). This estimates
xp0.
• nLx, the average number of person-years lived between agesxandx+n. This
estimates the contribution Rx+n
x ap0dato the temporary life expectancy from the
interval, cf. equation (6).
• ndix, the fraction of deaths from cause iand the total fraction of deaths ndx =
P
i nd i
x between ages x and x + n. Thus, ndix estimates the contribution
Rx+n
x ap0µi(a)dato the cumulative incidence from the interval, cf. equation (5).
These values may have been calculated from raw counts of age- and cause-specific deaths and age-specific person-years at risk as described by Preston, Heuveline, and Guillot (2001: Ch. 3).
The average number of years,nLx, lived between agesxandx+ncan be represented
as the area under the survival curve; see Figure 1. Likewise, the average number of years lost in the age interval fromxtox+n, saynkx, is the area above the curve and, obviously,
nLx+nkx=n. (8)
Here,nkxestimates the contributionPiR x+n x aq
i
Figure 1: Life table survival curve,`x, and number of life years lost between agesxandx+n,
The person-years lived can be divided into contributions from those remaining alive during the interval (area 4 in Figure 1) and those who die (area 3), leading to
nLx=n`x+n+nAx·ndx (9)
wherenAx is the average number of person-years lived in the interval by those dying
in it (e.g., Preston, Heuveline, and Guillot (2001: Ch. 3), where it was denotednax).
Similarly, the years lost are composed of contributions from those who had died prior to agex(area 1) and from those who die in the interval (area 2):
nkx=n(1−`x) + (n−nAx)ndx.
To subdivide the lost years into contributions from each cause, the latter expression is modified, as follows:
nkix=n(1−`x)·xf0i+ (n−nAx)ndx·nRxi
wherexf0iis the life-table based estimate of the probability at birth of dying from causei before agex(that is, the cumulative incidence) andnRix= n
di x
0 toxis divided into sub-intervals[aj−1, aj), as described in Section 2, we have
xf0i= X
j njd
i aj−1,
wherenj =aj−aj−1is the width of intervalj= 1, . . . , m. Not all published life-tables include the quantitiesnAx, however, equation (9) may be solved fornAxand substituted
into the expression fornkixleading to
nkix=n(1−`x)·xf0i+ (n·`x−nLx)nRxi.
Note that both the quantitiesaλi0and their estimates based on the life-table data
1) are additive:aλ0=Pi aλi0andnkx=Pi nkix, and thereby do a “book keeping”
of where the years lost go in the population,
2) together with the temporary life expectancy add to the total number of life years:
ae0+aλ0=aandnLx+nkx=n, cf. equations (4) and (8).
Finally, the years lost contribution by age and cause of death can also be used to compare life expectancies between two populations. Life expectancy can be expressed as a function of the total number of years and number of years lost, for example for country
c1:
xec01 =x−xλc01
and then the difference between the life expectancies of two populations can be obtained by looking at their years lost as
xec01−xec02 =xλc02−xλc01.
We can now calculate both the age- and cause-contribution to the number of years lost by calculating those terms in each of the populations and then subtracting them. A similar strategy can be applied if the interest is to calculate the change over time in the number of years lost in one population. In that casec1andc2will correspond to the first and second time respectively.
4.
Comparison with other cause-specific measures of years lost
In this section we show two alternative methods which are related to the cause-specific measure of years lost introduced in Section 2. The first is the life expectancy decompo-sition suggested by Beltran-Sanchez et al. (2008) and the second is the average number of life-years lost as a result of death presented by Vaupel and Canudas-Romo (2003). To introduce the former, note that we can always write
xp0=xp10∗· · ·xpk∗0 ,
where
xpi∗0 = exp(− Z x
0
µi(a)da),
e.g., Preston, Heuveline, and Guillot (2001: Section 4.3). If causes are “independent” then, as mentioned in Section 1,xp−i∗0 =
Q
i06=i xpi 0∗
0 is thex-year survival probability at birth when causeiis eliminated andxe−i∗0 =
Rx 0 ap
−i∗
0 dathe corresponding temporary life expectancy. Another definition of cause-specific years lost is then
xλi∗0 =xe−i∗0 −xe0, (10) (Beltran-Sanchez et al. 2008).
This measure is 1) not additive 2) requires (as mentioned in Section 1) “independence” of causes, i.e., it refers to a hypothetical population where causeiis no longer operating and where (by independence) the mortality rates from causesi0 6= iare still given by
µi0(a). Note that the question of what would happen if certain causes were eliminated is
not addressed viaaλi0for which all computations are performed in “this world” where all causes operate.
A final definition of years lost is
xλ†0= Z x
0
(x−a)ea·ap0µ(a)da
(see Vaupel and Canudas-Romo (2003) who called ite†). This is the average temporary life expectancy between age at death and agexand in the language of Gardner and San-born (1990) it is a measure of “years of potential life lost”. It leads to a third measure of cause-specific years lost
xλi†0 = Rx
0 (x−a)ea·ap0µ
i(a)da
where the average temporary life expectancy at death is only taken among those who die from causeibefore agex. This measure
1) is not additive
2) does not require “independence”.
However, redefiningxλi†0 without division byxq0i, that is, as
xλi†0 = Z x
0
(x−a)ea·ap0µi(a)da (11) additivity is obtained though the years lost do not add tox−xe0. It can be shown that if we further replace(x−a)eabyx−ain equation (11) (which Vaupel and Canudas-Romo
(2003) did not do) we get a measure of “premature (tox) years of potential life lost” (Gardner and Sanborn 1990), which is identical toaλi0defined in equation (3).
5.
An illustration: Danish and Russian national mortality data
Figure 2: Life table distribution of survivors and death by cause of death, males from Denmark 2005
Source: HMD and WHO.
Figure 3: Life table distribution of survivors and death by cause of death, males from Russia 2005
Source: HMD and WHO.
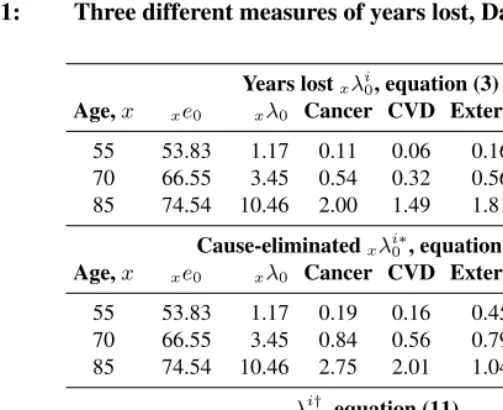
Table 1: Three different measures of years lost, Danish males 2005
Years lostxλi0, equation (3)
Age,x xe0 xλ0 Cancer CVD External Other Sum
55 53.83 1.17 0.11 0.06 0.16 0.84 1.17 70 66.55 3.45 0.54 0.32 0.56 2.03 3.45 85 74.54 10.46 2.00 1.49 1.81 5.16 10.46
Cause-eliminatedxλi0∗, equation (10)
Age,x xe0 xλ0 Cancer CVD External Other Sum
55 53.83 1.17 0.19 0.16 0.45 0.63 1.42 70 66.55 3.45 0.84 0.56 0.79 1.36 3.55 85 74.54 10.46 2.75 2.01 1.04 2.91 8.70
xλi
†
0, equation (11)
Age,x x−xλ†0 xλ†0 Cancer CVD External Other Sum
55 50.93 4.07 0.92 0.56 1.00 1.58 4.07 70 61.90 8.10 2.56 1.71 1.13 2.70 8.10 85 72.68 12.32 3.68 3.32 1.26 4.06 12.32
Source: HMD and WHO.
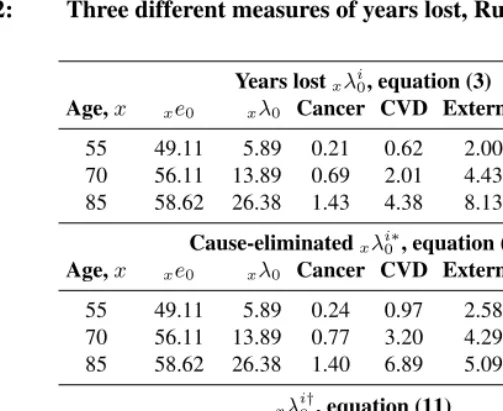
From Tables 1-2 it follows that, no matter which measure of years lost is used, there are large differences between the two countries. Thus, for any agex, the total number of years lost beforexis considerably larger in Russia. Also, patterns in differences between causes are captured by all methods: Cancer is a major cause of years lost only in Denmark, whereas external causes and CVD dominate in Russia.
Table 2: Three different measures of years lost, Russian males 2005
Years lostxλi0, equation (3)
Age,x xe0 xλ0 Cancer CVD External Other Sum
55 49.11 5.89 0.21 0.62 2.00 3.06 5.89 70 56.11 13.89 0.69 2.01 4.43 6.75 13.89 85 58.62 26.38 1.43 4.38 8.13 12.45 26.38
Cause-eliminatedxλi0∗, equation (10)
Age,x xe0 xλ0 Cancer CVD External Other Sum
55 49.11 5.89 0.24 0.97 2.58 1.81 5.60 70 56.11 13.89 0.77 3.20 4.29 3.15 11.39 85 58.62 26.38 1.40 6.89 5.09 4.01 17.39
xλi
†
0, equation (11)
Age,x x−xλ†0 xλ†0 Cancer CVD External Other Sum
55 42.97 12.03 0.81 3.06 4.66 3.49 12.03 70 54.49 15.51 1.47 5.11 4.95 3.99 15.51 85 68.29 16.71 1.62 5.98 4.98 4.14 16.71
Source: HMD and WHO.
Table 3: Decomposition of the male life expectancy gap between Denmark and Russia in 2005
Age,x xe0 xe0 Difference Cause-contribution to difference
Denmark Russia Cancer CVD External Other Sum
55 53.83 49.11 4.72 0.11 0.56 1.83 2.22 4.72
70 66.55 56.11 10.44 0.15 1.69 3.88 4.72 10.44 85 74.54 58.62 15.92 -0.58 2.89 6.32 7.29 15.92
Source: HMD and WHO.
Figure 4: Contribution to years lost by age for males from Denmark 2005
Figure 5: Contribution to years lost by age for males from Russia 2005
Source: HMD and WHO.
6.
Discussion
Cause-specific decomposition of mortality is an old theme in demography and public health, as hinted in Section 1. Much of that literature involves counterfactual assumptions about what would happen if some cause were eliminated. More recently, there has been considerable interest in using years lost to particular causes of death as a measure of disease burden, both at the global (e.g., Lopez et al. (2006) and the local (e.g., Aragon et al. (2008)) levels. In these applications it is common to attach various weighting schemes to the lost years, thereby generating concepts such as disability-adjusted life years; see Gardner and Sanborn (1990) for an early concise and critical survey. Furthermore, the actual mortality experience is often related to some standard mortality regime.
unequivocal classification of causes of death. This issue is not always discussed in depth in methodological expositions, although we refer to Manton and Stallard (1984) for their exemplary discussion related to the USA. As an example from the applied literature we may mention the detailed description by Lopez et al. (2006) of the formidable problems in obtaining comparable cause-of-death data for world-wide comparisons.
Our proposal in this paper is to focus on the basic, directly observable data and to develop a concept of life years lost from the classical concept of crude probability of cause-specific death (going back at least to Farr (1841)) or cumulative cause-specific in-cidence of death, as the concept is now usually termed in biostatistics and epidemiology. In contrast to many other proposals, this measure is additive in the sense that it satisfies the obvious balancing equation that the sum of years lost to a set of mutually exclusive and exhaustive causes equals the total years lost, and as seen in Figs. 2-3 this may be attractively illustrated in simple survival graphs. Also, the measure lends itself to further decompositions, e.g. according to age or according to country, as illustrated using life-tables from Denmark and Russia in Section 5.
7.
Acknowledgements
References
Andersen, P. (2013). Decomposition of number of years lost according to causes of death. Statistics in Medicine.doi:10.1002/sim.5903.
Andersen, P., Borgan, Ø., Gill, R., and Keiding, N. (1993). Statistical Models Based on Counting Processes. New York: Springer.
Andreev, E. (1982). Metod komponent v analize prodoljitelnosty zjizni. [The method of components in the analysis of length of life]. Vestnik Statistiki9: 42–47.
Andreev, E., Shkolnikov, V., and Begun, A. (2002). Algorithm for decomposition of dif-ferences between aggregate demographic measures and its application to life expectan-cies, Gini coefficients, health expectanexpectan-cies, parity-progression ratios and total fertility rates.Demographic Research7(14): 499–522. doi:10.4054/DemRes.2002.7.14. Aragon, T., Lichtensztajn, D., Katcher, B., Reiter, R., and Katz, M. (2008). Calculating
expected years of life lost for assessing local ethnic disparities in causes of premature death. BMC Public Health8(16).doi:10.1186/1471-2458-8-116.
Arriaga, E. (1984). Measuring and explaining the change in life expectancies. Demogra-phy21(1): 83–96. doi:10.2307/2061029.
Beltrán-Sánchez, H., Preston, S., and Canudas-Romo, V. (2008). An inte-grated approach to cause-of-death analysis: cause-deleted life tables and de-compositions of life expectancy. Demographic Research 19(35): 1323–1350. doi:10.4054/DemRes.2008.19.35.
Benichou, J. and Gail, M. (1990). Estimates of absolute cause-specific risk in cohort studies. Biometrics46(3): 813–826. doi:10.2307/2532098.
Bernoulli, D. (1766). Essai d’une nouvelle analyse de la mortalité, causée par la petite vérole, et des avantages de l’inoculation pour le prévenir. Histoire avec les Mémoires, Académie Royal des Sciences Paris 1760:1–45.
Chiang, C. (1961). A stochastic study of the life table and its applications. III. the follow-up study with the consideration of competing risks. Biometrics17(1): 57–78. doi:10.2307/2527496.
Chiang, C. (1968). Introduction to Stochastic Processes in Biostatistics. New York: Wiley.
d’Alembert, J. (1761). Sur l’application du calcul des probabilities à l’inoculation de la petite vérole. In: d’Alembert, J. (ed.).Opuscules Mathematiques 2. 26.
Dietz, K. and Heesterbeek, J. (2002). Daniel Bernoulli’s epidemiological model revisited. Mathematical Biosciences180(1–2): 1–21.doi:10.1016/S0025-5564(02)00122-0. Farr, W. (1841). Report on the mortality of lunatics. Journal of the Statistical Society of
London4(1): 17–33.doi:10.2307/2338035.
Gardner, J. and Sanborn, J. (1990). Years of potential life lost (YPLL) – What does it measure? Epidemiology1(4): 322–329.doi:10.1097/00001648-199007000-00012. Hoem, J. (1969). Purged and partial Markov chains. Skandinavisk Aktuarietidskrift52:
147–155.
Human Mortality Data base (HMD) (2013). Human mortality data base. [electronic resource]. University of California, Berkeley, USA and Max Planck Institute for De-mographic Research, Germany.www.mortality.orgorwww.humanmortality.de. Irwin, J. (1949). The standard error of an estimate of expectation of life, with special
ref-erence to expectation of tumourless life in experiments with mice.Journal of Hygiene 47(2): 188–189.doi:10.1017/S0022172400014443.
Kalbfleisch, J. and Prentice, R. (1980). The Statistical Analysis of Failure Time Data. New York: Wiley.
Karn, M. (1931). An inquiry into various death-rates and the comparative influence of certain diseases on the duration of life. Annals of Eugenics 4(3–4): 279–302. doi:10.1111/j.1469-1809.1931.tb02080.x.
Karn, M. (1933). A further study of methods of constructing life tables when certain causes of death are eliminated.Biometrika25(1–2): 91–101.doi:10.2307/2332264. Keyfitz, N. (1977). What difference does it make if cancer were eradicated? An
exami-nation of the Taeuber paradox.Demography14(4): 411–418. doi:10.2307/2060587. Keyfitz, N. (1985).Applied Mathematical Demography. 2nd ed.New York: Springer. Lopez, A., Mathers, C., Ezzati, M., Jamison, D., and Murray, C. (2006). Global Burden
of Disease and Risk Factors. Washington, DC: World Bank Institute.
Makeham, W. (1874). On an application of the theory of the composition of decremental forces.Journal of the Institute of Actuaries18: 317–322.
Pollard, J. (1982). The expectation of life and its relationship to mortality.Journal of the Institute of Actuaries109(2): 225–240.doi:10.1017/S0020268100036258.
Pollard, J. (1988). On the decomposition of changes in expectation of life and differentials in life expectancy.Demography25(2): 265–276. doi:10.2307/2061293.
Prentice, R., Kalbfleisch, J., Peterson, A., Flournoy, N., Farewell, V., and Breslow, N. (1978). The analysis of failure time data in the presence of competing risks.Biometrics 34(4): 541–554.
Pressat, R. (1985). Contribution des écarts de mortalité par âge à la différence des vies moyennes. Population40(4–5): 765–770.doi:10.2307/1532986.
Preston, S., Heuveline, P., and Guillot, M. (2001).Demography. Oxford: Blackwell. Sverdrup, E. (1967). Statistiske metoder ved dødelighetsundersøkelser. Statistical
Mem-oirs, Institute of Mathematics, University of Oslo.
United Nations (1982). Levels and Trends of Mortality Since 1950, Study 74. New York: United Nations; Department of International Economic and Social Affairs.
Vaupel, J. and Canudas-Romo, V. (2003). Decomposing change in life expectancy: A bouquet of formulas in honor of Nathan Keyfitz’s 90th birthday. Demography40(2): 201–216.doi:10.1353/dem.2003.0018.
Appendix
First, note that all quantities presented in Section 2 can be defined conditionally on sur-vival untill agex. Thus, the probability of surviving past agex+namong those who survived until agexis
npx= exp(−
Z x+n
x
µ(a)da),
the temporary life expectancy between agesxandx+nis
nex=
Z x+n
x
apxda,
and, among those still alive at agex, the probability of dying from cause ibefore age
x+nis
nqxi =
Z x+n
x
apxµi(a)da.
We still have the balance equation
npx+
X
i
nqxi = 1.
Furthermore,
nλix=
Z x+n
x
aqixda
is the expected number of life years lost before agex+ndue to causeiamong those alive at agexand it follows that
nex+
X
i
nλix=n.
Second, as an alternative to the life-table estimates presented in Section 3, all quan-tities may be estimated from age- and cause-specific mortality rates. To this end, the interval [0, ω)is split into disjoint age intervals [ak−1, ak), k = 1, . . . , K witha0 = 0, aK=ωand we assume that the mortality ratesµ(a)arepiecewise constant, i.e.
µ(a) =µkwhena∈[ak−1, ak), k= 1, . . . , K.
In this case, the survival functionap0= exp(−R
a
0 µ(x)dx)evaluated at ageakis:
akp0= exp(−
k
X
j=1
and fora∈[ak, ak+1)
ap0=akp0exp(−µk+1(a−ak)).
Further, we have
(ak−am)pam = exp(−
k
X
j=m+1
µj(aj−aj−1)), k = 1, . . . , K, k > m,
and, more generally, fora∈[aj−1, aj)andx∈[am−1, am)
(x−a)pa = exp(−µj(aj−a))·(am−1−aj)paj·exp(−µm(x−am−1)).
It follows that the temporary life expectancy between agesamandak(witham< ak) is
(ak−am)eam=
Z ak
am
(a−am)pamda=
k
X
j=m+1 Z aj
aj−1
(a−am)pamda
=
k
X
j=m+1
(aj−1−am)pam
Z aj
aj−1
exp(−µj(a−aj−1))da
=
k
X
j=m+1
(aj−1−am)pam
1
µj
(1−exp(−µj(aj−aj−1))),
and, fora∈[aj−1, aj)
(ak−a)ea=
Z aj
a
(x−a)padx+
Z ak
aj
(x−a)padx
= 1
µj
(1−exp(−µj(aj−a))) + exp(−µj(aj−a))(ak−aj)eaj.
The conditional probability of death from causeibefore ageak, given survival untill
ageamis
(ak−am)q
i am =
Z ak
am
(a−am)pamµ
i(a)da= k
X
j=m+1 Z aj
aj−1
(a−am)pamµ
i(a)da
=
k
X
j=m+1
(aj−1−am)pam
Z aj
aj−1
=
k
X
j=m+1
(aj−1−am)pam µi
j
µj
(1−exp(−µj(aj−aj−1)))
and, thereby, fora∈[ak, ak+1):
(a−am)q
i
am =(ak−am)q
i am+
Z a
ak
(x−am)pamµ
i k+1dx
=(ak−am)q
i
am+(ak−am)pam µi
k+1
µk+1
(1−exp(−µk+1(a−ak))).
It follows that the number of years lost due to causeibetween agesamandak is:
(ak−am)λ
i am =
Z ak
am
(a−am)q
i amda=
k
X
j=m+1 Z aj
aj−1
(a−am)q
i amda
=
k
X
j=m+1 Z aj
aj−1
((aj−1−am)q
i
am+(aj−1−am)pam µi
j
µj
(1−exp(−µj(a−aj−1))))da
=
k
X
j=m+1
(aj−aj−1)(aj−1−am)q
i am
+(aj−1−am)pam µij
µj
((aj−aj−1)− 1
µj
(1−exp(−µj(aj−aj−1)))).
Note that (as it should be!) X
i
(ak−am)λ
i
am+(ak−am)pam=ak−am.
Finally, we look at
(ak−am)λ
† am =
Z ak
am
(ak−a)ea·(a−am)pamµ(a)da
or the corresponding cause-specific measure
(ak−am)λ
i† am =
Z ak
am
(ak−a)ea·(a−am)paµ
We have, for the all-cause quantity
(ak−am)λ
† am =
k
X
j=m+1 Z aj
aj−1
(ak−a)ea·(a−am)pamµjda
=
k
X
j=m+1 Z aj
aj−1 1
µj
(1−exp(−µj(aj−a))) + exp(−µj(aj−a))(ak−aj)eaj
×exp(−µj(a−aj−1))(aj−1−am)pamµjda
=
k
X
j=m+1
[(aj−1−am)pam
1
µj
(1−exp(−µj(aj−aj−1)))−(aj−aj−1) exp(−µj(aj−aj−1))
+µj(aj−aj−1) exp(−µj(aj−aj−1))(ak−aj)eaj ·(aj−1−am)pam]
=
k
X
j=m+1
(aj−1−am)pam
× 1
µj
(1−exp(−µj(aj−aj−1)))+(aj−aj−1) exp(−µj(aj−aj−1))(µj·(ak−aj)eaj−1)
.
For the cause-specific quantity(ak−am)λ
i†
ameach term should be multiplied byµ
i j/µj.
If, in the expression for(ak−am)λ
i†
am, we replace(ak−a)eabyak−a, i.e.
(ak−am)λ
i†0 am =
Z ak
am
(ak−a)·(a−am)pamµ
i(a)da
we simply (by partial integration) get(ak−am)λ