The Genomic Standards Consortium
GeneWiz browser: An Interactive Tool for Visualizing
Sequenced Chromosomes
Peter F. Hallin1, Hans-Henrik Stærfeldt1, Eva Rotenberg1, 2, Tim T. Binnewies1, 3, Craig J. Benham4, and David W. Ussery1
1 Center for Biological Sequence Analysis, Department of Systems Biology, The Technical University of Denmark, 2800 Kgs. Lyngby, Denmark.
2 Lersoe Parkalle 37, 2TV, 2100 Copenhagen, Denmark 3 Roche Diagnostics Ltd., CH-6343 Rotkreuz, Switzerland
4 UC Davis Genome Center, University of California, Davis, California, U.S.A.
We present an interactive web application for visualizing genomic data of prokaryotic chro-mosomes. The tool (GeneWiz browser) allows users to carry out various analyses such as mapping alignments of homologous genes to other genomes, mapping of short sequencing reads to a reference chromosome, and calculating DNA properties such as curvature or stack-ing energy along the chromosome. The GeneWiz browser produces an interactive graphic that enables zooming from a global scale down to single nucleotides, without changing the size of the plot. Its ability to disproportionally zoom provides optimal readability and in-creased functionality compared to other browsers. The tool allows the user to select the dis-play of various genomic features, color setting and data ranges. Custom numerical data can be added to the plot allowing, for example, visualization of gene expression and regulation data. Further, standard atlases are pre-generated for all prokaryotic genomes available in GenBank, providing a fast overview of all available genomes, including recently deposited genome sequences. The tool is available online from http://www.cbs.dtu.dk/services/gwBrowser. Supplemental material including interactive at-lases is available online at http://www.cbs.dtu.dk/services/gwBrowser/suppl/.
Introduction
The development of fast and inexpensive genome sequencing technologies has led to the generation of vast amounts of genomic information. As ge-nomic sequencing becomes both more powerful and affordable, the handling and analysis of the generated data produces novel challenges and shifts the focus away from the discovery process towards technical considerations of handling, storing and analyzing sequence data. An impor-tant step when exploring a new genome is to com-pare it to existing sequences, in order to identify both novel and conserved features. Many auto-mated computational methods are available that attempt to derive protein function from sequence [1-3]. In a metagenomic study by Harrington and co-workers it was estimated that 76% of the ex-amined protein coding genes could be assigned a function. However, to assess predictions for
indi-vidual genes the visualization remains critical to provide the biologist with an overview of the ge-nomic context. Are genes of interest situated in clusters? In operons? How are they regulated? How does their DNA base composition compare with that of the rest of the genome? In order to display such features both on a genome scale and in close-up down to the level of nucleotides, we developed the GeneWiz browser which is based on the ‘Genome Atlas’ concept [4,5]. This tool can also display local DNA structural properties, so that regulatory or repeat regions can easily be identified and interpreted in a chromosomal con-text.
synthesis in flow cells to simultaneously obtain the sequences of millions of different DNA tem-plates, an approach that changed the field of DNA sequencing [6,7]. Flow sequencing, also known as sequencing by synthesis (SBS) on a solid surface, tracks nucleotides as they are added to a growing DNA strand [8]. SBS is used by high-throughput sequencing systems which have become commer-cially available in the past two years. Examples include the sequencer GS Titanium (commercia-lized by 454/Roche); Genome Analyser GA-II (So-lexa/Illumina); and SOLiD™ 3 system (Applied Biosystems).
These developments have increased the speed of sequencing while significantly reducing its cost [9,10]. This much higher throughput provides greater coverage, but at the cost of much shorter read-lengths: from 50 bases with SOLiD 3 to 75 bases with Illumina GA II. Even reads of 500 bases obtained with the 454-Titanium are still shorter than read lengths typically obtained using the Sanger method [9,11]. The output from modern high-through sequencing equipment challenges the assembly software by generating shorter and ambiguous reads. Processing of this flood of se-quence data has rapidly become a bottleneck, and developing the necessary skills and tools will most likely be a driving factor in the execution of second-generation sequencing [12]. As a first step in this development, it needs to be determined to what extent assembly of short-read sequences can be trusted, an assessment for which the GeneWiz browser can also be used.
Methods
Our method of visualization is based on color-encoded lanes to display numerical information on a genome atlas similar to GeneWiz [4,5]. The color encoding can be done either using a linear scale with a fixed minimum and maximum range, or a dynamic scale of standard deviations. Using the latter, color intensity decreases as data ap-proach average values, thereby emphasizing re-gions of significant variation. The web interface is divided into four optional sections, to address various biological viewpoints of chromosomes: 1) DNA properties 2) Mapping of homologous genes by BLAST 3) Mapping of short sequencing reads 4) Custom lanes such as Single Nucleotide
Polymor-phism (SNP) or microarray data. The output of each method is a numerical vector of length cor-responding to that of the reference sequence, and the methods used for this construction are de-scribed in detail below.
Read quality assessment
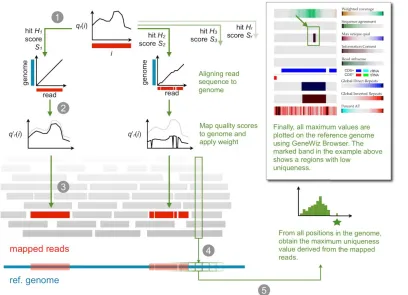
Gene duplications, rRNA operons and other repeti-tive chromosomal regions are known to cause difficulties during the assembly of short reads [13]. To assess the degree of ambiguity of sequencing reads, a method was developed that derives the uniqueness of all reads, accounting for both the read quality and the match to the reference ge-nome.
Sequence reads from Illumina and 454 are re-ported with base qualities: a per-nucleotide meas-ure that denotes the credibility of the base calls. A method was derived which condenses these quali-ties into values per position in the reference ge-nome and calculates the following information: uniqueness-weighted quality, information content, sequence agreement, and repeat-weighted cover-age, (see methods). These estimates provide a preliminary overview of regions that may appear problematic to assemble. In general, low unique-ness is found in the gaps between the assembled contigs generated by the default assembly tools from a given sequence dataset, as will be demon-strated below. A high score of uniqueness-weighted quality indicates that the base is unique-ly identified by a read and that it has a high base quality in that read. The approach is illustrated in
Figure 1.
From the mapping, five different parameters were calculate which together summarizes the trust-worthiness of the reads given the assembly:
Weighted coverage
Under the assumption that
all reads would map only once (
H
r=1), the
cov-erage
c
(
i
) can be calculated as the number of
alignments
R
mapped at position
i
. A weighted
coverage
c
’(
i
)=
w
r,h(see equation below) is used
Figure 1 | Mapping reads to a reference genome accounting for uniqueness. In step 1, each read is aligned against the reference genome. In the second step, the quality of each read is weighted ac-cording to the uniqueness of the hit. A read giving rise to two hits S1 and S2 in the reference ge-nome will be weighted proportionally with the relative alignment scores; if scores are identical, the mapping of S1 and S2 will be applied a weight of w=0.5 (see equation below). Step 3 maps the weighted qualities back to the reference genome so that each genomic position contains an array of weighted qualities. Once all reads are mapped, in step 4 only the maximum weighted quality value is kept and, step 5, the maximum weighted quality scores are color coded to reveal regions of low uniqueness.
Sequence agreement This denotes the frequency
of the reference nucleotide among the reads mapped at a given position and reveals the extent of agreement between the reads and the reference genome, as shown in Figure 2.
Figure 2. Agreement between reads and ref-erence sequence.
Uniqueness-weighted quality This measure
cor-responds to the base qualities obtained from the
reads that are mapped to the reference genome, weighted by the uniqueness of the read. Consider read r, which has a quality profile , where i is
the position in the read. The read is aligned to the reference genome by BLAST, and all Hr hits are
included, when the following criteria are met: BLAST score Sh of hit h is greater than or equal to
S0 (optionally provided by the user), Sh ≥ S1 ⋅ x
where S1 is the score of the first/best hit, x ∈ [0;1]
is a constant provided by the user, and the E-value
From all the q’r(i) values obtained at each position
in the genome, the maximum uniqueness-weighted quality is chosen when all reads have been mapped.
Information content provides a number in bits of
information [14] representing to what degree the reads agree: zero bits means equal distribution of
A, T, G and C at a given position and 2 bits means complete conservation of a single base.
2 2
2
alog log
i i i
ATGC
R
P
P
αα∈
= +
∑
⋅
The value is plotted on a color scale whereby low information (random distribution, least expected) is given in dark colors, and high information (high conservation, most expected) as light or neutral color. This measure may be useful for visualizing single nucleotide polymorphisms.
Read absence. A boolean where ‘one’ indicates
complete absence of aligned reads.
Visualization of whole-genome homology
The BLASTatlas method [15] derives a map of per-nucleotide numbers on a reference genome to visualize the matches in the alignment between the reference genome and a query. The query can constitute any number of genomic contigs, scaf-folds, full genomes, or collections thereof. This provides a method to identify regions of a refer-ence genome that are conserved throughout mul-tiple samples, as well as those that are unique. The BLASTatlas method is integrated into the GeneWiz browser software to facilitate a user-friendly in-terface. According to the BLAST algorithm chosen, DNA or protein sequences of the reference are aligned with the best match in the query (using either blastp, blastn, tblastn, or blastx). Thealign-ment is then mapped back to the reference ge-nome. A match adds a 'one' whereas a mismatch adds a 'zero' at each position along the chromo-some. These ones and zeros translate into smooth color zones due to binning
DNA properties and DNA destabilization
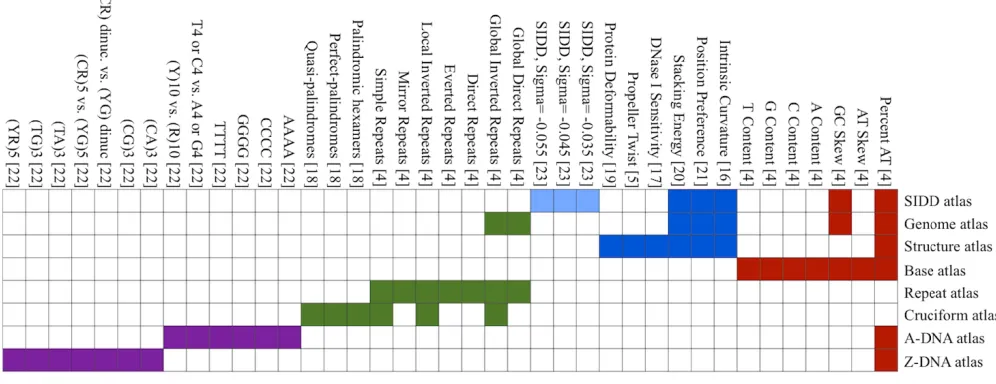
Through the web interface it is currently possible to select from 36 different nucleotide composition and DNA structural properties [4,5,16-22]. In addi-tion to this, calculaaddi-tions of so-called SIDD energy estimates are provided, offering an approximation of promoter regions. This method estimates the free energy required to open the DNA helix, calcu-lated at the three different superhelix densities σ = -0.035, -0.044, -0.055, using the SIDD algorithm [23]. All of these parameters can be applied in any combination to any of the prokaryotic genomes available from the web interface, or to a custom sequence provided by the user. Alternatively, the parameters may be applied as collections forming 8 standard atlases: Genome-, Base-, Structure-, Cruciform-, A-DNA-, Z-DNA-, the Repeat-atlas, and finally the SIDD atlas, which is introduced in this manuscript (Figure 3).Custom data
A designated section of the GeneWiz browser is assigned for custom data. It allows the user to provide a per-nucleotide list of numerical values along with a desired color and data range. Al-though not presented here, this allows for visuali-zation of additional information such as microar-ray data that has been pre-processed by the user, by mapping gene expression, regulation change, or
p-values back to genomic coordinates. In addition
to the main genome annotation covering CDSs,
tRNAs, and rRNAs, the user may specify miscella-neous and pseudo-gene annotations separately. A button allows the query of selected reference ge-nomes against a replicate of pseudogenes.org [24]. Other annotations of possible pseudogenes can be added, such as GenePRIMP output (geneprimp.jgi-psf.org/).
Dynamic visualization
The GeneWiz browser allows dynamic dispropor-tional zooming, meaning that zooming occurs nearly instantly when requested by the user, by redrawing all the components like tracks, legends, marks and text for every view. This allows the browser to scale the plot to make use of the entire
plotting area, by not rescaling all parts of the plot equally. For example, zooming 10 x will stretch a data lane 10 in genome position axis, however the lane height and distance to the neighbor lane will remain constant. The dynamic nature of the GeneWiz browser requires pre-binning of data for each zoom level, all of which are stored on a cen-tral server; for improved efficiency only data re-quested by the user are sent. The approach to store per-nucleotide information as table records in a database (e.g. MySQL) has proved unfeasible, as the number of records per genome exceeds millions, and the construction of indexes would be very time consuming. Instead, a memory mapping technique was chosen, that allows the server to directly obtain the values from binary files when provided with the zoom window and level, for any chromosome in the database. (Examples are pro-vided as supplemental data, http://www.cbs.-dtu.dk/services/gwBrowser/suppl/).
The client is written as a JavaApplet, that obtains the data remotely from the server
(http://ws.cbs.dtu.dk/cgi-bin/gwBrowser-0.91/server.cgi). The browser server is written in Perl/CGI, while a compiled c-program handles the
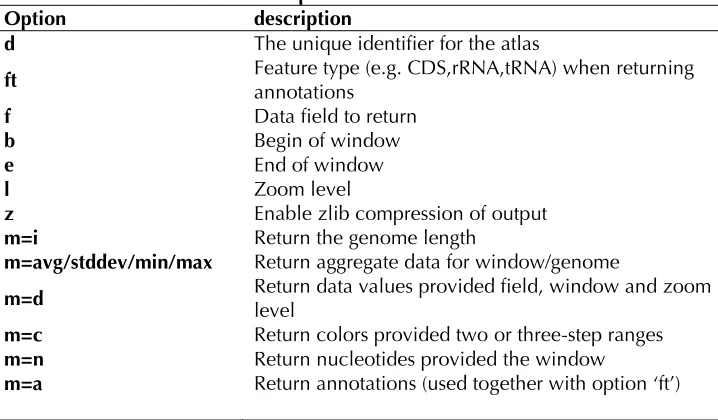
access to the binary data files. The options cur-rently supported are listed in Table 2.
Table 2 GeneWiz Browser server options.
Option description
d The unique identifier for the atlas
ft Feature type (e.g. CDS,rRNA,tRNA) when returning annotations
f Data field to return
b Begin of window
e End of window
l Zoom level
z Enable zlib compression of output
m=i Return the genome length
m=avg/stddev/min/max Return aggregate data for window/genome
m=d Return data values provided field, window and zoom level m=c Return colors provided two or three-step ranges m=n Return nucleotides provided the window
m=a Return annotations (used together with option ‘ft’)
These options (Table 2) can be incorporated into a single URL. For example, one could request all numerical data for field f=dnap0, at zoom level l=5, from position b=1 to e=37,473bp, using
com-pression, z=true
68GENOMEatlas&m=d&f=dnap0&b=1&e=37473& l=5&z=true). The field names and their configura-tions are described in the xml record, which can be downloaded from the web
Fur-ther examples are provided in the supplemental data section.
The GeneWiz workflow and data displayed
The GeneWiz browser plots and provides dispro-portional zooming for data pertaining to features and genes as well as numerical data associated with each nucleotide. The disproportional capabil-ity of the GeneWiz browser implies that all com-ponents (legends, tracks, marks, etc.) areregene-rated for every view requested by the user. Figure 4
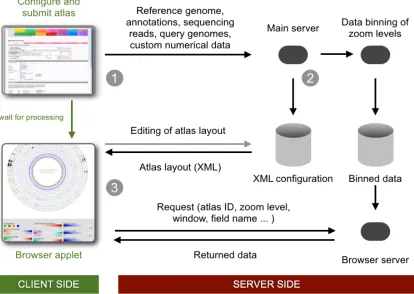
outlines the GeneWiz browser workflow.
When submitting a job via the web interface, the request is assigned a job identifier, under which all data lanes and configurations are kept. After the job has been processed the user may alter lane order, colors, ranges, and append various types of marks to the plot. The layout of a given browser instance is governed by an XML file, located on the server. When generating the graphical representa-tion of the genome, the client Java program will make requests to the server to acquire aggregated values, such as the averages, standard deviations, minima, and maxima as well as lane data and an-notations.
Figure 4 | The dataflow of the GeneWiz browser service. 1) The selected reference genome and the lanes to be included are defined via the web interface. 2) The request is sent to the analysis server that handles the calculations. 3) When the job is finished, the web page redirects to the applet viewer that allows the user to navigate and edit the plot layout.
Premade atlases
The genome sequences stored in the CBS Genome Atlas Database [25] are synchronized with NCBI Entrez genome projects and have been pre-processed for all of the eight standard atlases mentioned above. This allows the user to select from currently 1,636 pre-binned replicons from 864 prokaryotic sequencing projects, searchable by replicon name, GenBank accession number, or
organism name (http://www.cbs.dtu.dk/- servic-es/gwBrowser/precalc/)
Results
Evaluation of re-sequencing quality
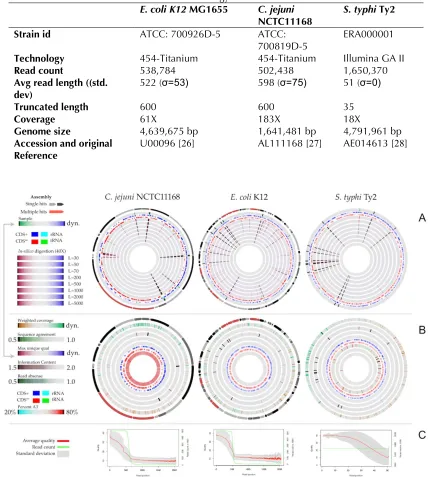
454-Titanium technology (Table 3). The public se-quence was selected as reference for mapping the re-sequencing reads using the GeneWiz browser tool. The randomness in fragmentation was esti-mated by comparing the experimental data with
in-silico digestions, generated at 40X coverage
using read lengths between 30 to 5,000 bp. A good correspondence between the in-silico and
experi-mental reads suggests little bias towards certain chromosomal regions (Figure 5, panel A). The
as-sembled contigs provided by 454 (C. jejuni and E. coli) are mapped to the reference genome using
BLAST and annotated in the perimeter of the at-lases (two leftmost atat-lases in Figure 5, panel A+B). The detailed atlas of the experimental data (true reads), are shown in Figure 5, panel B. Panel C shows quality/count of reads plotted as a function of read position. Note that the read quality de-creases the further the distance from the begin-ning of the read.
Table3 Sequencing details of three bacterial genomes, two of which were re-sequenced using 454-Titanium and one with Illumina GA technology.
E. coli K12 MG1655 C. jejuni
NCTC11168
S. typhi Ty2
Strain id ATCC: 700926D-5 ATCC:
700819D-5 ERA000001
Technology 454-Titanium 454-Titanium Illumina GA II
Read count 538,784 502,438 1,650,370
Avg read length ((std. dev)
522 (σ=53) 598 (σ=75) 51 (σ=0)
Truncated length 600 600 35
Coverage 61X 183X 18X
Genome size 4,639,675 bp 1,641,481 bp 4,791,961 bp
Accession and original
Reference U00096 [26] AL111168 [27] AE014613 [28]
200, 500, 1,000, 1,000, and 5,000 bases. Panel B shows the weighted coverage, agreement with reference, maximum uniqueness quality, information content, read absence, and AT content. All six plots can be accessed for zooming via the supplemental data section. Panel C displays the read count (green, secondary ordinate) and read quality (red, primary ordinate) as a function of read length. Note that read counts differ within the three datasets, resulting in different scales on the secondary ordinate. For the two 454-Titanium sets (C. jejuni and E. coli K12), an assembly was provided which allows a mapping of contigs to the reference genome. These marks are shown in gray in the perimeter of these plots. Red marks indicate contigs with two or more hits in the refer-ence.
Genome homology: Comparing multiple
Burkholderia species
A comparative study aimed at mapping for exam-ple pathogenic islands or gene losses among dif-ferent bacterial genomes can benefit from a graph-ical representation provided by the BLASTatlas method. The genus of Burkholderia covers a
num-ber of important animal and human pathogens known to cause melioidosis (B. pseudomallei) and
pulmonary infection in cystic fibrosis (CF) patients
(B. cepacia), whereas B. thailandensis, which is
closely related to B. pseudomallei, rarely gives rise
to diseases in humans [29,30]. Both species of B. thailandensis and B. mallei display large
chromo-somal deletions when compared to B. pseudomal-lei. However, the more scattered nature of the
gene loss observed in B. thailandensis suggests
that B. mallei evolved from B. pseudomallei
through the loss of larger regions [31]. These dele-tions are evident from the atlas shown in Figure 6
where the two chromosomes of Burkholderia
pseudomallei 1710b are used as BLASTatlas
refer-ence in a comparison with 14 publicly available
Burkholderia genomes (B. thailandensis plus all
species having two or more strains sequenced, see supplemental data). In addition it is evident that a strong preference of deletion exist for chromo-some II. Ong and co-workers report that deletions in chromosome II counts for 70% and 61% of the total gene loss in B. mallei and B. thailandensis,
respectively.
In-212 Standards in Genomic Sciences nermost circles show percent AT, and CG skew. Note, that to allow visual comparison between B. thailandensis and B. mallei, both species are colored green: the outermost green lane corresponds to the single B. thailandensis, whereas the remaining four green lanes are all B. mallei. GenBank accession numbers as well as interactive plots are available through the supplemental data section.
The SIDD atlas: Annotation of regulatory
elements
The browser application enables the user to ap-pend various annotation marks such as transcrip-tion start site arrows, gene labels, and boxes. A final example illustrates how these marks can be used to integrate known regulatory elements with DNA properties and gene annotations to draw a more complete picture of a promoter region. The regulatory elements of the E. coli K12 MG1665 rrn
operons [32] have been annotated in a standard SIDD atlas, providing a visualization of the P1/P2
promoter structure (Figure 7). A zoom of the pro-moter region reveals a strong SIDD site near the predominant P1 promoter approximately 40 bp. upstream of the P1 transcription start site. The transcription factor FIS stimulates transcription at several promoters, and for example the binding of FIS at the leuV promoter [33] has been suggested to transmit the superhelical destabilization down-stream to the point where the RNAP twists and opens the helix [34]. This model may be valid for the rrnB P1 promoter also, as the activity of leuV
and rrnB P1 are comparable [35].
Figure 7 | A zoom upstream of the E. coli K12 MG1665 rrnB operon. The three outer-most lanes show SIDD at three superhelix densities of sigma=-0.055, -0.045, and -0.035. The lower free ener-gy required to melt the helix can be observed near the UP element of P1, for the SIDD lane at sig-ma = -0.045. The atlas is available for zooming on the supplemental data section.
Discussion
Visualization of the multidimensional information that is represented by a single genome sequence remains complex. An indispensable property of a genome visualization tool is that it must be zoom-able, so that information can be interpreted at varying scales. Two recently published methods, the DNAPlotter [36] and the Genome Projector [37], both enable the user to build circular plots of numerical data related to genes as well as graphs of numerical data pertaining to the nucleotides.
A number of other tools approach genome visuali-zation from different angles: Genome Diagram [38] and Circos [39] are command line programs gene-rating publication quality static images and vector graphics. Although these tools allow comparison of other genomes, are flexible and allow visualiza-tion of numerical data, they lack an interactive layer.
The GeneWiz browser described here uses dis-proportional zooming to overcome this. From a technical perspective, the choice of programming language for writing graphical browsers is of im-portance. There are obvious advantages of provid-ing platform-independent Java software like that of the GeneWiz browser, but often this is at the cost of performance. Nevertheless, our tool de-monstrates the usefulness of a genome browser that relies on interactive, true disproportional zooming to visualize annotated genes and features as well as numerical data provided at single nuc-leotide resolution. By building a comprehensive tool that is both scalable and flexible, we have shown how different types of genomic data can be integrated into a single, easily navigated graphic that can be annotated further by the user.
Author contributions
P.F.H. wrote the paper and composed the web interfaces, as well as most parts of the server back end. H.H.S. wrote the c-code of the data binning and retrieval software and contributed to the Java Applet; E.R. wrote the majority of the Java Applet code and formulation of the XML configurations. T.T.B. provided source data and analysis of C. jeju-ni and E. coli sequencing reads and C.J.B. assisted
writing the paper (paragraphs on SIDD energy). D.W.U. assisted in writing the paper, supervised the project and provided ideas for figures and analysis. All authors have read and made correc-tions to the manuscript.
Acknowledgements
This work is funded in part by grants from the Danish Center for Scientific Computing, NSF Research Grant DBI-0416764, The Danish Research Council grant 26-06-0349, and the EU EMBRACE network of Excellence, contract number LSHG-CT-2004-512092. We thank Mark Driscoll and Marcel Margulies from 454 Life Sciences for providing the data for C. jejuni and E. coli and Julian Parkhill at the Sanger institute for providing the S. typhi sequencing data. We thank also Dr. Trudy Wassenaar and Dr. Lars Juhl Jensen for making sugges-tions to the manuscript.
Reference
1. Harrington ED, Singh AH, Doerks T, Letunic I, von Mering C, Jensen LJ, Raes J, Bork P. Quantita-tive assessment of protein function prediction from metagenomics shotgun sequences. Proc Natl Acad Sci USA 2007; 104:13913-13918
2. Jensen LJ, Gupta R, Blom N, Devos D, Tamames J, Kesmir C, Nielsen H, Staerfeldt HH, Rapacki K, Workman C et al. Prediction of human protein function from post-translational modifications and localization features. J Mol Biol 2002; 319
:1257-1265
3. Friedberg I. Automated protein function predic-tion--the genomic challenge. Brief Bioinform
2006; 7:225
4. Jensen LJ, Friis C, Ussery DW. Three views of microbial genomes. Res Microbiol 1999;
150:773-777
5. Pedersen AG, Jensen LJ, Brunak S, Staerfeldt HH, Ussery DW. A DNA structural atlas for
Escheri-chia coli. J Mol Biol 2000; 299:907-930
6. Hall N. Advanced sequencing technologies and their wider impact in microbiology. J Exp Biol 2007; 210:1518-1525
7. Holt RA, Jones SJ. The new paradigm of flow cell sequencing. Genome Res 2008; 18:839-846
8. Käller M, Lundeberg J, Ahmadian A. Arrayed identification of DNA signatures. Expert Rev Mol Diagn 2007; 7:65-76
9. Gupta PK. Single-molecule DNA sequencing technologies for future genomics research. Trends Biotechnol 2008; 26:602-611
10. Shendure J, Ji H. Next-generation DNA sequenc-ing. Nat Biotechnol 2008; 26:1135-1145
Tus-neem N, Stromberg MP et al. Rapid whole-genome mutational profiling using
next-generation sequencing technologies. Genome Res 2008; 18:1638-1642
12. Lin F, Schröder H, Schmidt B. Solving the Bottle-neck Problem in Bioinformatics Computing: An Architectural Perspective. J VLSI Signal Process
2007; 48:185-188
13. Phillippy AM, Schatz MC, Pop M. Genome as-sembly forensics: finding the elusive mis-assembly. Genome Biol 2008; 9:R55
14. Tolstrup N, Rouzé P, Brunak S. A branch point consensus from Arabidopsis found by non-circular analysis allows for better prediction of acceptor sites. Nucleic Acids Res 1997; 25
:3159-3163
15. Hallin PF, Binnewies TT, Ussery DW. The ge-nome BLASTatlas-a GeneWiz extension for visua-lization of whole-genome homology. Mol Biosyst 2008; 4:363-371
16. Bolshoy A, McNamara P, Harrington RE, Trifonov EN. Curved DNA without A-A: experimental es-timation of all 16 DNA wedge angles. Proc Natl Acad Sci USA 1991; 88:2312-2316
17. Brukner I, Sánchez R, Suck D, Pongor S. Se-quence-dependent bending propensity of DNA as revealed by DNase I: parameters for trinucleo-tides. EMBO J 1995; 14:1812-1818 18. van Noort V, Worning P, Ussery DW, Rosche
WA, Sinden RR. Strand misalignments lead to qu-asipalindrome correction. Trends Genet 2003;
19:365-369
19. Olson WK, Gorin AA, Lu XJ, Hock LM, Zhurkin VB. DNA sequence-dependent deformability de-duced from protein-DNA crystal complexes. Proc Natl Acad Sci USA 1998; 95:11163-11168
20. Ornstein RL, Rein R, Breen DL, MacElroy RD. An optimized potential function for the calculation of nucleic acid interaction energies. I- Base stacking. Biopolymers 1978; 17:2341-2360.
21. Satchwell SC, Drew HR, Travers AA. Sequence periodicities in chicken nucleosome core DNA. J
Mol Biol 1986; 191:659-675
22. Ussery D, Soumpasis DM, Brunak S, Staerfeldt HH, Worning P, Krogh A. Bias of purine stretches in sequenced chromosomes. Comput Chem
2002; 26:531-541
23. Wang H, Benham CJ. Superhelical destabilization in regulatory regions of stress response genes. PLOS Comput Biol 2008; 4:e17
24. Karro JE, Yan Y, Zheng D, Zhang Z, Carriero N, Cayting P, Harrrison P, Gerstein M. Pseudo-gene.org: a comprehensive database and compar-ison platform for pseudogene annotation. Nucleic Acids Res 2007; 35:D55-D60
25. Hallin PF, Ussery DW. CBS Genome Atlas Data-base: a dynamic storage for bioinformatic results and sequence data. Bioinformatics 2004; 20:3682-3686
26. Blattner FR, Plunkett G, Bloch CA, Perna NT, Burland V, Riley M, Collado-Vides J, Glasner JD, Rode CK, Mayhew GF et al. The complete ge-nome sequence of Escherichia coli K-12. Science 1997; 277:1453-1462
27. Parkhill J, Wren BW, Mungall K, Ketley JM, Churcher C, Basham D, Chillingworth T, Davies RM, Feltwell T, Holroyd S et al. The genome se-quence of the food-borne pathogen Campylobac-ter jejuni reveals hypervariable sequences. Nature 2000; 403:665-668
28. Deng W, Liou SR, Plunkett G, Mayhew GF, Rose DJ, Burland V, Kodoyianni V, Schwartz DC, Blattner FR. Comparative genomics of Salmonella enterica serovar Typhi strains Ty2 and CT18. J Bacteriol 2003; 185:2330-2337
29. Brett PJ, DeShazer D, Woods DE. Burkholderia thailandensis sp. nov., a Burkholderia pseudomal-lei-like species. Int J Syst Bacteriol 1998; 48
:317-320
30. Smith MD, Angus BJ, Wuthiekanun V, White NJ. Arabinose assimilation defines a nonvirulent bio-type of Burkholderia pseudomallei. Infect Immun 1997; 65:4319-4321
genomic variation in virulent and avirulent Burk-holderia species. Genome Res 2004; 14
:2295-2307
32. Hirvonen CA, Ross W, Wozniak CE, Marasco E, Anthony JR, Aiyar SE, Newburn VH, Gourse RL. Contributions of UP elements and the transcrip-tion factor FIS to expression from the seven rrn P1 promoters in Escherichia coli. J Bacteriol 2001; 183:6305-6314
33. Ross W, Salomon J, Holmes WM, Gourse RL. Activation of Escherichia coli leuV transcription by FIS. J Bacteriol 1999; 181:3864-3868 34. Wang H, Noordewier M, Benham CJ.
Stress-induced DNA duplex destabilization (SIDD) in the E. coli genome: SIDD sites are closely asso-ciated with promoters. Genome Res 2004;
14:1575-1584
35. Bauer BF, Kar EG, Elford RM, Holmes WM. Se-quence determinants for promoter strength in the leuV operon of Escherichia coli. Gene 1988;
63:123-134
36. Carver T, Thomson N, Bleasby A, Berriman M, Parkhill J. DNAPlotter: circular and linear interac-tive genome visualization. Bioinformatics 2009; 25:119-120
37. Arakawa K, Tamaki S, Kono N, Kido N, Ikegami K, Ogawa R, Tomita M. Genome Projector: zoomable genome map with multiple views. BMC Bioinformatics 2009; 10:31
38. Pritchard L, White JA, Birch PR, Toth IK. Geno-meDiagram: a python package for the visualiza-tion of large-scale genomic data. Bioinformatics 2006; 22:616-617