M E T H O D O L O G Y
Open Access
Adjusting microbiome profiles for
differences in microbial load by spike-in
bacteria
Frank Stämmler
1,2*, Joachim Gläsner
2, Andreas Hiergeist
2, Ernst Holler
3, Daniela Weber
3, Peter J. Oefner
4,
André Gessner
2and Rainer Spang
1Abstract
Background:Next-generation 16S ribosomal RNA gene sequencing is widely used to determine the relative composition of the mammalian gut microbiomes. However, in the absence of a reference, this does not reveal alterations in absolute abundance of specific operational taxonomic units if microbial loads vary across specimens.
Results:Here we suggest the spiking of exogenous bacteria into crude specimens to quantify ratios of absolute bacterial abundances. We use the 16S rDNA read counts of the spike-in bacteria to adjust the read counts of endogenous bacteria for changes in total microbial loads. Using a series of dilutions of pooled faecal samples from mice containing defined amounts of the spike-in bacteriaSalinibacter ruber,Rhizobium radiobacterandAlicyclobacillus acidiphilus, we demonstrate that spike-in-based calibration to microbial loads allows accurate estimation of ratios of absolute endogenous bacteria abundances. Applied to stool specimens of patients undergoing allogeneic stem cell transplantation, we were able to determine changes in both relative and absolute abundances of various phyla, especially the genusEnterococcus,in response to antibiotic treatment and radio-chemotherapeutic conditioning.
Conclusion:Exogenous spike-in bacteria in gut microbiome studies enable estimation of ratios of absolute OTU abundances, providing novel insights into the structure and the dynamics of intestinal microbiomes.
Keywords:Microbial load, Spike-in bacteria, 16S rRNA gene sequencing, Standardization, Microbiome profiling, Bacterial communities, Community analysis
Background
The human intestinal tract is populated by an ecological community of microorganisms, the gut microbiome. This complex community plays an important role in health and disease [1–7] and varies greatly among individuals. Next generation sequencing of the 16S rRNA gene allows profil-ing of the bacterial and archaeal components of the gut microbiome at unprecedented precision and depth [8–10]. Computational tools such as QIIME [11] and mothur [12] cluster reads into operational taxonomic units (OTUs) [13], which may then be jointed into taxonomic groups at the genus, family, order, class, and phylum level.
Current studies focus on the relative abundance or pro-portions of OTUs [14, 15]. As an example, a specific OTU may contribute 5 % to microbiome A and 10 % to micro-biome B corresponding to a ratio of 1:2. If we further as-sume that the total number of bacteria or microbial load of in A is four times larger than in B, the 5 % in A account for twice as many bacteria as the 10 % in B, thus bringing the actual ratio to 2:1.
Antibiotic treatment, diet, and/or disease affect both microbial loads and compositions. For example, Holler et al. [16] observed that the relative abundance of the genus Enterococcus in stool specimens collected from patients undergoing allogeneic stem cell transplantation (ASCT) can increase from undetectable levels prior to ASCT to up to 94 % after ASCT. More interestingly, this relative shift to Enterococcus was associated with an increased risk of acute gastrointestinal graft-versus-host * Correspondence:[email protected]
1
Chair of Statistical Bioinformatics, University of Regensburg, Am BioPark 9, 93053 Regensburg, Germany
2Institute of Clinical Microbiology and Hygiene, University Medical Centre,
Franz-Josef-Strauß-Allee 11, 93053 Regensburg, Germany Full list of author information is available at the end of the article
disease (GI-GvHD). Without knowledge of total micro-bial load, however, it is impossible to infer whether this shift was the result of either an absolute increase in the number ofEnterococcusor a decrease in the number of bacteria other thanEnterococcus.
Application of synthetic spike-in standards allows for changing the profiles’ reference points. The reference point of relative abundances is a fixed aliquot of 16S rDNA. These profiles are insensitive to the microbial load of a stool specimen. Adding controlled amounts of spike-in material allows for rescaling the profiles such that the measured concentrations of the standard are constant across samples, making the spike-in standard the new reference point of the profiles and the profiles sensitive to microbial loads. Spike-in strategies featuring different GC contents and covering a wide concentration range in combination with appropriate normalization strategies have already been proposed to correct for li-brary preparation and nuisance technical effects in the inference of gene expression levels from RNA-Seq exper-iments [17]. This approach, as well as similar schemes employed in proteomics [18] and metabolomics, [19] adds the spike-in standards to transcriptomes, pro-teomes and metabolomes only after cell lysis and extrac-tion of mRNA, proteins and metabolites, respectively, and thus do not allow correction of variation originating from these critical experimental steps. Recently Jones et al. [20] suggested using whole cell spike-in controls for monitoring this technical variability in the field of microbiome research.
Extending their results, we here suggest the addition of exogenous viable spike-in bacteria to rescale the read counts of endogenous bacteria. We call this protocol spike-in-based calibration to total microbial load (SCML), and test it in a dilution experiment with defined absolute spike-in bacteria abundances agaspike-inst serially diluted background microbiomes. Moreover, we reconsider the emergence of Enterococcus as the predominant genus in ASCT using SCML.
Results
Choice of spike - in bacteria
We used Salinibacter ruber (S. ruber, GenBank ID: CP000159), an extreme halophilic bacterium found in hypersaline environments [21], Rhizobium radiobacter (R. radiobacter, GenBank ID: ASXY01000000), a non-phytopathogenic member of the Biovar I group of Agro-bacterium found in the soil and the plant rhizosphere [22], as well as the thermo-acidophilic, endospore form-ing soil bacterium Alicyclobacillus acidiphilus (A. acidi-philus, GenBank ID: PRJDB697) [23]. These eubacteria belong to different phyla typically found in mammalian faecal microbiomes. They do not exist in the gut micro-biome under physiological conditions and are well
distinguishable from the bacteria in the gut using 16S rRNA gene sequencing. Whole bacteria are spiked-in at fixed amounts. 16S rRNA gene copy numbers per gen-ome vary between these species (1, 4 and 6 rRNA gene copies per genome for S. ruber, R. radiobacter and A. acidiphilus, respectively). We quantify spike-in concen-trations and measured concenconcen-trations relative to 16S rRNA gene copies. Hence, if we say that we spiked-in bacteria in the same amounts, this means that the num-ber of 16S rRNA copies, but not necessarily the numnum-ber of bacterial cells is identical.
Design of spike-in calibration experiments
Experiments were performed with spike-in bacteria whose absolute abundance was defined by design in increasingly diluted gut microbiomes. The dilution simulates non-constant microbial loads.
S. ruber, R. radiobacterandA. acidiphilus were spiked into each of 36 aliquots of pooled murine stool samples. WhileA. acidiphilusandR. radiobacterwere spiked into these samples at variable amounts, that of S. ruber was kept constant. S. ruber was used to measure microbial loads, whileA. acidiphilus andR. radiobacter were used to validate the SCML approach. The precision of the spike-ins was independently validated using quantitative real time PCR (qRT-PCR). Importantly, this analysis also verified that all three bacteria were in fact not present in the pooled murine stool (Additional file 1: Table S1). Additional file 2: Table S2 summarizes the design of the validation experiment.
To validate the spike-in assay we compare calibrated ratios of observed reads with the expected ratios defined by the experimental design. The experimental design controls microbial loads at several levels:
(i) For each sample, we have expected total microbial loads defined by the stool dilution factor and the spike-in concentrations. (ii) For each of the two spike-insA. acidi-philusandR. radiobacterwe have expected within-species ratios of concentrations for every pair of samples (intra-OTU comparison). (iii) For every pair of samples we have expected inter-species ratios between the two spike-ins both within and across samples (inter-OTU comparison). (iv) For all taxonomic units of the background micro-biome we have expected abundance ratios defined by the dilution factor and the spike-in concentrations.
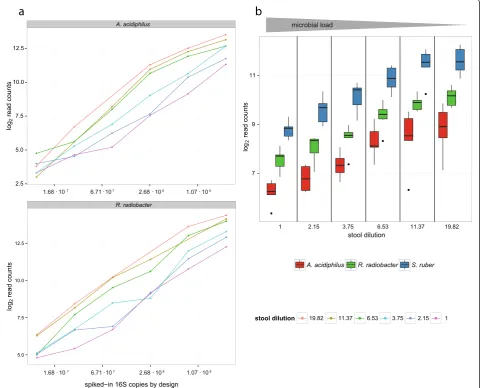
The three spike-in bacteria yield different read turnouts but correlate well with microbial loads
Figure 1a shows linear relationships between the spiked-in 16S rDNA copies (x-axis spiked-in log2scale) ofA.
acidiphi-lus and R. radiobacter, respectively, and the resulting log2read counts. The total number of spike-in reads
added to each sample, the portion of the spike-in bac-teria increases (Fig. 1b). As a result, the read count assigned to a spike-in OTU is expected to inversely cor-relate with the total microbial load.
Figure 1b shows box plots of the log2transformed read
counts ofS. ruber, R. radiobacterandA. acidiphilusas a function of microbial loads across all 36 samples. The counts were adjusted for their varying spike-in concen-trations by design. For example, if in an experiment the concentration of the A. acidiphilus spike-in was only 50 % of that of S. ruber, theA. acidiphilus counts were doubled. After adjustment ofA. acidiphilusandR. radio-bacter, we observe an inverse correlation of log2spike-in
counts with the microbial load (reciprocal dilution factor) for all three spike-in bacteria (Fig. 1b). In detail there is a correlation of r = -0.834 forS. ruber, r = -0.795 for R. radiobacter(adjusted) and r = -0.725 for A. acidi-philus(adjusted). Additionally, we observe that the three bacteria have notably different read yields, withS. ruber showing the highest counts.
SCML yields almost unbiased estimates of ratios of absolute abundances within taxonomic units
For comparing SCML to standard relative abundance analysis, we generated two data sets by scaling the read counts with respect to two different reference points:
a
b
Fig. 1Log2transformed read counts of the three spike-in bacteria as a function of total microbial load.S. ruberwas added at a constant number
of 16S rDNA copies, whileA. acidiphilusandR. radiobacterwere spiked in variably (cf. Additional file 2: Table S2).aResulting read counts ofA. acidiphilusandR. radiobacterversus spiked-in 16S rDNA copies at different background stool microbiota dilutions. Each dot represents a caecal specimen, while the colour specifies its dilution.bBoxplots showing the read counts of all three spike-in bacteria as a function of total microbial load. The log2read counts ofS. ruberare coloured blue, whileA. acidiphilusandR. radiobacterare coloured red and green, respectively. Read
counts ofA. acidiphilusandR. radiobacterwere adjusted by a factor corresponding to their difference of the predefined spike-in concentration to
First, we scaled the observed read counts relative to the library sizes. This gives us the standard relative abun-dances (standard data). In a second data set we scaled the same counts relative to the spike-in reads ofS. ruber (SCML data).
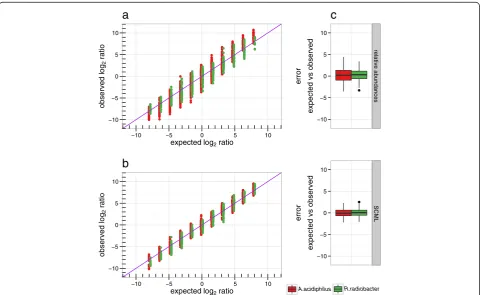
We first compared the data for A. acidiphilus and R. radiobacter separately. By design the expected ratio for A. acidiphilus and R. radiobacterbetween every pair of samples is known. Figure 2 shows the observed inter-sample ratios for both data sets as a function of expected ratios. Plot (a) was created using standard data, while plot (b) was created using SCML data. We observe a reduced systematic error in (b) when comparing the data trend to the identity line (purple). The standard data shows systematically overestimated ratios in both direc-tions. SCML reduced this bias. Moreover, we observe a high variability of estimated ratios, which was almost cut in half by SCML (Fig. 2c).
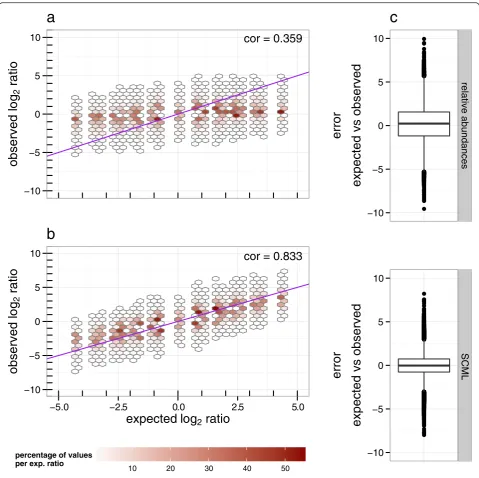
We next analysed the ratios for the background OTUs. By design, experimentally controlled ratios can be calcu-lated from the dilution factor of the background micro-biome. In contrast to A. acidiphilus and R. radiobacter
the ratios derived from relative abundances (standard data) of these OTUs is zero by experimental design. Figure 3 shows the distribution of observed background ratios as a function of corresponding expected ratios. Plot (a) was created using standard data, while plot (b) was created using SCML data. As expected, ratios of relative abundances cannot capture shifts in microbial loads that do not affect the composition (Fig. 3a). In line with the previous observations, we observe a reduction of estimation variance when using SCML (Fig. 3c). Cor-relations between expected and observed log2 ratios
were 0.359 and 0.833 for the standard data and the SCML data, respectively.
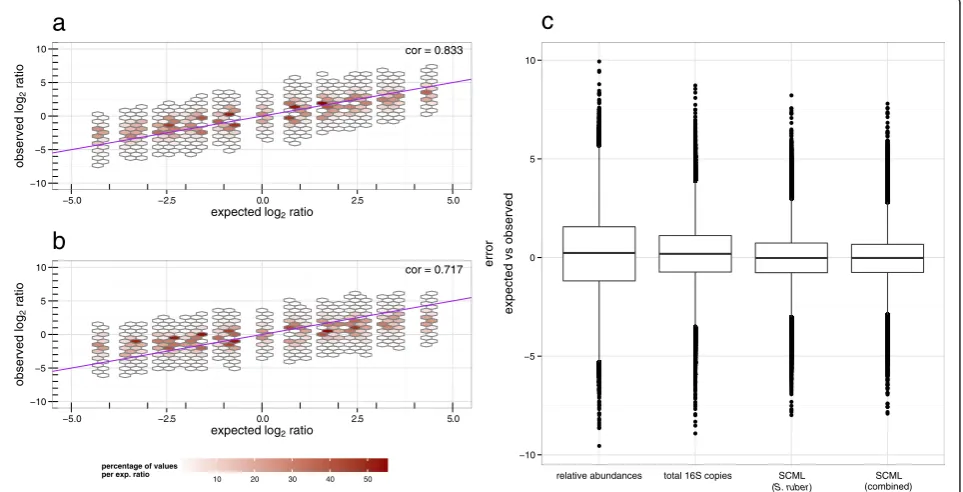
SCML allows more accurate estimation of ratios than calibrating for total 16S rRNA gene copies using qRT-PCR
Quantification of the total number of 16S rRNA gene copies by qRT-PCR may be used to determine micro-bial loads. To compare the practicability of the latter with SCML we used a SYBR Green-based qPCR assay to quantify 16S rDNA (Additional file 1: Table S1). Figure 4 shows observed and expected log2 ratios for
−10 −5 0 5 10
−10 −5 0 5 10
expected log2 ratio
observed
lo
g2
ratio
a
−10 −5 0 5 10
−10 −5 0 5 10
expected log2 ratio
observed
lo
g2
ratio
b
−10 −5 0 5 10
relative abundances
error
expected vs observed
c
−10 −5 0 5 10
SCML
error
expected vs observed
A.acidiphilus R.radiobacter
Fig. 2Comparison of log2ratios derived from relative abundances and after applying SCML toA. acidiphilusandR. radiobacter. Observed log2
ratios versus expected log2ratios of the spike-insA. acidiphilusandR. radiobacteras derived from (a) relative abundances and (b) SCML byS. ruber
for all pairwise sample comparisons. Both approaches were performed on the raw, not adjusted read counts ofA. acidiphilusandR. radiobacter. The expected log2ratios are calculated by the theoretical number of 16S rDNA copies predetermined in the design of the validation experiment
(cf. Additional file 2: Table S2). The purple diagonal represents the identity, which represents the expected log2ratios by design. The box plots in
background OTUs using either (a) SCML or (b) re-scaling to constant total 16S rRNA gene copies. It is apparent that observed ratios derived from SCML show higher concordance with the expected ratios re-garding estimation bias and variance. Correlations be-tween expected and observed log2 ratios were 0.717
and 0.833 for the qPCR and the SCML approach, re-spectively. These findings are also supported by an
overall lower error between the observed and ex-pected log2 ratios when derived from SCML (Fig. 4c).
However, it has to be acknowledged that the SYBR Green-based quantification method of the bacterial load has not been explicitly compared to probe-based formats, so any limitations/imprecisions possibly resulting from the use of this universal detection for-mat were not taken into account.
−10 −5 0 5 10
observed
lo
g
2ratio
a
−10 −5 0 5 10
−5.0 −2.5 0.0 2.5 5.0
expected log
2ratio
observed
lo
g
2ratio
b
10 20 30 40 50
percentage of values per exp. ratio
−10 −5 0 5 10
relative abundances
error
expected vs observed
c
−10 −5 0 5 10
SCML
error
expected vs observed
cor = 0.833
cor = 0.359
Fig. 3Comparison of log2ratios derived from relative abundances and after applying SCML to all background OTUs. Observed log2ratio versus
expected log2ratio of all background OTUs for all pairwise comparisons as derived from (a) relative abundances and (b) SCML byS. ruber. The
data is binned to hexagons because of the high number of data points. The colour of each hexagon represents the percentage of counts at the corresponding level of expected log2ratios contained in each bin. Bins that contributed to <0.05 % for each level of expected log2ratio are
omitted. The purple diagonal represents the identity, which represents the expected log2ratios by design. The box-plots in (c) show the error
Combining multiple spike-in bacteria reduces estimation errors
Figure 1b shows that the adjusted counts of all three spike-in bacteria reciprocally correlated with microbial loads. We next investigated whether taking the sum of all three spike-in read counts further improves the esti-mates. Since A. acidiphilus and R. radiobacter were spiked in variable amounts we had to adjust their counts prior to using them for calibration. For example, if in an experiment the concentration of the A. acidiphilus spike-in was only 50 % of that of S. ruber, the A. acidi-philus counts were doubled. We then used the sum of adjusted counts of all three spike-ins for calibration and repeated the analysis of the previous section. Figure 4c shows box-plots of the error between expected and ob-served log2ratios for background OTUs based on
rela-tive abundances, read counts normalized by total 16S rDNA copies, as well as based on the SCML data withS. ruber only and the combined counts of all three spike-ins, respectively. The smaller this error, the better cali-brated are the ratios of absolute abundances. Variances of these errors are 3.65, 2.01, 1.28 and 1.18, respectively. Thus, combined spike-ins yield a slightly increased pre-cision compared to single spike-in usage. Correlations
between expected and observed log2 ratios were 0.833
and 0.845 for the SCML and the combined SCML ap-proach, respectively.
Calibration to microbial loads reveals absolute increase of
Enterococcusin the intestine during allogeneic stem cell
transplantation
Finally, we show that SCML expands our understanding of human microbiomes and their role in disease. Recently, a marked early loss of gastrointestinal micro-biome diversity and an increase in relative abundance of members of the genusEnterococcushave been observed in the course of allogeneic stem cell transplantation (ASCT) and found to increase the risk of developing acute GI-GvHD [16, 24, 25]. Since the data had been generated without spike-in bacteria, it had not been pos-sible to conclude whether the observed increase in rela-tive abundance of Enterococcus was the result of an increase in absolute abundance of Enterococcus or of a decrease in abundance of other bacterial species.
Here we report on five patients, whose stool micro-biomes were monitored prior to ASCT or on days 0 (d0), 7 (d7), and 14 (d14) after ASCT, respectively, using the proposed spike-in approach. Figure 5a shows the
−10 −5 0 5 10
−5.0 −2.5 0.0 2.5 5.0
expected log2 ratio
observed
lo
g2
ratio
a
−10 −5 0 5 10
−5.0 −2.5 0.0 2.5 5.0
expected log2 ratio
observed
lo
g2
ratio
b
10 20 30 40 50
percentage of values per exp. ratio
cor = 0.833
cor = 0.717
−10 −5 0 5 10
relative abundances total 16S copies SCML (S. ruber)
SCML (combined)
error
expected vs observed
c
Fig. 4Comparison of SCML and normalization by qRT-PCR-derived total number of 16S rDNA copies to all background OTUs. Observed log2ratio
versus expected log2ratio of all background bacteria OTUs for all pairwise sample comparisons after (a) SCML byS. ruberand (b) normalization
by qRT-PCR derived total 16S rDNA copy number. The data is binned to hexagons because of the high number of data points. The colour of each hexagon represents the percentage of all counts at the corresponding level of expected log2ratios contained in each bin. Bins that contributed
to less than 0.05 percent for each level of expected log2ratio are omitted. The purple diagonal represents the identity, which represents the expected
log2ratios by design. The box-plots in (c) summarize the error between the expected and observed log2ratios for the four different approaches. The
smaller this error, the better calibrated the ratios are. Variances of the log2differences are 3.65, 2.01, 1.28 and 1.18 as derived from relative abundances,
familiar diagram of relative microbiome composition without taking the spike-in bacteria into consideration. Reads contributing to the genus ofEnterococcus are re-ported at genus resolution, while all other bacteria are shown on phyla resolution. In line with Holler et al. [16], we observe dramatic relative increases in Entero-coccusabundance on days 7 and 14 after ASCT in three of the five patients. By scaling read counts to an even
microbial load using the S. ruber counts, we observe marked changes in the microbial loads in the course of the treatment (Fig. 5b). Patient 5, for instance, shows an almost tenfold reduction of microbial load on day 14 after ASCT (S. ruber reads 4721) compared to pre-ASCT (S. ruber reads 515). In our study, specimens dominated byEnterococcusgenerally have low microbial loads (Fig. 5b). We also observe an absolute increase in
Fig. 5Bacterial abundances in stool specimens of ASCT patients. Specimens were collected prior to administration of prophylactic antibiotics and radio-chemotherapeutic conditioning (pre-ASCT) and on days 0, 7 and 14 after ASCT (d0, d7, d14).aMicrobial composition given as in relative abundances; (b) read counts scaled to a uniform count of the spike-inS. ruberand (c) log2ratios ofEnterococcusof the last time point to pre-ASCT of
abundance of the genus Enterococcus in these micro-biomes relative to the specimens collected before ASCT (Fig. 5c). Patients 2, 4 and 5 showed log2 ratios of
En-terococcusbetween the last and first time point of 10.93, 9.22 and 3.60, respectively, employing SCML, compared to log2ratios of 14.76, 11.46 and 8.69 based on standard
data. This suggests that Enterococcus dominance is in fact associated with both a decrease in microbial load and a rise in absolute abundance ofEnterococcus.
Discussion
Here we suggest the use of spike-in bacteria to calibrate multiple intestinal microbiome profiles to microbial loads (SCML). We employedA. acidiphilus,R. radiobac-ter and S. ruber as spike-in bacteria and demonstrated their excellent suitability for a comprehensive and in-formative profiling of gut microbiomes. Usually, these three bacteria are absent in the intestinal microbiomes of mammals, and their unique 16S rRNA gene sequences cannot be mistaken for those of bacteria found in the gastrointestinal tract. All three bacteria are valid reporters of the actual microbial load. Thus SCML adds a new perspective to gut microbiome profiling that expands the common relative microbiome composition analysis.
Variability in microbial loads of intestines is a genuine and potentially clinically relevant biological feature that remains underutilised in standard protocols. On a more technical side, adding whole cells prior to lysis enables control for DNA recovery and pyrosequencing errors as a side benefit. Following this, the addition of exogenous spike-ins could also enhance other studies like whole-genome sequencing, qPCR-based quantification of path-ogens as well as approaches using alternative marker genes [20, 26, 27].
Bacterial species compete for nutrients and can mutu-ally displace each other, while others can only live in symbiosis. These dynamics of the intestinal ecosystem shape the structure of microbiome profiles [28, 29]. Mu-tually displacing, e.g. concurrent or antagonistic, species display anti-correlated profiles, while those of symbiotic species are correlated [30]. This theoretical consider-ation holds true for absolute numbers of bacteria. Inter-preting the correlation structure on the basis of relative numbers can be misleading. If one species grows in ab-solute number, this will lead (i) to an increase of its frac-tion within the microbiome and (ii) to a decrease of the fractions of all other species. Hence, every change of a single species affects relative counts for all other species generating notorious anti-correlation between profiles of different species due to compositionality [31, 32]. Im-portantly, this effect is independent of ecological pro-cesses like displacement and symbiosis. Thus, profiles calibrated to ratios of total microbial loads provide a less
disturbed assessment of the dynamics of the intestinal ecosystem.
We observed different sequence read yields for the three spike-in bacteria even upon addition of identical numbers of 16S rDNA gene copies to mouse faeces sharing the same microbial load. Fortunately, this prob-lem should only arise with comparisons of different spe-cies. As demonstrated, it does not affect the estimation of intra-species ratios between samples, where species-specific yields cancel.
There is a difference between absolute quantification and calibration of ratios of absolute abundances. The former needs calibration to a defined unit such as bac-teria per volume. External spike-ins do not enable abso-lute quantification due to e.g. variable lysis efficiency across intestinal bacteria and variable 16S rDNA copy numbers. In ratios the unit cancels. Hence, if in a com-parison of the same OTU in two samples SCML cali-brated values show a ratio of 2, then the OTU is in fact represented (almost) twice as often. With standard rela-tive data this is not the case, when microbial loads in these samples differ. Importantly, ratios between differ-ent OTUs are not calibrated by SCML. We can thus calibrate microbiome profiles to ratios of absolute abun-dance but not to absolute quantities of bacteria themselves.
A drawback of the spike-in approach is the propaga-tion of PCR amplificapropaga-tion errors from the spike-in bac-terium to all other taxonomic units. Indeed, the spike-in counts can be affected by PCR amplification or sequen-cing errors. The earlier these errors occur, the more they could influence the final read tallies. By using these reads to calibrate microbial ratios, this error-derived variance propagates to all other taxonomic units. The calibration reduces bias, but inflates variance. One may attenuate this undesired effect by using multiple spike-in bacteria of fixed concentrations across samples and aver-aging or summing their counts as shown here.
Conclusion
Methods
Spike-in bacteria
In this study we usedSalinibacter ruber DSM 13855T, an extreme halophilic bacterium found in hypersaline envi-ronments [21], Rhizobium radiobacter DSM 30147T, a non-phytopathogenic member of the Biovar I group of Agrobacterium found in soil and the plant rhizosphere [22], as well as the thermo-acidophilic, endospore forming soil bacterium Alicyclobacillus acidiphilus DSM 14558T [23]. All bacteria were purchased from the DSMZ (German Collection of Microorganisms and Cell Cultures GmbH, Braunschweig, Germany). These eubacteria belong to different phyla typically found in mammalian faecal microbiomes, contributing to Bacteroidetes/Chlor-obi group, Proteobacteria, and Firmicutes, respectively. They do not exist in the gut microbiome under physio-logical conditions and are well distinguishable from bac-teria commonly found in the gut using 16S rRNA gene sequencing.S. ruberandR. radiobacterare gram-negative bacteria, whereasA. acidiphilusis a spore-forming gram-positive bacterium. The difference in the chemical consti-tution of the cell wall accounts for a specific susceptibility to the cell lysis protocol used. Spike-in bacteria were har-vested in the late logarithmic/early stationary growth phase by centrifugation and subsequently resuspended in 5 ml of sterile PBS buffer. Bacterial densities in suspen-sions were quantified by OD600 measurement using em-pirical conversion factors determined by direct microscopic cell counting. Accordingly, 1 OD600 unit cor-responds to 4.6 x 10⁹cells/ml forS. ruber, 1.4 x 10⁹cells/ ml forR. radiobacter, and 1.2 x 10⁹cells/ml forA. acidi-philus, respectively. 16S rRNA gene copy numbers per genome for the spike-in bacteria were obtained from the rrnDB database [33]. Six pools of bacterial mock commu-nities containingS. ruber,R. radiobacterandA. acidiphi-lus were generated according to the scheme provided in Additional file 3: Table S3.
Sample preparation and DNA extraction
Mouse specimens
For the validation experiment, cecum contents were collected from three 12-week-old male C57BL/6J mice (200 mg wet weight each), immediately suspended into 1 ml of PBS, homogenized by means of the Tis-sueLyser II (QIAGEN, Hilden, Germany), pooled, ad-justed with PBS to a total volume of 4 ml, and split into seven aliquots of 550 μl each. Six of these ali-quots were diluted five times according to the scheme provided in Additional file 2: Table S2. Aliquot 7 was used as a non-spike control.
Sixty microliters of the corresponding spike-bacteria pool (whole cells) containing the desired number of 16S rDNA copies (see Additional file 3: Table S3) were added to 250 μl of all prepared, unlysed stool dilutions (see
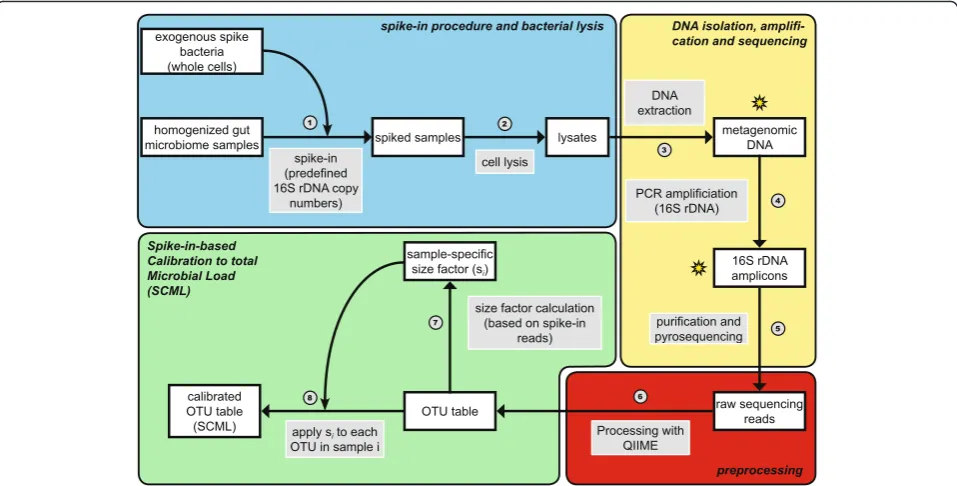
Fig. 6, step 1) according to the scheme provided in Additional file 2: Table S2. Then, 180 μl of Bacterial Lysis Buffer (Roche, Mannheim, Germany) and 20 μl Proteinase K (Fermentas GmbH, Sankt Leon-Rot, Germany) were added. Samples were incubated at 65 °C for 10 min followed by five cycles of freezing in liquid nitrogen (1 min) and boiling in hot water (95 °C, 1 min). Following the addition of 400μl of Bacterial Lysis Buffer and a mixture of 0.1-mm and 2.5-mm beads, samples were treated for 2 min at 30 Hz in the TissueLyser II. Subsequently, samples were heated at 95 °C for 15 min and centrifuged at 4 °C to pellet stool particles and beads (see Fig. 6, step 2). The final volume was adjusted to 1 ml and DNA was extracted (see Fig. 6, step 3) by means of the MagNA Pure 96 instrument employing the MagNA Pure 96 DNA and Viral NA Large Volume Kit (Roche). Nucleic acids were quantified using the Nano-Drop ND-1000 (Thermo Scientific, Wilmington, DE, USA).
Human ASCT specimens
With approval of the Ethics Committee of the University Medical Centre of Regensburg and after receipt of signed informed consent forms, stool specimens were collected at four different time points: prior to administration of prophylactic antibiotics and radio-chemotherapeutic con-ditioning, on days 0, 7, and 14, respectively, after ASCT. Stool specimens were stored at -80 °C until analysis. Fifty mg (wet weight) of each stool specimen were suspended into 250 μl PBS and subsequently subjected to DNA ex-traction as described above. Spiking of A. acidiphilus, S. ruber and R. radiobacter, and 454-pyrosequencing were performed according to the validation protocol described above. For these experiments, bacterial cells ofS. ruber,R. radiobacterandA. acidiphilusequal to 3.0 x10⁸, 5.0x10⁸, 1.0x10⁸ 16S rDNA copies, respectively, were spiked into each crude sample.
Amplification of V3-V6 16S rDNA variable region and 454 pyrosequencing
Spike bacteria-specific qPCR was performed for all speci-mens (mice and human) to identify errors in DNA isola-tion before undergoing amplificaisola-tion and pyrosequencing (see Fig. 6).
A total of 25 ng metagenomic DNA was used as a tem-plate to amplify the V3-V6 variable regions of the 16S rRNA gene. PCR was performed using primer pair 341 F-1061R containing Lib-L adaptors and Roche standard mulitiplex identifiers (MIDs) in a final volume of 40 μl containing 0.088μM of each primer, 2 mM MgCl2, and 1
extension step (7 min at 72 °C). The resulting 790-bp amplicons were analysed by standard agarose gel elec-trophoresis on a 1.5 % (w/v) gel. The amplicons were extracted from agarose gels using the QIAquick Gel Extraction Kit (Qiagen, Hilden, Germany) and purified with Agencourt AMPure XP beads (Beckman Coulter, Krefeld, Germany). Copy numbers of amplicons con-taining LibL-adaptors were determined using the KAPA Library Quant 454 Titanium/Lib-L Universal Kit (KAPA Biosystems, Wilmington, DE, USA) and pooled to a normalized library with a concentration of 1 x 10⁷ adaptor-labeled amplicon molecules/μl for each sample. This library was subjected to sequencing (see Fig. 6, step 5) using the GS FLX+ system (454/ Roche) and the GS FLX Titanium LV emPCR Kit (Lib-L) applying 0.4 copies per bead. Sequencing was performed on a full PTP according to manufacturer’s protocol using the GS-FLX Titanium Sequencing Kit XL+ and the acyclic flow pattern B. Sequencing raw data was processed with gsRunProcessor v2.9 (Roche) using quality filtering as defined by the default Long-Amplicons 3 pipeline resulting in 895 Mb from
1,313,653 passed filter wells with a median read length of 706 bases.
Quantification of 16S rRNA gene copy number by qRT-PCR
Primer design and validation
Primers and probes for quantification of eubacterial 16S rDNA copies (Additional file 4: Table S4) were designed and evaluated in silico based on the RefNR sequence collection of the SILVA reference database release 119 [34] containing 534,968 16S rRNA sequences. The over-all SILVA database coverage of universal 16S rDNA quantification primers 764 F and 907R allowing one primer mismatch was 86 %. Allowing no primer mismatches, specificity of primers and probes targeting S. ruber, R. radiobacter and A. acidiphilus DNA exhib-ited specificities of 100 %. Specificity of primers and probes were further evaluated in silico using the blastn algorithm against the nucleotide collection (nt) database. Concentration of primers were optimized by titration in the range of the kit manufacturer’s recommendations after PCR amplification of 16S rDNA targets from DNA extracts of human and murine faecal specimens.
Fig. 6Procedural overview of proposed spike-in procedure and the spike-in-based calibration to total microbial load (SCML). The overview is divided into four sections: in procedure and bacterial lysis (blue), DNA isolation, amplification and sequencing (yellow), pre-processing (red) and the actual spike-in-based calibration to microbial load (green). White-filled boxes depict procedural intermediates, while grey-filled boxes depict the different procedural steps. Each step is numbered. In the first step (1) whole cells of exogenous spike bacteria corresponding to a fixed number of 16S rDNA copies are added to homogenized microbiome samples. Bacterial lysis is performed on the resulting spiked samples (2). Metagenomic DNA is extracted from the lysates (3) and PCR amplified using 16S rDNA specific primers (4), creating 16S rDNA amplicons. These amplicons are purified and pyrosequencing is performed (5). The resulting raw read counts are pre-processed with QIIME (quality filtering, demultiplexing and closed reference OTU picking) to generate OTU read count tables (6). Based on the read counts associated with single or multiple reference spike-in bacteria, a size factor sifor each sample i is calculated and
Samples were spiked prior to DNA extraction with de-fined cell counts ofS. ruber, R. radiobacterand A. acidi-philus, which were quantified microscopically using a modified Neubauer counting chamber. PCR products were screened for nonspecific bands by agarose gel elec-trophoresis (probe based assays) or agarose gel and melt-ing curve analysis (SYBR Green I based assays). Specificity was further evaluated by quantitative real-time PCR amplification of total 16S rDNA and 16S rDNA of spike-in bacteria from ten non-spiked murine and human DNA extracts.
Quantification of total 16S rDNA
To verify the experimental design, 16S rRNA gene cop-ies of total and spike-in bacteria were determined by qRT-PCR on a LightCycler 480 II Instrument (Roche). Primers and probes used are shown in Additional file 4: Table S4. PCR reactions included 1 μM each of eubac-terial 16S rRNA gene primers 764 F and 907R (quantifi-cation primers) and the LightCycler 480 SYBR Green I Master Kit (Roche). Quantification standards were gen-erated by cloning complex PCR amplicon mixtures that were generated from a caecal microbiome DNA prepar-ation of wild type C57BL/6J mice (using primers 341 F and 1061R) into the pGEM-T.Easy vector (Promega, Madison, WI, USA). Cloning of PCR amplicon mixtures was carried out to mimic a complex murine microbiota with respect to qPCR amplification efficiency in analyzed samples as far as possible. Quantification PCR was con-ducted over 40 cycles (95 °C for 10s, 60 °C for 15 s and 72 °C for 15 s) with an initial 10-min hot start at 95 °C.
Quantification of 16S rDNA of spike-in bacteria
16S rRNA gene copy numbers of the spike-in bacteria S. ruber, R. radiobacterand A. acidiphiluswere determined with 16S rDNA-targeted species-specific primers and hy-drolysis probes (see Additional file 4: Table S4). Quantifi-cation PCR was conducted using the LightCycler 480 Probes Master kit (Roche) in a 20-μl reaction volume con-taining 4 mM MgCl2, 0.25μM of each primer, and 0.1μM
probes. Quantification standards were constructed by cloning full length 16S PCR amplicons of all spike-in bac-teria (amplified using 27 F and 1492R primers) into pGEM-T.Easy. Quantification PCR was conducted over 40 cycles (95 °C for 30s, 60 °C for 30 s and 72 °C for 30s) with an initial 10-min hot start at 95 °C.
Computational analysis
We used a combination of QIIME [11] (v1.8.0) and R version 3.2.0 [35] with installed Bioconductor package [36] to process the read data. Reads were filtered for quality using QIIME’ssplit_libraries.pyscript (see Fig. 6, step 6) with default parameters except minimum and maximum read length, which were set to 400 bp and
800 bp, respectively. This read length threshold covered 99.99 % of all sequencing reads. The filtered reads were mapped to OTUs built on the SILVA [34] database (re-lease 111) using QIIME’s pick_closed_reference_otus.py script (see Fig. 6, step 6) with default parameters. The reference database OTUs used here constituted compu-tationally built clusters of the SILVA SSU (small subunit) ribosomal RNA database. The clustering (see Fig. 6, step 6) was achieved by UCLUST 1.2.20 [37] and provided by the QIIME team (available at http://qiime.org/home_-static/dataFiles.html). Since reads from the three spike-in bacteria mapped to multiple OTUs, due to multiple reference OTUs encoding for the same spike-in genus, we deleted all but one OTU encoding for each spike-in from the database before mapping, to accumulate all reads from the spike-in to just this one OTU. The used reference sequences for these three OTUs are available in Additional file 5. Raw sequencing data of the dilution experiment is deposited in the European Nucleotide Archive (ENA) under the study accession number PRJEB11953, at http://www.ebi.ac.uk/ena/data/view/ PRJEB11953. Details of the sample design are shown in Additional file 2: Table S2. Relative abundances were cal-culated by dividing each OTU read count by total read count of the corresponding sample.
Ratios of absolute abundances were calculated by using the expectation that the counts of reference spike-ins are inversely correlated to total microbial load of the samples under investigation. Let s be the mean read count of the reference spike-in S. ruberover all samples (see Fig. 6, step 7). The read count of every OTU in a samplei is rescaled by a factor si that is calibrated such
that the spike-in count is equal tos in every sample (see Fig. 6, step 8). SCML can be performed by the use of an individual spike-in bacterium or the sum of all reads ob-tained for multiple spike-in bacteria. For further analysis, the counts are log2transformed.
To compare ratios derived from relative abundances and those derived by SCML, we calculate log2ratios
be-tween every pair of samples for each method as a sym-metrical measure of difference. Ratios of relative abundances are calculated by dividing the relative abun-dances of each OTU by its relative abundance in the compared sample, whereas ratios for SCML are calcu-lated by means of the spike-in calibrated read counts (SCML data). If for example OTU A shows relative abundances of 20 % and 40 % in samples 1 and 2, respectively, the corresponding ratio for this comparison would be 0.4/0.2 = 2, i.e. the abundance of OTU A in sample 2 is two times higher than in sample 1. The cor-responding log2 ratio would be log2 (2) = 1. Both ratios
are calculated separately for each OTU.
adjusted by their difference in the predefined spike-in concentration (Additional file 2: Table S2) towards S. ruber. If for exampleA. acidiphiluswas added by design in half the concentration compared to S. ruber, then all reads byA. acidiphiluswere multiplied by two. The ad-justed read counts of A. acidiphilus, R. radiobacterand the raw read counts ofS. ruberwere summed up to one artificial entity. These summed reads were used in the same fashion as the S. ruber read counts in the single spike-in calculation. For the dilution experiment the ad-justment of A. acidiphilus and R. radiobacter read counts was necessary, because both spike-ins were added in varying amounts in this experiment. In an application of our spike-in procedure (e.g. ASCT specimens in this study) all spike-in bacteria cells are added at fixed amounts. Therefore, an adjustment of the spike-in read counts before the combination would be obsolete.
Additional files
Additional file 1: Table S1:Species-specific and total 16S rDNA quantitative realtime-PCR measurements. (XLSX 13 kb)
Additional file 2: Table S2:Design of dilution experiment. (XLSX 16 kb)
Additional file 3: Table S3:Pools of bacterial mock communities containingS. ruber,A. acidiphilusandR. radiobacter. (XLSX 13 kb)
Additional file 4: Table S4:Primers and hydrolysis probes used in this study. (XLSX 13 kb)
Additional file 5:16S rDNA reference sequences ofS. ruber,A. acidiphilusandR. radiobacter. (FASTA 4 kb)
Additional file 6:R-Script for reproduction of analysis and figures of this study. (R 39 kb)
Additional file 7:Dilution experiment mapping file as used for reproduction. (TXT 3 kb)
Additional file 8:ASCT experiment mapping file as used for reproduction. (TXT 1 kb)
Additional file 9:Dilution experiment OTU table as used for reproduction. (TXT 460 kb)
Additional file 10:ASCT experiment OTU table as used for reproduction. (TXT 621 kb)
Additional file 11:Total 16S rDNA qRT-PCR measurements as used for reproduction. (CSV 1 kb)
Additional file 12:Spike-in concentrations by design as used for reproduction. (CSV 1 kb)
Abbreviations
A. acidiphilus,Alicyclobacillus acidiphilus;ASCT, allogeneic stem cell transplantation; GI-GvHD, gastrointestinal graft-versus-host disease; OTU, operational taxonomic unit; qRT-PCR, quantitative real-time polymerase chain reaction;R. radiobacter,Rhizobium radiobacter; S. ruber,Salinibacter ruber;
SCML, spike-in-based calibration to microbial load
Acknowledgements
The authors acknowledge the excellent assistance of Nadja Reul, Claudia Deinzer, Christine Irtenkauf and Holger Melzl with all experimental procedures.
Funding
FS, RS, AG, JG and AH received core funding support by the DFG priority program SPP 1656 from the German Research Foundation. EH and DW were partially supported by the Regensburg Centre for Interventional Immunology (RCI).
Availability of data and materials
Quantitative realtime-PCR measurements are shown in Additional file 1: Table S1. Additional file 2: Table S2 illustrates the design of the dilution experiment. A table with the six different spike-in pools is provided in Additional file 3: Table S3. Primers and hydrolysis probes used in this study, as well as their references, are listed in Additional file 4: Table S4. Additional file 5 contains the used 16S reference sequences of all three spike-in bacteria. A docu-mented R-script and the data needed to reproduce figures and analyses are provided in Additional files 6, 7, 8, 9, 10, 11 and 12, respectively. Raw sequencing data of both dilution experiment and human ASCT specimens is deposited in the European Nucleotide Archive (ENA) under the study accession number PRJEB11953, at http://www.ebi.ac.uk/ena/data/view/PRJEB11953.
Authors’contributions
FS, RS, AG, AH and JG designed the validation experiment and the spike-in protocol. Acquisition and processing of the mice samples for the validation experiment were performed by JG. AH performed qRT-PCR measurements and sequencing. EH and DW collected the human stool specimens and provided clinical information. FS performed the bioinformatics analysis and prepared the figures. FS, RS, PJO, JG and AH wrote the manuscript. All authors read and approved the final manuscript.
Competing interests
The authors declare that they have no competing interests.
Consent for publication
All patients consented in writing to the disclosure and publication of de-identified data.
Ethics approval and consent to participate
Mice
All mice were maintained under specific pathogen–free conditions at the central animal laboratories of the University Medical Centre of Regensburg. Experiments were carried out according to the EU Directive 2010/63/EU on the protection of animals used for scientific purposes as well as to the institutional guidelines for animal welfare.
Human
Sampling of human stool specimens, microbiome analysis and collection of clinical data has been approved by the Local Ethical Committee of the University Medical Centre of Regensburg (ethics application numbers: 02/220 and 09/059). All patients gave written informed consent prior to admission to ASCT.
Author details
1Chair of Statistical Bioinformatics, University of Regensburg, Am BioPark 9,
93053 Regensburg, Germany.2Institute of Clinical Microbiology and Hygiene, University Medical Centre, Franz-Josef-Strauß-Allee 11, 93053 Regensburg, Germany.3Department of Haematology and Oncology, Internal Medicine III, University Medical Centre, Franz-Josef-Strauß-Allee 11, 93053 Regensburg, Germany.4Chair and Institute of Functional Genomics, University of Regensburg, Am BioPark 9, 93053 Regensburg, Germany.
Received: 14 December 2015 Accepted: 2 June 2016
References
1. Walker A, Pfitzner B, Neschen S, Kahle M, Harir M, Lucio M, et al. Distinct signatures of host-microbial meta-metabolome and gut microbiome in two C57BL/6 strains under high-fat diet. ISME J. 2014;8(12):2380–96. doi:10.1038/ ismej.2014.79.
2. Buffie CG, Pamer EG. Microbiota-mediated colonization resistance against intestinal pathogens. Nat Rev Immunol. 2013;13(11):790–801. doi:10.1038/nri3535.
3. Chung H, Pamp SJ, Hill JA, Surana NK, Edelman SM, Troy EB, et al. Gut immune maturation depends on colonization with a host-specific microbiota. Cell. 2012;149(7):1578–93. doi:10.1016/j.cell.2012.04.037. 4. Haberman Y, Tickle TL, Dexheimer PJ, Kim MO, Tang D, Karns R, et al.
5. Kostic AD, Xavier RJ, Gevers D. The microbiome in inflammatory bowel disease: current status and the future ahead. Gastroenterology. 2014;146(6): 1489–99. doi:10.1053/j.gastro.2014.02.009.
6. Iida N, Dzutsev A, Stewart CA, Smith L, Bouladoux N, Weingarten RA, et al. Commensal bacteria control cancer response to therapy by modulating the tumor microenvironment. Science. 2013;342(6161):967–70. doi:10.1126/ science.1240527.
7. Klimesova K, Kverka M, Zakostelska Z, Hudcovic T, Hrncir T, Stepankova R, et al. Altered gut microbiota promotes colitis-associated cancer in IL-1 receptor-associated kinase M-deficient mice. Inflamm Bowel Dis. 2013;19(6): 1266–77. doi:10.1097/MIB.0b013e318281330a.
8. Huse SM, Dethlefsen L, Huber JA, Welch DM, Relman DA, Sogin ML. Exploring Microbial Diversity and Taxonomy Using SSU rRNA Hypervariable Tag Sequencing. PLoS Genet. 2008;4(11):e1000255. doi:10. 1371/journal.pgen.1000255.
9. Claesson MJ, Wang Q, O’Sullivan O, Greene-Diniz R, Cole JR, Ross RP, et al. Comparison of two next-generation sequencing technologies for resolving highly complex microbiota composition using tandem variable 16S rRNA gene regions. Nucleic Acids Res. 2010;38(22):e200. doi:10.1093/nar/gkq873. 10. Ong SH, Kukkillaya VU, Wilm A, Lay C, Ho EX, Low L, et al. Species
identification and profiling of complex microbial communities using shotgun Illumina sequencing of 16S rRNA amplicon sequences. PLoS ONE. 2013;8(4):e60811. doi:10.1371/journal.pone.0060811.
11. Caporaso JG, Kuczynski J, Stombaugh J, Bittinger K, Bushman FD, Costello EK, et al. QIIME allows analysis of high-throughput community sequencing data. Nat Methods. 2010;7(5):335–6. doi:10.1038/nmeth.f.303.
12. Schloss PD, Westcott SL, Ryabin T, Hall JR, Hartmann M, Hollister EB, et al. Introducing mothur: open-source, platform-independent, community-supported software for describing and comparing microbial communities. Appl Environ Microbiol. 2009;75(23):7537–41. doi:10.1128/AEM.01541-09. 13. Blaxter M, Mann J, Chapman T, Thomas F, Whitton C, Floyd R, et al. Defining
operational taxonomic units using DNA barcode data. Philos Trans R Soc Lond Ser B Biol Sci. 2005;360(1462):1935–43. doi:10.1098/rstb.2005.1725. 14. Turnbaugh PJ, Ridaura VK, Faith JJ, Rey FE, Knight R, Gordon JI. The
effect of diet on the human gut microbiome: a metagenomic analysis in humanized gnotobiotic mice. Sci Transl Med. 2009;1(6):6ra14. doi:10. 1126/scitranslmed.3000322.
15. Koren O, Knights D, Gonzalez A, Waldron L, Segata N, Knight R, et al. A guide to enterotypes across the human body: meta-analysis of microbial community structures in human microbiome datasets. PLoS Comput Biol. 2013;9(1):e1002863. doi:10.1371/journal.pcbi.1002863.
16. Holler E, Butzhammer P, Schmid K, Hundsrucker C, Koestler J, Peter K, et al. Metagenomic analysis of the stool microbiome in patients receiving allogeneic stem cell transplantation: loss of diversity is associated with use of systemic antibiotics and more pronounced in gastrointestinal graft-versus-host disease. Biol Blood Marrow Transplant. 2014;20(5):640–5. doi:10. 1016/j.bbmt.2014.01.030.
17. Risso D, Ngai J, Speed TP, Dudoit S. Normalization of RNA-seq data using factor analysis of control genes or samples. Nat Biotechnol. 2014;32(9):896– 902. doi:10.1038/nbt.2931.
18. Geiger T, Wisniewski JR, Cox J, Zanivan S, Kruger M, Ishihama Y, et al. Use of stable isotope labeling by amino acids in cell culture as a spike-in standard spike-in quantitative proteomics. Nat Protoc. 2011;6(2):147–57. doi:10.1038/nprot.2010.192.
19. Wu L, Mashego MR, van Dam JC, Proell AM, Vinke JL, Ras C, et al. Quantitative analysis of the microbial metabolome by isotope dilution mass spectrometry using uniformly 13C-labeled cell extracts as internal standards. Anal Biochem. 2005;336(2):164–71. doi:10.1016/j.ab.2004.09.001.
20. Jones MB, Highlander SK, Anderson EL, Li W, Dayrit M, Klitgord N, et al. Library preparation methodology can influence genomic and functional predictions in human microbiome research. Proc Natl Acad Sci U S A. 2015; 112(45):14024–9. doi:10.1073/pnas.1519288112.
21. Anton J, Oren A, Benlloch S, Rodriguez-Valera F, Amann R, Rossello-Mora R. Salinibacter ruber gen. nov., sp. nov., a novel, extremely halophilic member of the Bacteria from saltern crystallizer ponds. Int J Syst Evol Microbiol. 2002; 52(Pt 2):485–91. doi:10.1099/00207713-52-2-485.
22. Zhang L, Li X, Zhang F, Wang G. Genomic analysis of Agrobacterium radiobacter DSM 30147(T) and emended description of A. radiobacter (Beijerinck and van Delden 1902) Conn 1942 (Approved Lists 1980) emend. Sawada et al. 1993. Stand Genomic Sci. 2014;9(3):574–84. doi:10. 4056/sigs.4688352.
23. Matsubara H, Goto K, Matsumura T, Mochida K, Iwaki M, Niwa M, et al. Alicyclobacillus acidiphilus sp nov., a novel thermo-acidophilic, omega-alicyclic fatty acid-containing bacterium isolated from acidic beverages. Int J Syst Evol Microbiol. 2002;52(Pt 5):1681–5. doi:10.1099/ijs.0.02169-0. 24. Jenq RR, Ubeda C, Taur Y, Menezes CC, Khanin R, Dudakov JA, et al.
Regulation of intestinal inflammation by microbiota following allogeneic bone marrow transplantation. J Exp Med. 2012;209(5):903–11. doi:10.1084/ jem.20112408.
25. Weber D, Oefner PJ, Hiergeist A, Koestler J, Gessner A, Weber M, et al. Low urinary indoxyl sulfate levels early after transplantation reflect a disrupted microbiome and are associated with poor outcome. Blood. 2015;126(14): 1723–8. doi:10.1182/blood-2015-04-638858.
26. Brukner I, Longtin Y, Oughton M, Forgetta V, Dascal A. Assay for estimating total bacterial load: relative qPCR normalisation of bacterial load with associated clinical implications. Diagn Microbiol Infect Dis. 2015;83(1):1–6. doi:10.1016/j.diagmicrobio.2015.04.005.
27. Amend AS, Seifert KA, Bruns TD. Quantifying microbial communities with 454 pyrosequencing: does read abundance count? Mol Ecol. 2010;19(24): 5555–65. doi:10.1111/j.1365-294X.2010.04898.x.
28. Costello EK, Stagaman K, Dethlefsen L, Bohannan BJ, Relman DA. The application of ecological theory toward an understanding of the human microbiome. Science. 2012;336(6086):1255–62. doi:10.1126/science.1224203. 29. Cho I, Blaser MJ. The human microbiome: at the interface of health and
disease. Nat Rev Genet. 2012;13(4):260–70. doi:10.1038/nrg3182. 30. Walter J, Ley R. The human gut microbiome: ecology and recent
evolutionary changes. Annu Rev Microbiol. 2011;65:411–29. doi:10.1146/ annurev-micro-090110-102830.
31. Aitchison J. A New Approach to Null Correlations of Proportions. J Int Ass Math Geol. 1981;13(2):175–89. doi:10.1007/Bf01031393.
32. Aitchison J. The Statistical-Analysis of Compositional Data. J Roy Stat Soc B Met. 1982;44(2):139–77.
33. Stoddard SF, Smith BJ, Hein R, Roller BR, Schmidt TM. rrnDB: improved tools for interpreting rRNA gene abundance in bacteria and archaea and a new foundation for future development. Nucleic Acids Res. 2015;43(Database issue):D593–8. doi:10.1093/nar/gku1201.
34. Quast C, Pruesse E, Yilmaz P, Gerken J, Schweer T, Yarza P, et al. The SILVA ribosomal RNA gene database project: improved data processing and web-based tools. Nucleic Acids Res. 2013;41(Database issue):D590– 6. doi:10.1093/nar/gks1219.
35. RCoreTeam. R: A Language and Environment for Statistical Computing. Vienna: R Foundation for Statistical Computing; 2015. http://www.r-project.org. Accessed 10 Dec 2015.
36. Huber W, Carey VJ, Gentleman R, Anders S, Carlson M, Carvalho BS, et al. Orchestrating high-throughput genomic analysis with Bioconductor. Nat Methods. 2015;12(2):115–21. doi:10.1038/nmeth.3252.
37. Edgar RC. Search and clustering orders of magnitude faster than BLAST. Bioinformatics. 2010;26(19):2460–1. doi:10.1093/bioinformatics/btq461.
• We accept pre-submission inquiries
• Our selector tool helps you to find the most relevant journal
• We provide round the clock customer support
• Convenient online submission
• Thorough peer review
• Inclusion in PubMed and all major indexing services
• Maximum visibility for your research
Submit your manuscript at www.biomedcentral.com/submit