Available online at http://ijdea.srbiau.ac.ir Int. J. Data Envelopment Analysis (ISSN 2345-458X)
Vol.5, No.4, Year 2017 Article ID IJDEA-00422, 10 pages Research Article
Entropy based Malmquist Productivity Index
in Data Envelopment Analysis
R. Fallahnejad
*Department of mathematics, Khorramabad branch, Islamic Azad University,
Khorramabad, Iran
Received 18 April 2017, Accepted 29 July 2017
Abstract
Malmquist Productivity Index (MPI) is one of the most famous indices, which is used for estimating the productivity change of a Decision Making Unit (DMU) during the time. Virtually any empirical study that uses MPI, reports average of the productivity indices they estimate to represent the overall tendency in productivity changes. In such a case, productivity indices of a DMU are considered with equal value. In this paper, we propose using the entropy of productivity indices of all DMUs at a specific part of time as the weight of indices of that in aggregating the indices during the under study time section. Then, we use the proposed method for an empirical study of 18 Iranian companies manufacturing automobiles and automobile parts, which have been accepted in Tehran Stock Exchange.
Keywords: Data Envelopment Analysis, Entropy, Malmquist Productivity Index.
*. Email: [email protected]
1426
1. Introduction
The computation of productivity change is an important part of any empirical analysis related to productivity and efficiency measurement. The framework in this study is that of data envelopment analysis (DEA). DEA is a methodology for measuring the relative efficiencies of a set of decision making units (DMUs) that use multiple inputs to produce multiple outputs. First introduced by Charnes et al. [2], DEA constructs an empirically based efficient frontier as a result of identifying a set of efficient and inefficient DMUs. In general, DEA studies consider performance analysis for a particular year. However, the method can be used to analyze performances over several years using procedures such as Malmquist Productive Index (MPI). MPI allows explicit calculation and isolation of changes in efficiency. MPI was originally developed by Malmquist [9] and later, Caves et al [3] developed it and gave it an economic interpretation within the context of production theory.
Since the productivity index is based on discrete time, each DMU will have an index for every sequential pair of times. At empirical studies, the average of the productivity indices of sequential times is consider to represent the overall tendency in productivity changes of DMUs over time period. One problem with the average is the implicit assumption that all sectional indices equally affect the level of productivity. This manipulation may lead to distorted productivity change measurement. To the authors’ knowledge, no algorithm has been proposed in recent years for reducing the equal-weight effect of productivity indices of different times. In this study, we introduce the entropy concept to aggregate the Malmquist indices for eliminating the equal-weight effect.
Entropy concept is being used in a few DEA papers. Hsiao et al. [1] proposed a method for calculating the weighting
measurements in order to deal with the problem of the distorted efficiency using the concept of entropy. Wu et al. [8] instead of calculating the average cross efficiency scores used Shannon entropy to determine the weights for ultimate cross efficiency scores. Xie et al. [11] used entropy to calculate the degree of the importance of DEA efficiencies for all possible subsets of input and outputs variables in order to obtain an efficiency score which could better discriminate DMUs.
The remainder of this paper is as follows. Section 2 presents the preliminaries, i.e. DEA and the Malmquist productivity indices. Section 3 presents the entropy based MPI. Section 4 provides an empirical example. Concluding remarks are given in Section 5.
2. Preliminaries
DEA models can be input or output oriented. Input-oriented models minimize input factors required for a given level of output. Conversely, output oriented DEA models maximize output for a given quantity of input factors. The first model introduced by Charnes et al. [2] is called CCR model. The input oriented form of the CCR model is:
n j Y Y X X Min j n j o j j n j o jj , , 0 1,...,
1 1 (1)
where
DMU
o is the DMU being evaluated in the set of j1,...,n DMUs and X j and Yj denote the input and output vector at DMUj. The value of
is a measure of technical efficiency of o
DMU
. The readers may refer to [4] and [5] for further discussion on the DEA method and its applications.Assume that
t
x
ot,
y
to
and
t1
x
to,
y
ot
R. Fallahnejad / IJDEA Vol.5, No.4, (2017), 1425-1434
1427
that
1,
t1
o t o
t
x
y
and 1
1,
t1
o t o
t
x
y
areinput-oriented efficiency measures of o
DMU
based on its inputs and outputs at period t+1 for the reference technology at t and t+1. The Malmquist productivity index forDMU
o is defined as:2 1 1 t o 1 t o 1 t t o t o 1 t 1 t o 1 t o t t o t o t o ) y , x ( ) y , x ( ) y , x ( ) y , x ( MPI (2) o
MPI
measures the productivity change between periods t and t+1. Productivity declines ifMPI
o
1
; remains unchanged ifMPI
o
1
and improves ifMPI
o
1
. ThisMPI
o is called input-oriented radial Malmquist productivity index becauseo
MPI
is expressed by the radial efficiency scores obtained from several input oriented DEA models. For more details, see the MPI survey study by Fare et al. [6].3. Entropy based MPI
With a brief search about entropy, we realized its various applications in a wide spectrum of areas, including biology, genetics, chemistry, physics and quantum mechanics, fluid mechanics, statistical mechanics, the rmodynamics, environmental sciences and water engineering, electronics and communication engineering, management sciences, operations research, data mining, topology, psychology, social sciences, geology and geomorphology, geophysics, geography, transportation engineering, finance, and so on. See [7], [12], [13] and [14] for more about entropy and applications.
In Multiple attribute decision making (MADM), weights of criteria can be categorized into two groups: subjective and objective weights. Subjective weights
are based on the preferences of decision makers. But sometimes obtaining such reliable subjective weights is difficult; therefore, the use of objective weights is useful. Shannon entropy can be considered as one of the objective scheme, where its weights can be obtained just from data. The entropy weight describes the value of importance of a criterion in decision making. The smaller the value of the entropy, the larger the weight obtained by entropy method, and the more important the criterion becomes in the decision making process.
Shannon entropy is applied as an aggregation instrument in this study. Usually the same weights are used to malmquist values; however, different values have different impacts on the final productivity values of DMUs. By contrast, information entropy theory takes the productivity values of DMUs as expressions of their final productivity values under different optimal weights, which can then be integrated into their final efficiency values. Information entropy is adapted to measure the expected value of a random variable; the greater the entropy of a variable, the more situations in which it appears. Information entropy is a good indicator in making a wide range of evaluations. In this study, we propose using the entropy to obtain a set of weights for aggregating the malmquist productivity indexes, instead of traditional average productivity index during the period of time. Compared with the subjective assignment of weights, Shannon entropy can thus apply more objective weights to the productivity index matrix.
1428
in order to obtain a MPI for a DMU in the period.
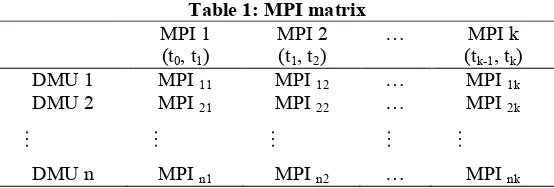
Assume there are N DMUs, and the data of their inputs and outputs for k+1 time sections (t0,…,tk) are at hand. We denote the MPI of DMUn at two sequential times t and t+1 by MPIj,t, j=1,…,n , t=1,…,k. Thus the MPI matrix can be defined as follows: (Table 1)
Now, we will introduce the steps for determining the weights of each sectional MPI t based on the concept of entropy, and therefore the weighted malmquist productivity index for each DMUj (WMPIj).
Step 1: Normalize the matrix in Table 1 by dividing each element of a column by the summation of that column.
Set
k 1,..., t 1,...n, j
, MPI MPI
p n
1 j jt
jt
jt
The raw data are normalized to eliminate anomalies with different measurement units and scales. This process transforms different scales and units among various criteria into common measurable units to allow for comparisons of different criteria.
Step 2: Compute entropy
h
t for allNormalized MPI t as
1,...k t , p .ln p h h
n
1 j
jt jt 0
t
, where
h
0 is equal to(ln
n)
1, and pjt.lnpjt is defined as 0 if pjt0.Step 3: Set dt 1ht, t1,...,k as the degree of diversification. When the productivity values of all DMUs are close, this weight of that year is considered to be weak in the aggregating process.
Step 4: Set , t 1,...,k d
d
w k
1 s s
t
t
as
the degree of importance of MPI t. Note
that k
w
1
1 t t
.Step 5: Calculate the
n 1,..., j , MPI w
WMPI k jt
1 t t
j
.In fact, the above procedure is based on the difference of productivity scores obtained by the respective model. It is clear that if a model yields approximately equal scores for all units, then it does not have any considerable effect on the ranking, and hence it must be considered of a small degree of importance.
Table 1: MPI matrix
MPI 1 MPI 2 … MPI k (t0, t1) (t1, t2) (tk-1, tk) DMU 1 MPI 11 MPI 12 … MPI 1k DMU 2 MPI 21 MPI 22 … MPI 2k
… … … … …
R. Fallahnejad / IJDEA Vol.5, No.4, (2017), 1425-1434
1429
4. Illustration
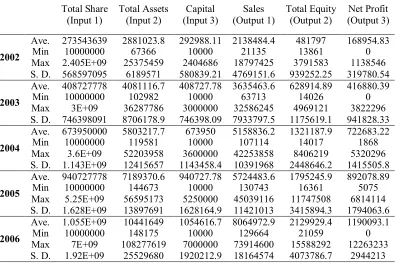
The industry sector is considered as one of the most important economic sectors in each country and plays a key role in the growth and development of them. Among different industries, the automotive industry is one of the most important and significant industries. In order to illustrate the method which has been proposed above, we try to measure the WMPI in automotive companies whose shares have been accepted in Iran stock market during the period 2002-2006 with the proposed procedure. Data are extracted from [10].There are 18 DMUs, each DMU has three financial inputs Total Share, Total Assets and Capital, and three outputs Sales, Total Equity and Net Profit .The statistical information corresponding to 3 inputs and 3 outputs of the 18 companies is presented in table 2.
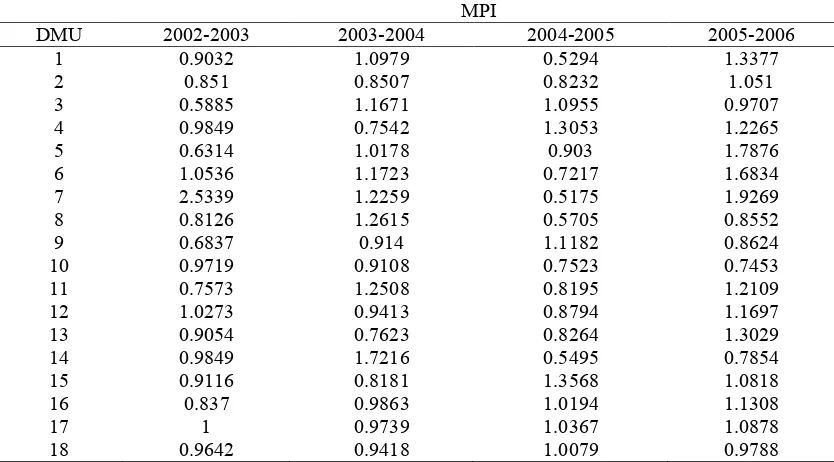
The programs for calculating MPI indices have been executed using the General Algebraic Modeling System (GAMS). Table 1 shows the scores of productivity changes measured by MPI. Note that we considered two sequential years, as it is common in the applied works.
As can be seen, during time period 2002-2003 all companies except company 3 have experienced regress in productivity. During 2003-2004, 8 units have experienced improvement and 10 units, regress. During 2004-2005, 7 units had improvement and 11 others regress. But during 2005-2006, 12 units had improvement in productivity and only 6 ones experienced regress. It should be mentioned that the improvement and regress of each company is considered relative to the previous year.
Table 2: The statistical information corresponding to inputs and outputs of the 18 companies
Total Share (Input 1)
Total Assets (Input 2)
Capital (Input 3)
Sales (Output 1)
Total Equity (Output 2)
Net Profit (Output 3)
Ave. 273543639 2881023.8 292988.11 2138484.4 481797 168954.83
2002 Min 10000000 67366 10000 21135 13861 0
Max 2.405E+09 25375459 2404686 18797425 3791583 1138546 S. D. 568597095 6189571 580839.21 4769151.6 939252.25 319780.54 Ave. 408727778 4081116.7 408727.78 3635463.6 628914.89 416880.39
2003 Min 10000000 102982 10000 63713 14026 0
Max 3E+09 36287786 3000000 32586245 4969121 3822296 S. D. 746398091 8706178.9 746398.09 7933797.5 1175619.1 941828.33 Ave. 673950000 5803217.7 673950 5158836.2 1321187.9 722683.22
2004 Min 10000000 119581 10000 107114 14017 1868
Max 3.6E+09 52203958 3600000 42253858 8406219 5320296 S. D. 1.143E+09 12415657 1143458.4 10391968 2448646.2 1415505.8 Ave. 940727778 7189370.6 940727.78 5724483.6 1795245.9 892078.89
2005 Min 10000000 144673 10000 130743 16361 5075
Max 5.25E+09 56595173 5250000 45039116 11747508 6814114 S. D. 1.628E+09 13897691 1628164.9 11421013 3415894.3 1794063.6 Ave. 1.055E+09 10441649 1054616.7 8064972.9 2129929.4 1190093.1
2006 Min 10000000 148175 10000 129664 21059 0
1430
Table 1: Productivity change measured by Malmquist productivity
MPI
DMU 2002-2003 2003-2004 2004-2005 2005-2006
1 0.9032 1.0979 0.5294 1.3377
2 0.851 0.8507 0.8232 1.051
3 0.5885 1.1671 1.0955 0.9707
4 0.9849 0.7542 1.3053 1.2265
5 0.6314 1.0178 0.903 1.7876
6 1.0536 1.1723 0.7217 1.6834
7 2.5339 1.2259 0.5175 1.9269
8 0.8126 1.2615 0.5705 0.8552
9 0.6837 0.914 1.1182 0.8624
10 0.9719 0.9108 0.7523 0.7453
11 0.7573 1.2508 0.8195 1.2109
12 1.0273 0.9413 0.8794 1.1697
13 0.9054 0.7623 0.8264 1.3029
14 0.9849 1.7216 0.5495 0.7854
15 0.9116 0.8181 1.3568 1.0818
16 0.837 0.9863 1.0194 1.1308
17 1 0.9739 1.0367 1.0878
18 0.9642 0.9418 1.0079 0.9788
We used the entropy concepts in Section 3 to calculate the MPI weights for different sequential years. Table 4 shows the entropy values (Et), degree of diversification (Dt) and degree of importance of MPI's (Wt). As can be seen, Malmquist productivity index of years 2005 and 2006 has the most importance degree 0.401585. This reveals that Malmquist indices of DMUs between these two years have larger disorder as shown in Table 3. Based on the properties of Shannon's entropy, the entropy is the maximum when the MPI's elements are all the same, and when the divergence increases, the MPI column better can discriminate DMUs, and so the weigh increases too.
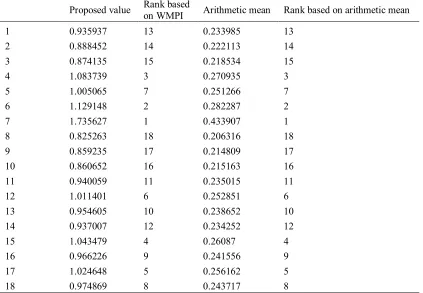
After determining the result of the entropy weight for MPIs, we can get the WMPI for each company as can be seen in Table 5. If we consider the WMPI of each company during the time period of study as a criterion for their improvement or regress during the whole period, among all companies, the WMPI of 38.88889 percent of them shows improvements and that of the other shows regress. Error! Reference source not found.5 also presents the entropy based MPI, their ranking in terms of the amount of change in productivity during the successive year. In table 6, you can see the value of productivity index aggregating by ordinary arithmetic mean and its related rank.
Table 4: Calculating the entropy values, degree of diversification and degree of importance for the empirical example
MPI
2005-2006 2004-2005
2003-2004 2002-2003
0.977349 0.992274
0.986432 0.98754
Et
0.022651 0.007726
0.013568 0.01246
Dt
0.401585 0.136973
0.24054 0.220903
R. Fallahnejad / IJDEA Vol.5, No.4, (2017), 1425-1434
1431
Table 5: Step 5, and the ranks of DMUs based on the corresponding WMPI
Rank WMPI
Wt*MPIjt DMU 2005-2006 2004-2005 2003-2004 2002-2003 13 0.935937 0.362711 0.150383 0.127342 0.295502 1 14 0.888452 0.341748 0.116523 0.198012 0.232169 2 15 0.874135 0.236332 0.159861 0.263511 0.21443 3 3 1.083739 0.395521 0.103305 0.313976 0.270937 4 7 1.005065 0.25356 0.139411 0.217207 0.394886 5 2 1.129148 0.423109 0.160573 0.173597 0.371868 6 1 1.735627 1.017575 0.167915 0.124479 0.425658 7 18 0.825263 0.326328 0.172791 0.137228 0.188916 8 17 0.859235 0.274563 0.125193 0.268971 0.190507 9 16 0.860652 0.3903 0.124755 0.180958 0.164639 10 11 0.940059 0.30412 0.171326 0.197122 0.267491 11 6 1.011401 0.412548 0.128933 0.211531 0.25839 12 10 0.954605 0.363595 0.104415 0.198782 0.287814 13 12 0.937007 0.395521 0.235813 0.132177 0.173497 14 4 1.043479 0.366084 0.112058 0.326364 0.238973 15 9 0.966226 0.336126 0.135096 0.245206 0.249797 16 5 1.024648 0.401585 0.133398 0.249367 0.240298 17 8 0.974869 0.387208 0.129001 0.24244 0.21622 18
Table 6: Comparison between the results of aggregating by entropy and arithmetic mean Proposed value Rank based
on WMPI Arithmetic mean Rank based on arithmetic mean
1 0.935937 13 0.233985 13
2 0.888452 14 0.222113 14
3 0.874135 15 0.218534 15
4 1.083739 3 0.270935 3
5 1.005065 7 0.251266 7
6 1.129148 2 0.282287 2
7 1.735627 1 0.433907 1
8 0.825263 18 0.206316 18
9 0.859235 17 0.214809 17
10 0.860652 16 0.215163 16
11 0.940059 11 0.235015 11
12 1.011401 6 0.252851 6
13 0.954605 10 0.238652 10
14 0.937007 12 0.234252 12
15 1.043479 4 0.26087 4
16 0.966226 9 0.241556 9
17 1.024648 5 0.256162 5
1432
As you can see from table 6, the rank of DMUs is the same based on the proposed method and the usual averaging. But, the proposed method has a better judgment on progression or regression over the period than the conventional averaging method.
5. Conclusion
In this study we analyzed the productivity features of Iran automobile industry over the period 2002-2006 by employing entropy based Malmquist indices to measure weighted productivity. As noted before, Shannon’s entropy is a well-known method in obtaining the weights for an MADM problem especially when obtaining a suitable weight based on the preferences and DM experiments are not possible. We look at the MPI's between sequential times as the criterion which can difference DMUs. Our method solves the equal-weight effect of the usual average based malmquist index measure. By using the proposed method, we can judge about the productivity progress and regress of DMUs over a time period as a whole.
R. Fallahnejad / IJDEA Vol.5, No.4, (2017), 1425-1434
1433
References
[1] Bo H., Ching-Chin Ch., Ching-Ren Ch., (2011), Performance evaluation with the entropy-based weighted Russell measure in data envelopment analysis, Expert Systems with Applications 38, 9965–9972.
[2] Charnes A., Cooper W. W., Rhodes W., (1978), Measuring the efficiency of decision making units, European Journal of Operational Research 2, 429–444.
[3] Caves D.W., Christensen L.R., Diewert W.E., (1982) Multilateral comparisons of output, input and productivity using index numbers, The Economic Journal 92, 73–86.
[4] Cook W.D., Seiford L., Larry M., (2009), Data envelopment analysis (DEA)–Thirty years on, European Journal of Operational Research 192, 1– 17.
[5] Cooper W.W., Seiford L.M., Zhu J., (2004), Handbook on Data Envelopment Analysis. Norwell, MA: Kluwer Academic.
[6] Fare R., Grosskopf S., Roos P., (1998), Malmquist productivity indexes: A survey of theory and practice. In: Fare, R., Grosskopf, S., Russell, R.R. (Eds.), Index Numbers: Essays in Honour of Sten Malmquist. Boston: Kluwer Academic Publishers, 127-190.
[7] Hosseinzadeh Lotfi F., Fallahnejad R., (2010), Imprecise Shannon’s Entropy and Multi Attribute Decision Making, Entropy 12, 53-62.
[8] Jie Wu., (2011), Determination of weights for ultimate cross efficiency
using Shannon entropy, Expert Systems with Applications 38, 5162–5165.
[9] Malmquist S., (1953), Index numbers and indifference surfaces, Trabajos de Estatistica 4, 209–242.
[10] Mehralizadeh M., Eslami Bidgoli G.R., Raei R., Jahanshahloo G.R., (2009), A Review of Ranking Models of Manufacturing Companies and Development of a Model Based on Multi Component Data Envelopment Analysis (MCDEA). Management, university of Tehran. Teh, Ph.D. Dissertation in Management.
[11] Qiwei X., (2014), Increasing the Discriminatory Power of DEA Using Shannon’s Entropy, Entropy 16, 1571-1585.
[12] Robert G., (2011), Entropy and Information Theory. New York : Springe. [13] Rongxi Zh., Ru C., (2013), Guanqun Applications of Entropy in Finance: A Review, Entropy 15, 4909-4931.