Efficiency of Environmental Policy: Empirical Evidence Based on the Application
of VEC Model
Danuse Nerudova, Veronika Solilova
Mendel University in Brno
Zemedelska 1, 61300 Brno, Czech Republic
E-mail. [email protected], [email protected]
http://dx.doi.org/10.5755/j01.ee.27.5.13394
This paper considers the relationship between CO2 as the main variable of climate change and the environmental policy instruments covering environmental taxes and government spending on environmental protection. The effects of the gross domestic product, carbon price, final energy consumption and quality of air were considered using the Vector Error Correction Model. The analysis is based on the survey of environmental policy instruments in the Czech Republic using time series data over the period 1996–2012. The data are extracted from the Eurostat database. The performed research identified negative relationships between CO2 and government spending on environmental protection and between CO2 and carbon price. Furthermore, the research revealed that the government spending on environmental protection and the carbon price have a more significant effect on CO2 than environmental taxes in the Czech Republic. This implies that environmental taxation is mainly used as a source for raising budget revenues in the Czech Republic without any effect on the level of consumption of goods producing CO2 emissions. Therefore, we conclud that currently imposed environmental taxation is inefficient.
Keywords: CO2; Carbon Price; Czech Republic; VEC Model; Environmental Policy Instruments.
Introduction
The aim of the paper is to answer the question whether environmental policy in the form of government expenditures on environmental protection and levies of environmental taxes are efficient in the Czech Republic (i.e., whether it affects in any way the quantities of CO2 emissions).
The Czech Republic, as an EU Member State, has a commitment to the UN Framework Convention on Climate Change, the Kyoto Protocol and its amendment in Doha in 2012 to reduce greenhouse gas emissions by a minimum of 20 % by 2020 compared to 1990 levels and, based on the EU commitment, to decrease the emissions by a minimum of 40 % by 2030 compared to those same levels (European Commission 2014). Therefore, the Czech Republic adopted the State Environmental Policy of the Czech Republic and other national strategic documents1 and is implementing the European competitiveness strategy Europe 2020 and the Climate-Energy Package from 2008.
The long-term greenhouse gas emissions have decreased. As of 2011, the aggregated level of greenhouse gas emissions in the Czech Republic was 67.32 according to the Kyoto base year emission from 1990 (i.e., it fell by 32 %). Hence, based on the EU commitment of the 20 % and 40 % reduction target, the Czech Republic has already attained the 20 % reduction target and will also attain the 40 % reduction target (assuming another 8% reduction happens by 2030). Therefore, the environmental conditions of the Czech Republic can be considered as being improving. Moreover, as the (Yale Center for Environmental Law and
1 Such as the National Programme to Reduce the Impact of Climate Change
in the Czech Republic, State Energy Concept of the Czech Republic, the Second Energy Efficiency Action Plan, National Action Plan for Energy from Renewable Sources
Policy, 2014) states, the Czech Republic improved its position in terms of its environmental performance2 from 6th position to 5th position among 178 countries. Furthermore, the energy intensity of the Czech economy (GDP) has been decreasing over the long term, specifically since 1995, experiencing a 45 % reduction by 2012 (i.e., for the production of one unit of economic output, the economy used half of the energy that it used in 1995). A similar positive trend of 15 % applies to the carbon intensity, i.e., lower emissions are generated to meet the energy needs than in 1995 (Solilova & Nerudova, 2015).
Although the trend of both indicators (energy intensity and carbon intensity) has been decreasing over the long term, it remains above average in the context of the EU28. A significant share of industries included in the GDP, such as mining and quarrying industries, the consumption of fossil fuels, and the over-generation of electric energy are considered the main reasons. While the primary industries including agriculture, forestry and fishing have a minor role in the generation of greenhouse gas emissions in the Czech Republic, generating 1 % of overall emissions, visible emphasis remain on heavy industries in the Czech Republic.
Regardless to the positive developments the aggregated greenhouse gas emissions, the overall greenhouse gas emissions per capita (12.73 tCO2) also remain above the average in comparison with the other EU28 countries (9.07 tCO2) in 2011. Furthermore, with regard to the level of greenhouse gas emissions in each economic activity in 2011, the largest shares of emissions are represented by the energy sector (based on the NACE classification, sector D, 2 The environmental performance is measured with the environmental
Danuse Nerudova, Veronika Solilova. Efficiency of Environmental Policy: Empirical Evidence Based on the Application… 58 % of emissions), followed by manufacturing (NACE C,
19 % of emissions) and transportation (NACE H, 9 % of emissions). Regarding the energy sector, greenhouse gas emissions do not decrease; they stagnate at the year 2000 level. This is mainly due to the high proportion of coal-powered power plants used in electricity generation and the insufficient energy savings in households and services. The energy and transportation industries encompass 82 % of overall emissions and attain an average of 122,702 MtCO2 in 2011. In addition, based on the international comparison, the final energy consumption per capita in the Czech Republic is 7 % higher than the EU27 average, as (Cenia and Ministry of the Environment of the Czech Republic, 2013) states. Moreover, as the Yale Center for Environmental Law and Policy states (2014), air pollution has deteriorated from 16 % to 35 % (i.e., air quality is not improving, mainly in the Moravian-Silesian region) and the trend in CO2 emissions per KWh has deteriorated by 15 % in comparison with the European region peer set.
To overcome an increasing level of energy consumption, the Czech Republic adopted environmental taxes3 by the Act No. 261/2007 Coll. on public budgets stabilization. The excise duty (approximately 10 % for coal and approximately 1 % for electricity for heating) has been imposed since January 2008 and has been in accordance with the Directive 2003/96/EC on taxation of energy products and electricity. After that, the implicit tax rate on energy increased, however it has not attained the EU28 average (EUR 172.78 per TOE, in 2012), the real burden of taxation on energy is EUR 79.08 per TOE in 2012 in the Czech Republic. On the one hand, after the implementation of environmental energy taxes in 2008, the final energy consumption has been decreasing, and the basic objective of taxes can be considered to be met. On the other hand, levied environmental taxes do not reflect energy content or the CO2 emissions of the energy products taxed. Therefore, there arise a question whether the efficiency of imposed environmental energy taxes arises in respect of the reduction of CO2 emissions. In this connectiom, the European Commission proposed revision of the Directive 2003/96/EC on 13 April 2011, in which the rate of carbon taxation was introduced at EUR 20 per tonne of CO2.4
Furthermore, in addition to the environmental taxes, the Czech Republic has also spent considerable financial means in the form of government expenditures on environmental protection to protect nine environmental domains5 based on the Classification of Environmental Protection Activities CEPA 2000. Moreover, in recent years, the importance of these resources, mainly the State Environmental Fund of the Czech Republic, the State Agricultural Intervention Fund and the State Transport Infrastructure Fund has increased. In 2012, the total amount of government spending was nearly four time higher (EUR 2,076.1 mil.) than in 1996 (EUR 599.1 mil.), as states Eurostat (2014). Financial means originate mainly from the environmental taxes, fees
3Czech environmental tax revenue/taxes are divided into four categories: energy taxes (including CO2 taxes), transport taxes, pollution and resource
taxes based on the ESA95 transmission programme.
4 Currently, the carbon taxation is applied in Denmark, Estonia, France,
Finland, Iceland, Ireland, Latvia, Norway, Slovenia, Spain, Sweden, Croatia, Poland, Romania, the United Kingdom and is planned to introduce in Czech Republic, Italy and Portugal.
for environmental pollution and from the sale of greenhouse gas allowances on the EU Emission Trade Scheme (hereafter, EU ETS). The EU ETS was introduced in 2005 as the international system for trading greenhouse gas emission allowances. Its objective is to reduce industrial greenhouse gas emissions cost effectively. However, from the beginning of the EU ETS’ existence its effectiveness has been debated due to the fact, that during the overall trade period, the carbon price fluctuated between EUR 30 per tonne and EUR 0.02 per tonne of CO2 for one emissions’ allowance (European Energy Exchange, 2014). As Borenstein et al. (2014) and Solilova & Nerudova (2014) state, the EU ETS’ effectiveness may be denied according to the development of the carbon price because the EU ETS does not create a consistent CO2 price signal for strategic environmental investment decisions. For example, in 2013, the average price of greenhouse gas emission allowances was CZK 118.64 per tonne of CO2 (or EUR 4.56 per tonne of CO2). Moreover, cost-free allocation of greenhouse gas emission allowances remains possible in the ETS sector, excluding the energy sector, as long as the money saved is used for environmentally friendly investments. In the Czech Republic, approximately 400 entities (250 from the energy sector) are involved in the EU ETS. This covers approximately 60 % of CO2 emissions in the Czech Republic, and shows a decline in greenhouse gas emissions of 1.8 % in 2011.
This research is based on the empirical analysis of time series data over the period 1996–2012 and recent time series techniques (vector autoregressive models or vector error correction models) which present both a suitable tool for short time series analysis and potential solutions to develop more effective environmental policy instruments. In addition, it is also researched how the carbon price from the EU ETS affects the reduction of greenhouse gas emissions or energy consumption. To overcome the omitted variables’ problem, the other variables, such as the gross domestic product, final energy consumption and air quality, were considered.
Theoretical Framework
The current economy is being fuelled by carbon-based energy, i.e., by increasing economic activities and energy consumption carbon dioxide (hereafter, CO2) and by other greenhouse gases emitted into the environment. Hence, as (Steven & Caldeira, 2010) state, the most important drivers of increasing greenhouse gas emissions are unanticipated increases in the energy intensity of GDP and the carbon intensity of energy. In addition, according to (Soytas et al., 2007), the energy use is also considered as the main source of emissions.
Hill & Magnani, 2002 Kolstad & Krautkraemer, 1993 Jorgenson & Wilcoxen, 1993 Richmond & Kaufmann, 2006 Stern, 2000 and others). Based on their results, any environmental policy instrument should consider the nature of the relationships between energy, environment, and growth and should have a long-term vision (Soytas et al., 2007). Furthermore, (Porter & van der Linde, 1995) highlighted that properly designed environmental policy instruments may increase investments into innovative technologies, which may lead to higher economic productivity. However, (Leiter et al., 2009) proved a positive but diminishing impact of environmental policy instruments on a firm´s investment with tighter regulations.
Further, Eurostat (2010) notes that environmental taxes and tradable emissions, as cost-effective instruments, permit the influence of consumers and producers and, as further states (Baumol & Oates, 1988), motivate consumers and producers to use natural resources responsibly and to limit or avoid environmental pollution. However, the impact of environmental taxes on the consumption of potential harmful products depends on the price elasticity of demand for these products. If the price elasticity of demand is lower6, a consumer does not react to the change in price by reducing the consumption of potential harmful products as state (David, 2007 Kubatova, 2010 Svatkova, 2009). They further add that in these cases, the discouragement from the potential harmful behaviour is not efficient. In addition, as (Pavel & Vitek, 2012) note, before an implementation of environmental taxes, both an elimination of negative externalities and an elimination of the costs related to the taxes’ implementation, must be considered.
Moreover, the environmental taxes are also influenced by the substitute effect, which may have a corrective character i.e., by imposing a tax, an over-consumption of the potential harmful product is eliminated and economic as well as tax system efficiency is improved (David, 2007 Kubatova, 2010 Svatkova 2009). However, the impact of the substitution effect depends on the fact whether consumers can substitute a taxable product. Environmental taxes are related with the availability of renewable energy sources or other products with less harmful effects on the environment (which are taxed at lower tax rates) and consumers’ budget limitations. As (Svatkova 2009) states, a taxpayer is dependent on the speed of technological progress, availability of renewable energy sources and his income. If his income allows the use of renewable energy sources, which are available at an affordable price or other products with less harmful effects on the environment, a substitution occurs with the result of the reduction of harmful behaviour.
Generally, the implementation of environmental taxes is presented as revenue-neutral, i.e., additional tax revenues should be compensated by the reduction of both employer´s social security contributions and taxes. Such a tax swap mechanisms were analysed by (Metcalf, 2007a, 2007b Nerudova & Dobranshi, 2015 Rauch &Reilly, 2012 and others). All these studies as well as other studies analysing the revenue recycling potential related to environmental
6Usually basic food and basic needs items as well as items with harmful
effects on health or the environment have a low price elasticity of demand.
taxation (Bovenberg & de Mooj, 1994 Fullerton & Metcalf, 1997 Metcalf & Goulder, 1998 and others), support the double dividend hypothesis. Based on the double dividend hypothesis, environmental taxes increase environmental protection and reduce distortionary taxes on the economy in the form of payroll tax cuts (Nerudova & Dobranshi, 2014 Pearce, 1991).
Notwithstanding, the impact of environmental taxes or carbon taxes depend on the market conditions, elasticity of demand, availability of alternative energy sources, income and other factors.
In addition, in the context of recycling of environmental tax revenues, there is another possibility in the form of increased government expenditure on environmental protection. However, there is an issue of the optimal allocation of financial sources to the suitable environmental protection programme. As (Cuervo & Gandhi, 1999) state, the selection of a suitable environmental protection programme should be conducted by considering the need, and priority of a category of spending, rather than considering the availability of the finance sources. Therefore, environmental policy instruments (environmental taxes and government expenditures on environmental protection) should be designed properly to reach desirable results.
Methodology
Vector autoregressive models (hereafter, VAR) or vector error correction models (hereafter, VEC model) have been employed as instruments in econometrics mainly for short-time series analysis since the early eighties by (Banerjee et al., 1993 Engle & Granger, 1987 Granger, 1981 Hamilton, 1994 Hendry, 1995 Johansen, 1991 Lütkepohl, 2006 Sims, 1980), who provided theoretical exposition of the models.
From the current studies on environmental issues using VAR or VEC model should be highlighted the research performed by (Morley & Abdullah, 2010) analysing environmental taxes and economic growth on the panel data through a granger non-causality approach and VEC model with the result of evidence of causality between economic growth and environmental tax revenues. Furthermore, (Leiter et al., 2009) proved that environmental tax revenue as an environmental regulation has a positive but diminishing effect on investment. Alternatively, (Andersen, 2007) proved a positive effect of a carbon-energy tax on economic growth. In addition, another study by (Ahmadi, 2012) focusing on the impact of the environmental tax ratio on environmental performance in Iran, indicated the negative effect of the tax rate on CO2 emissions. Finally, a study by (Machova & Kotlan, 2013), which analysed the interaction of taxation, government spending and economic growth based on the panel data of OECD countries by employing a VAR model proved the negative effect of taxation on economic growth, but with a positive effect of taxation on government spending. However, no studies covered all the aspects that our paper wants to analyse.
Danuse Nerudova, Veronika Solilova. Efficiency of Environmental Policy: Empirical Evidence Based on the Application… as on gross domestic product, carbon price, final energy
consumption and air quality on greenhouse gas emissions in the Czech Republic are examined by employing the Vector Error Correction Model (VEC model) as a form of vector autoregression model (VAR).
Generally, the VAR model is used as a technique for describing the dynamic behaviour of economic and financial time series, as well as for structural inference and policy analysis, and is a prevalent method of time series modelling and forecasting (Canova & Ciccarelli, 2013 Dokmen, 2012 Sims, 1980). However, VAR can encounter difficulties in the form of a spurious regression problem (Granger & Newbold, 1974), although it is properly specified when applied to nonstationary or integrated processes. If time series are integrated and nonstationary, that is I(1), they may be cointegrated, i.e., a linear combination of these series could be stationary although each series is not, and they move in tandem in the long term. Because all selected variables are I(1), the VAR concept can be extended to the VEC model, in which the variables are individually integrated at f order 1, but exhibit cointegration among two or more series. Unit root and cointegration are considered the main assumptions without which the results of the VEC model cannot be valid. The VEC model is specified as follows:
∆𝑦𝑡= 𝛼𝛽𝑇𝑦𝑡−1+ Γ1Δ𝑦𝑡−1+ ⋯ + Γ
𝑝−1𝑦𝑡−𝑝+1+ 𝑢𝑡
where 𝑦𝑡 is a vector of endogenous variables, 𝛼 a vector
of parameters measuring speed at which the variables come to the long-run equilibrium, 𝛽𝑇is a vector of estimates for
the long-term cointegrated relation between the variables, and Γ𝑝 is a matrices of parameters for endogenous variables
of a given lag. Our model has 7 endogenous variables: greenhouse gas emissions (hereafter. GHE in thousand tonnes of CO2 equivalent), government spending on environmental protection (hereafter, GE in CZK million), environmental tax revenues (hereafter, TET in CZK million), final energy consumption (hereafter, FEC in million tonnes of oil equivalent), carbon price (hereafter, CP in CZK per tonne of CO2), gross domestic product (hereafter, GDP in CZK million) and air quality (hereafter, AQ in points from 100).
All variables used were taken from Eurostat database and European Environment Agency except of AQ which gained from Yale Center for Environmental Law and Policy. GHE represent total CO2 equivalents emissions in the Czech Republic and cover carbon dioxide, methane and nitrous oxide. GE represents total expenditures on environmental protection of ambient air and climate based on the classification of CEPA which are monitored since 2006 in the Czech Republic. TET covers four categories: energy taxes (including CO2 taxes), transport taxes, pollution and resource taxes, which Eurostat collects from the national tax lists as part of the ESA95 transmission programme. Energy tax revenues as the largest part of TET include tax revenues on energy production and on energy products used for both transport and stationary purposes, e.g. petrol and diesel, fuel oils, natural gas, coal and electricity, based on the Eurostat definition. Carbon dioxide (CO2) taxes are also included under energy taxes, as well as SO2 taxes, because they are
7 For detailed explanation see methodology of Yale Center for
Environmental Law and Policy
usually integrated with energy taxes. Moreover, there are also included emissions allowances from the EU ETS which are recorded as taxes in the national accounts. FEC covers energy consumed in the transport, industrial, commercial, agricultural, public and household sectors in the Czech Republic, but exclude deliveries to the energy transformation sector and to the energy industries themselves. CP represents price of the greenhouse gas emissions allowances tradable at EU ETS since 2005. AQ represents index of the quality of air in the Czech Republic monitored since 2002, the best value is 100 points. Concretely, the AQ index represents the result of the evaluation of three domains. First domain represents Household quality of air. Second domain is defined as Air Pollution - Average Exposure to PM2.57. Last domain represents Air Pollution - PM2.5 Exceedance. The AQ index is measured in points (max for each domain is 100 points)8. GDP represents the Czech economy output in the form of market prices.
The implementation of VEC model is based on the Maximum Likelihood framework and Eigen Value Statistics of Johansen (Johansen, 1988, 1991) and his test for cointegration. To consistently test for cointegration, the appropriate lag length must be chosen. Therefore, the initial VAR model was employed to determine the lag order of the cointegration test; an optimal lag length of one lag was selected. Furthermore, as (Johansen, 1991) states, the “case 3” was applied i.e., unrestricted constant, which allows for the presence of a non-zero intercept in the cointegrating relations as well as a trend in the endogenous variables’ levels. Thereafter, the cointegration analysis was performed (see table 1).
Table 1
Johansen Test
Rank H01 Eigenvalue Trace
test p-value
Lmax test
p-value
>0 0 0.96956 147.63 0.0009 59.364 0.0005
>1 1 0.86462 88.270 0.1457 33.995 0.2128
>2 2 0.76334 54.275 0.4525 24.500 0.4327 >3 3 0.65023 29.775 0.7315 17.858 0.5185 >4 4 0.43664 11.918 0.9308 9.7552 0.7685 >5 5 0.09547 2.1623 0.9875 1.7059 0.9908 >6 6 0.02649 0.4564 0.4993 0.4564 0.4993
1) The number of cointegration vectors that exist. (Source: own processing)
As (Johansen, 1991) noted, there are two statistics test for cointegration analysis. The first test represents trace statistics, and the second test represents maximum eigenvalue statistics. The results of both tests reported in table 1 strongly supports the presence of one cointegrating vector. Regarding the rank 0, the null hypothesis of no cointegration i.e., zero cointegrating vector was rejected; the null hypothesis for the rank higher than 1 was rejected as well, indicating that one cointegration vector exists. Thus, variables are cointegrated with a long-term relation; in addition, the disequilibrium errors tend to fluctuate around a zero mean.
VEC model’s purpose is to focus on the short-term dynamics while making them consistent with a long-term solution. Generally, as (Ahmadi, 2012) states, cointegration provides evidence of a long-term relation between variables, although the VEC model provides evidence of a short-term relation. If at least one cointegrating vector among the variables is identified, a corresponding error-correction representation implies that changes in the dependent variable can be formulated as a function of the disequilibrium level in the cointegration relation and the fluctuation in other explanatory variables (Saluja et al., 2013).
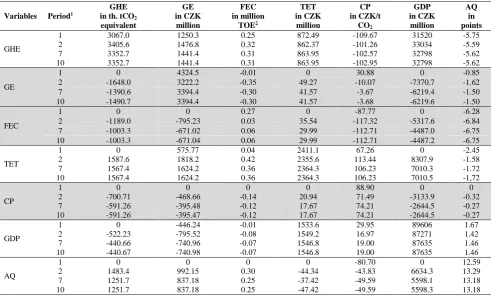
In addition, based on the results of the VEC model, the forecasts of variables for 2013 and 2014 as well as the impulse responses for one lag for all variables were employed during a 10 year period. The impulse response functions (hereinafter as IRF) describe the response of a variable over the time to a shock in another variable in the system i.e. what the additive effect arises to current and future variables if the shock of another variable is added. However, that shock does not only directly affect that variable but also transmits its effect to all in the system through the VEC model’s dynamic structure. The IFR are based on the Cholesky decomposition of the contemporaneous covariance matrix and thus, the order in which the variables are provided matters.
Finally, a sensitivity analysis was performed. The obtained results were applied and again analysed for elasticity as the most important parameter of the efficiency of environmental policy instruments.
Results
The results of the VEC model with cointegration vector βT and speed vector α are shown in table 2 below. Based on the results we interpret that an increase in GE, FEC, TET, CP, GDP and AQ by one unit would be, in equilibrium, associated with an increase or decrease in GHE. Furthermore, a speed vector α measures speed at which the variables arrive at the long-term equilibrium.
Table 2
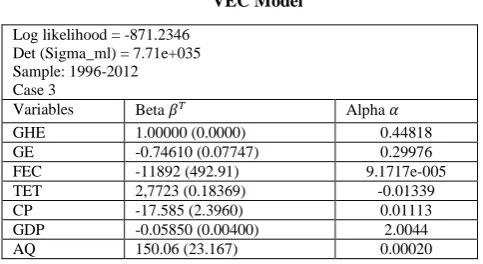
VEC Model
Log likelihood = -871.2346 Det (Sigma_ml) = 7.71e+035 Sample: 1996-2012 Case 3
Variables Beta 𝛽𝑇 Alpha 𝛼
GHE 1.00000 (0.0000) 0.44818 GE -0.74610 (0.07747) 0.29976 FEC -11892 (492.91) 9.1717e-005 TET 2,7723 (0.18369) -0.01339 CP -17.585 (2.3960) 0.01113 GDP -0.05850 (0.00400) 2.0044 AQ 150.06 (23.167) 0.00020
Note: Standard errors are noted in parentheses. (Source: own processing).
In the Table 2 above the VEC model indicates the relation between GHE and GE and, what was not previously expected, between GHE and CP within the conditions of the
9 Generation of electricity from renewable energy sources has been
growing; interannually in 2012, it increased by 11.2 %.(Cenia and Ministry of the Environment of the Czech Republic, 2013)
Czech Republic. Specifically, an increase in government spending on environmental protection by one unit (CZK 1 million) causes a decrease in GHE by 0.74 th. tonne of CO2 equivalent. Furthermore, we have also identified a negative relation for carbon price: an increase of CP by one unit results in a decrease in GHE by 17.58, i.e., if the carbon price increases by 1 CZK per tonne CO2, GHE will decrease by 17.58 th. tCO2 equivalent. The impact of an increased carbon price is stronger than for government spending on environmental protection. Nevertheless, the employed VEC model did not prove any relationships between TET and GHE, GDP and GHE, FEC and GHE or AQ and GHE. For environmental taxes, their increase by one unit has a positive effect of 2.77 on GHE in the Czech Republic; this means that these taxes are used mainly as a source for increasing budget revenues without any GHE effects on the taxed products. Furthermore, a negative relation between FEC and GHE (of -11,892) for increased final energy consumption can be explained by an increased usage of renewable energy in the Czech Republic during the last decade9. If renewable energy usage increases by 1 million tonnes of oil equivalent, GHE will decrease by 11,892th. tCO2 equivalent.
Inzinerine Ekonomika-Engineering Economics, 2016, 27(5), 527–537
Table 3
Impulse-Responses for 1 Lag VEC of GHE, GDP, TET, GE, FEC, AQ, CP
1) Years with similar results of impulse-responses were omitted. 2) tonnes of oil equivalent (Source: own processing)
Table 4
Forecasts of Variables for 2013 and 2014
Variables 20121 2013 2014
GHE
in th tCO2 equivalent 131,466.00
125,732.67 (119,721.42 - 131,743.32)
124,945.14 (113,936.32 - 135,953.95) GE
in CZK million 53,517.51
51,332.92 (42,395.15 – 60,270.68)
53,762.76 (41,501.82 – 66,023.70) FEC
in million TOE 24.1
23.1 (22.3 - 23.8)
23.0 (21.4 – 24.6) TET
in CZK million 90,426.00
93,424.57 (87,568.66 – 99,280.49)
96,275.29 (88,046.84 – 104,503.74) CP
in CZK/t CO2 186.46
84.62 (-309.95 – 479.18)
105.70 (-465.16 – 676.57) GDP
in CZK million 3,845,926
3,961,641.65 (3,775,467.76 – 4,147,815.54)
4,099,476.87 (3,836,990.29 – 4,361,963.46) AQ
in points 73.99
76.22 (45.80 – 106.64)
80.76 (36.80 – 124.72)
1) current value. Note: The forecast based on the 95 % confidential interval is noted in parentheses. (Source: own processing)
The last portion of the VEC model is related to the forecasts of variables for 2013 and 2014 (for details see table 4 above). The forecast based on the 95 % confidential interval and current values of variables in 2012 are also noted. As shown, TET, GDP, GE and AQ would increase. Other variables, such as GHE, CP and FEC, would decrease in comparison with 2012 and 2014, mainly GHE would decrease from 131,466 in 2012 to 124,945 in 2014 i.e., by nearly 5 %, as well as FEC. Furthermore, the forecast based on the 95 % confidence interval for CP must be emphasized.
As shown, the large interval range proved that the EU ETS does not create a consistent CO2 price signal for strategic environmental investment decisions.
In addition, the sensitivity analysis was performed in which variables with relation to GHE, such as GE, CP and FEC, were again analysed regarding the forecasts of their values for 2014 and their impacts on GHE. The variable of TET was not considered because the VEC model did not prove its relation with GHE. For details refer to table 5. Variables Period1
GHE in th. tCO2
equivalent
GE in CZK
million
FEC in million
TOE2
TET in CZK million
CP in CZK/t
CO2
GDP in CZK
million
AQ in points
GHE
1 3067.0 1250.3 0.25 872.49 -109.67 31520 -5.75 2 3405.6 1476.8 0.32 862.37 -101.26 33034 -5.59 7 3352.7 1441.4 0.31 863.95 -102.57 32798 -5.62 10 3352.7 1441.4 0.31 863.95 -102.95 32798 -5.62
GE
1 0 4324.5 -0.01 0 30.88 0 -0.85
2 -1648.0 3222.2 -0.35 49.27 -10.07 -7370.7 -1.62 7 -1390.6 3394.4 -0.30 41.57 -3.67 -6219.4 -1.50 10 -1490.7 3394.4 -0.30 41.57 -3.68 -6219.6 -1.50
FEC
1 0 0 0.27 0 -87.77 0 -6.28
2 -1189.0 -795.23 0.03 35.54 -117.32 -5317.6 -6.84 7 -1003.3 -671.02 0.06 29.99 -112.71 -4487.0 -6.75 10 -1003.3 -671.04 0.06 29.99 -112.71 -4487.2 -6.75
TET
1 0 575.77 0.04 2411.1 67.26 0 -2.45
2 1587.6 1818.2 0.42 2355.6 113.44 8307.9 -1.58 7 1567.4 1624.2 0.36 2364.3 106.23 7010.3 -1.72 10 1567.4 1624.2 0.36 2364.3 106.23 7010.5 -1,72
CP
1 0 0 0 0 88.90 0 0
2 -700.71 -468.66 -0.14 20.94 71.49 -3133.9 -0.32 7 -591.26 -395.48 -0.12 17.67 74.21 -2644.5 -0.27 10 -591.26 -395.47 -0.12 17.67 74.21 -2644.5 -0.27
GDP
1 0 -446.24 -0.01 1533.6 29.95 89606 1.67
2 -522.23 -795.52 -0.08 1549.2 16.97 87271 1.42 7 -440.66 -740.96 -0.07 1546.8 19.00 87635 1.46 10 -440.67 -740.98 -0.07 1546.8 19.00 87635 1.46
AQ
1 0 0 0 0 -80.70 0 12.59
Table 5
Impact of Selected Variables on GHE in 2014
Variables
Current value
Forecasts
Change 2012/2014
Impact on GHE2
in th. tCO2
equivalent
2012 20141
GE in CZK million
53,517.51 66,023.70 12,506.19 -9,254.58
CP in CZK/t CO2
186.46 676.57 490.11 -8,616.13
FEC in million TOE
24.1 24.6 0.5 -5,9463
1) upper limit of the 95 % confidential interval. 2) based on the results of VEC model.
3) if an increase of FEC is caused by using of renewable energy sources,
which have negative relationships to GHE.
(Source: own processing)
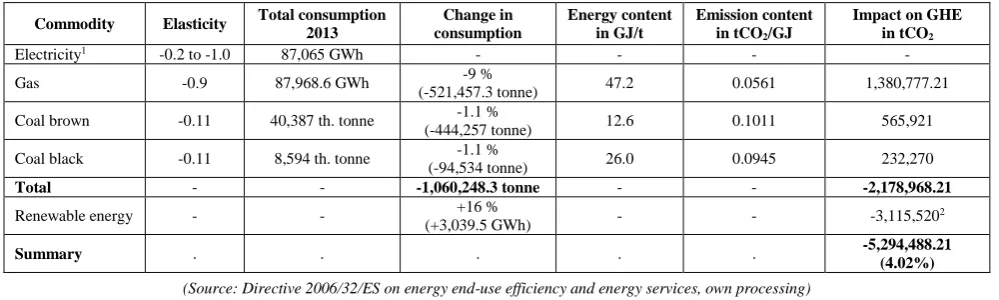
As shown in table 5, if we consider a unit of changes, FEC has stronger impact on GHE, followed by CP and last GE. Therefore, FEC was examined further regarding electricity, gas and coal as the main FEC contributors. Moreover, gas and coal are the subjects of proposed carbon taxation in EU according to the proposed revision of the Directive 2003/96/EC on taxation of energy products and electricity. Hence, the research model is based on three assumptions. First, we expect that after the introduction of a 10% carbon tax, prices of coal and gas would increase by 10% because at least a 100% transfer of tax incidence to final consumers will occur, as was previously empirically proven by (David, 2007 Kubatova, 2010). Second, renewable energy sources are more available for acceptable prices. Finally, we considered demand elasticity for the research with the objective of determining the effect of increased prices on consumption. As noted by (Brůha & Šcasny, 2008), the elasticity of electricity varies between -0.2 to -1.0 in the Czech Republic. For gas and coal, the researchers assumed 0.9 and -0.11, respectively. In 2013, the largest portion of electricity was generated from brown coal (44 %), renewable energy (11 %), black coal (6 %) and gas (2 %) (see State Energy Concept - ASEK, 2014). Therefore, electricity was omitted from the determination of effects on GHE. Furthermore, as (Cenia & Ministry of the Environment of the Czech Republic, 2013) state, renewable
energy sources recorded an increased tendency of 16 % in 2013 in comparison with 2012. Thus, based on the assumptions and other aspects, we expect that the consumption of coal and gas would decrease in total by 11.2 %10, and the consumption of renewable energy would increase by 16% in 2014 as in the previous year.
As shown in table 6 below, both effects have negative impacts on GHE. Specifically, the consumption of coal and gas decreases approximately 1.06 mil tonnes with a negative result on GHE of 2.17 mil t/CO2. Furthermore, increased renewable energy sources have a negative impact on GHE of 3.11 mil t/CO2. In total, this represents 5.29 mil t/CO2 or a 4.02 % decrease of total GHE from the 2012 base (131,466 th. t/CO2 equivalent).
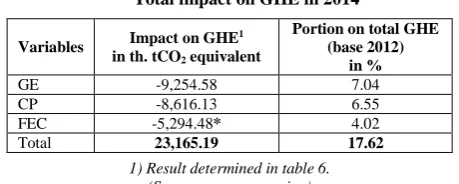
Based on the results noted in table 2–6 above, it can be concluded that currently levied environmental taxes do not negatively affect the GHE. Moreover, based on the VEC model results, the taxes have a positive effect on GHE of 2.77 th. tonne of CO2 equivalent. Thus, the taxes are used mainly as a source for increasing budget revenues with no GHE effects on the taxed products. Nevertheless, for government spending on environmental protection as well as carbon prices, the negative relationships with GHE were proven by VEC model. Specifically, their impacts on GHE were determined to be -9,254 th. tCO2 for GE, and -8,616 th. tCO2 for CP. Furthermore, the positive relation between GHE and FEC was proven for the situations when the increased consumption (FEC) is caused by using renewable energy sources. In this case, the total impact of FEC on GHE was determined to be -5,294.48 th. t/CO2 (4.02 % of total GHE), if both harmful consumption of non-environmental friendly energy will be eliminated through carbon taxation (i.e., carbon taxation implemented for coal and gas) and renewable energy sources increased by 16 %.
Based on the results revealing a total negative impact for all variables on GHE (see table 7), we conclude that environmental policy in the Czech Republic should be focused on the elimination of harmful energy consumption through government spending on environmental protection as well as on the implementation of carbon taxation and renewable energy resources. These all represent efficient tools for the decline of GHE in the Czech Republic, one goal of the Kyoto Protocol.
Table 6
Impact of Selected Variables on FEC on GHE
Commodity Elasticity Total consumption 2013 consumption Change in Energy content in GJ/t Emission content in tCO
2/GJ
Impact on GHE in tCO2
Electricity1 -0.2 to -1.0 87,065 GWh - - - -
Gas -0.9 87,968.6 GWh -9 %
(-521,457.3 tonne) 47.2 0.0561 1,380,777.21 Coal brown -0.11 40,387 th. tonne -1.1 %
(-444,257 tonne) 12.6 0.1011 565,921 Coal black -0.11 8,594 th. tonne (-94,534 tonne) -1.1 % 26.0 0.0945 232,270
Total - - -1,060,248.3 tonne - - -2,178,968.21
Renewable energy - - +16 %
(+3,039.5 GWh) - - -3,115,520
2
Summary . . . -5,294,488.21
(4.02%)
(Source: Directive 2006/32/ES on energy end-use efficiency and energy services, own processing)
10 11.2 % is the result of a 10 % price increase and the demand elasticity of gas and coal, i.e., 9 % (for gas) plus 1.1 % (for black coal)
Danuse Nerudova, Veronika Solilova. Efficiency of Environmental Policy: Empirical Evidence Based on the Application…
Table 7
Total impact on GHE in 2014
Variables Impact on GHE
1
in th. tCO2 equivalent
Portion on total GHE (base 2012)
in %
GE -9,254.58 7.04
CP -8,616.13 6.55
FEC -5,294.48* 4.02 Total 23,165.19 17.62
1) Result determined in table 6. (Source: own processing)
Conclusions
This paper’s objective was to answer the question whether environmental policy in the form of government expenditures on environmental protection and levies of environmental taxes is efficient in the Czech Republic.
The research proved the relationships between GE and GHE, between CP and GHE and between FEC and GHE. Specifically, an increase in government spending on environmental protection by one unit (CZK 1 million) results in a decrease in GHE by 0.74 th. tonne of CO2 equivalent. Furthermore, an increase of carbon prices by one unit results in a decrease in GHE by 17.58 th. tCO2 equivalent. Finally, the research revealed that if renewable
energy sources are increased by 1 million tonnes of oil equivalent, GHE will decrease by 11,892 th. tCO2 equivalent. According to the VEC model results, the relationship between environmental taxation and greenhouse gas emissions was not proven because the results have indicated a positive effect of 2.77 th. tCO2 equivalent of GHE. Therefore, we can conclude that the currently applied system of environmental taxation in the Czech Republic is used as a tool for raising budget revenues and not as a tool of environment policy.
Furthermore, the sensitivity analysis enabled us to forecast the effect of verified variables on GHE for 2014, the impact of FEC on GHE was forecasted to be -5,294.48 th. t/CO2 (4.02 % of total GHE). The total impact of verified variables (GE, CP and FEC) on GHE was forecasted to be 23,165.19 th. tCO2 or a 17.62 % decrease compared to the 2012 GHE base.
Based on the results we can conclude that the environmental policy in the Czech Republic should be focused on the elimination of the harmful consumption of energy through government spending on environmental protection as well as on the implementation of carbon taxation and renewable energy resources. These all represent efficient tools for the decline of GHE in the Czech Republic, one goal of the Kyoto Protocol.
Acknowledgments
The paper is the result of the project “Postdoc contracts at MENDELU technical and economic research” No. CZ.1.07/2.3.00/30.0031 as Investments in Education Development at Mendel University in Brno.
References
Andersen, M. S. (2007). Carbon-Energy Taxation Contributed To Economic Growth. Available from Internet: http://www.dmu.dk/en/news/oldarchive/2007/co2tax.
Ahmadi, A. A. T. (2012). The Impact of Tax Ration on Environmental Performance in Iran; with Emphasis on Sustainable Economic Development. Life Science Journal 9(4), 1183–1187. http://www.lifesciencesite.com/lsj/life0904/175_ 11875life0904_1183_1187.pdf
Banerjee, A., Dolago, J., Galbraith, J., & Hendry, D. (1993). Co-Integration, Error-Correction, and the Econometric Analysis of Non-Stationary Data. Oxford University Press, New York. https://doi.org/10.1093/0198 288107.001.0001
Baumo, W., & Oates, W. (1988). The Theory of Environmental Policy. Cambridge University Press. https://doi.org/10.1017/CBO9781139173513
Bohringer, C., & Rutherford, T. (1997). Carbon Taxes with Exemptions in an Open Economy: A General Equilibrium Analysis of the German Tax Initiative. Journal of Environmental Economics and Management, 32, 189–203. https://doi.org/10.1006/jeem.1996.0962
Borenstein, S., Bushnell, J., Wolak, F. A., & Zaragoza-Watkins, M. (2014). Expecting the unexpected: Emissions uncertainty and Environmental Market Design. Available from Internet: http://web.stanford.edu/group/fwolak/cgi-bin/sites/default/files/NBERpaperV12.pdf.
Bovenberg, L., & de Mooij, R. (1994). Environmental Levies and Distortionary Taxation. American Economic Review, 94(4), 1085–1089.
Brůha, J., & Scasny, M. (2008). Distributional Effects of Environmentally-Related Taxes: Empirical Applications for the Czech Republic. Available from Internet: http://www.czp.cuni.cz/czp/images/stories/Vystupy/Seminare/ SSP/2008/080603/Bruha_Scasny.pdf.
Cenia, Ministry of the Environment of the Czech Republic, (2013). Report on the Environment of the Czech Republic, 2012. Available from Internet: http://www.cenia.cz.
Cuervo, J., & Gandhi Ved P. (1999). Carbon taxes: Their macroeconomic effects and prospects for global adoption - A Survey of the literature, EconPapers, Revista Desarrollo Y Sociedad. Available from Internet: http://econpapers. repec. org/article/col000090/007447.htm.
David, P. (2007). Teorie daňove incidence s praktickou aplikaci. Akademicke nakladatelstvi CERM, Brno.
Dinda, S. (2004). Environmental Kuznets Curve Hypothesis: A Survey. Ecological Economics, 49, 431–455. https://doi.org/10.1016/j.ecolecon.2004.02.011
Directive 2006/32/ES. Directive 2006/32/EC of the European Parliament and of the Council of 5 April 2006 on energy end-use efficiency and energy services and repealing Council Directive 93/76/EEC. Available from Internet: http://eur-lex.europa.eu/legal-content/EN/TXT/PDF/?uri=CELEX:32006L0032&from=EN.
Dökmen, G. (2012). Environmental tax and economic growth: a panel VAR analysis. Available from Internet: http://iibf.erciyes.edu.tr/dergi/sayi40/ERUJFEAS_Jun2012_43to65.pdf.
Engle, R. F., & Granger, C. W. J. (1987). Co-integration and error correction: representation, estimation, and testing, Econometrica, 55(2), 251–76. Available from Internet: https://ideas.repec.org/a/ecm/emetrp/v55y1987i2p251-76.html.
European Commission, (2014). Communication from the Commission to the European Parliament, the Council, the European Economic and Social Committee and the Committee of the regions. A policy framework for climate and energy in the period from 2020 to 2030. COM(2014) 15 final. Available from Internet: http://eur-lex.europa.eu/legal-content/en/TXT/?uri=celex:52014DC0015
European Energy Exchange, (2014). Auctions by the transitional common Auction platform. Report June 2014. European Commissions. Available from Internet: http://ec.europa.eu/clima/policies/ets/cap/auctioning/docs/cap_report_ 201406_en.pdf.
Eurostat, (2014). Environmental protection expenditure of general government by COFOG groups and economic transactions. Online data code: env_ac_cofog. Available from Internet: http://appsso.eurostat.ec.europa.eu/ nui/show.do?lang=en&dataset=env_ac_cofog
Eurostat, (2010). Environmental statistics and accounts in Europe. Publications Office of the European Union. Luxembourg.
Fullerton, D., & Metcalf, G. E. (1997). Environmental Taxes and the Double-dividend Hypothesis: Did You Really Expect Something for Nothing? NBER Working Paper 6199. Available from Internet: http://www.nber.org/papers/w6199. Granger, C. W. J. (1981). Some Properties of Time Series Data and Their Use in Econometric Model Specification.
Journal of Econometrics, 16, 121–130. http://www.unc.edu/~jbhill/CointGranger.pdf. https://doi.org/10.1016/0304-4076 (81)90079-8
Granger, C. W. J., & Newbold, P., (1974). Spurious regressions in econometrics. Journal of Econometrics, July: 111–120. http://wolfweb.unr.edu/homepage/zal/STAT758/Granger_Newbold_1974.pdf.
https://doi.org/10.1016/0304-4076 (74)90034-7
Hamilton, J. D. (1994). Time Series Analysis. Princeton: Princeton University Press.
Hendry, D. F. (1995). Dynamic Econometrics. Oxford University Press, Oxford. https://doi.org/10.1093/01982 83164.001.0001
Hill, R. J., & Magnani, E. (2002). An exploration of the conceptual and empirical basis of the environmental Kuznets curve. Australian Economic Papers, 42, 239-254. https://doi.org/10.1111/1467-8454.00162
Johansen, S. (1991). Estimation and Hypothesis Testing of Cointegration Vectors in Gaussian Vector Autoregressive Models. Econometrica, 59 (6), 1551–1580. http://www.jstor.org/stable/2938278?seq=1#page_scan_tab_contents. https://doi.org/10.2307/2938278
Johansen, S. (1988). Statistical Analysis of Cointegration Vectors, Journal of Economic Dynamics and Control, 12, 231– 254. https://ideas.repec.org/a/eee/dyncon/v12y1988i2-3p231-254.html.
https://doi.org/10.1016/0165-1889(88) 90041-3
Jorgenson, D. W., & Wilcoxen, P. J. (1993). Energy, the environment, and economic growth. In Kneese, A.V., Sweeney, J. L. (Eds.). Handbook of Economic Growth, pp. 13–65. https://doi.org/10.1016/s1573-4439(05)80014-4
Danuse Nerudova, Veronika Solilova. Efficiency of Environmental Policy: Empirical Evidence Based on the Application… Kubatova, K. (2010). Danova teorie a politika. Fourth edition.Wolters Kluwer, Praha.
Leiter, A. M., Parolini, A., & Winner, H. (2009). Environmental Regulation and Investment: Evidence from European Industries. Working papers in Economics and Statistics. Available from Internet: http://eeecon.uibk.ac.at/wopec2/ repec/inn/wpaper/200904.pdf.
Lutkepohl, H. (2006). New introduction to multiple time series analysis. Springer-Verlag, New York.
Machova, Z., & Kotlan, I. (2013). Interakce zdaneni, vladnich vydajů a ekonomickeho růstu: panelovy VAR model pro zeme OECD. Politicka Ekonomie, 5, 623–638. https://doi.org/10.18267/j.polek.920
Metcalf, G. (2007a). A Green Employment Tax Swap: Using a Carbon Tax to Finance Payroll Tax Relief. Brookings Institution-World Resources Institute Tax Reform, Energy and the Environment Policy Brief. Available from Internet: pdf.wri.org/Brookings-WRI_GreenTaxSwap.pdf.
Metcalf, G. (2007b). A Proposal for a U.S. Carbon Tax Swap: An Equitable Tax Reform to Address Global Climate Change. Discussion Paper 2007–12, Hamilton Project, Brookings Institution. Available from Internet: http://www.brookings.edu/~/media/research/files/papers/2007/10/carbontax%20metcalf/10_carbontax_metcalf.pdf. Metcalf, G., & Goulder, L. (1998). A Distributional Analysis of an Environmental Tax Shift. NBER Working Papers, no.
6546. Available from Internet: www.nber.org/papers/w6546. https://doi.org/10.3386/w6546
Morley, B., & Abdullah, S. (2010). Environmental Taxes and Econometric Growth: Evidence from Panel Causality Tests. Available from Internet: http://www.bath.ac.uk/economics/research/workingpapers.html.
Nerudova, D., & Dobranschi, M. (2014). Double dividend hypothesis: Can it occur when tackling carbon emissions? Procedia Economics and Finance, 12, 472–479. https://doi.org/10.1016/S2212-5671(14)00369-4
Nerudova, D., & Dobranschi, M. (2015). Double dividend hypothesis: Can it be validated by carbon taxation swap with payroll taxes? Inzinerine Ekonomika-Engineering Economics, 26(1), 23–32. DOI: http://dx.doi.org/10.5755/ j01.ee.26.1.8399. https://doi.org/10.5755/j01.ee.26.1.8399
Pavel, J., & Vitek, L. (2012). Transaction Costs of Environmental Taxation: The Administrative Burden. In J.E. Milne and M.S. Andersen (Eds.), Handbook of Research on Environmental Taxation, pp. 273–282. https://doi.org/10.4337 /9781781952146.00025
Pearce, D. W. (1991). The Role of Carbon Taxes in Adjusting to Global Warming. Economic Journal, 101, 938–948. https://doi.org/10.2307/2233865
Porter, M. E., & van der Linde, C. (1995). Green and Competitive: Ending the Stalemate. Harvard Business Review. President and Fellows of Harvard College. Available from Internet: http://www.uvm.edu/~gflomenh/ENRG-POL-PA395/readings/Porter_Linde.pdf
Rauch, S., & Reilly, J. M. (2012). Carbon Tax Revenue and the Budget Deficit: A Win-Win-Win Solution? MIT Joint Program on the Science and Policy of Global Change. Report No. 228, Massachusetts Institute of Technology, Cambridge, MA. Available from Internet: http://globalchange.mit.edu/files/document/MITJPSPGC_Rpt228.pdf. Richmond, A. K., & Kaufmann, R. K. (2006). Is there a turning point in the relationship between income and energy use
and/or carbon emissions? Ecological Economics, 56, 176-189. https://doi.org/10.1016/j.ecolecon.2005.01.011 Saluja, M. S., Bhatia, N. K., & Patel, N. (2013). A Cointegration and VECM Approach in Explaining Relationship of FDI
with Current and Capital Account of_India. International Journal of Advance Research in Computer Science and Management Studies, 1(6), 1–6. Available from Internet: http://www.academia.edu/5514407/A_Cointegration_ and_VECM _Approach_in_Explaining_Relationship_of_FDI_with_Current_and_Capital_Account_of_India. Sims, C. A. (1980). Macroeconomics and reality, Econometrica, 48(1), 1–48. Available from Internet:
http://www.ekonometria.wne.uw.edu.pl/uploads/Main/macroeconomics_and_reality.pdf. https://doi.org/10.2307/1912017
Solilova, V., & Nerudova, D. (2014). Overall approach of the EU in the question of emissions: EU emissions trading system and CO2 taxation, Procedia Economics and Finance, 12, 616–625. https://doi.org/10. 1016/S2212-5671(14)00386-4
Solilova, V., & Nerudova, D. (2015). Evaluation of Greenhouse Gas Emissions and Related Aspects: case of the Czech Republic. Acta Univ. Agric. Silvic. Mendelianae Brun. 63(1), 281–292. https://doi.org/10.11118/actaun2015 63010281
Soytas, U., Sari, R., & Ewing, B., T. (2007). Energy consumption, income and carbon emissions in the United States. Ecological Economics, 62, 482–489. https://doi.org/10.1016/j.ecolecon.2006.07.009
State Energy Concept ASEK, (2014). Available from Internet: http://www.komora.cz/pro-podnikani/legislativa-a-
normy/pripominkovani-legislativy/nove-materialy-k-pripominkam/160-14-aktualizace-statni-energeticke-koncepce-cr-t-29-9-2014.aspx.
Stern, D. I. (2000). A multivariate cointegration analysis of the role of energy in the US macroeconomy. Energy Economics, 22, 267–283. https://doi.org/10.1016/S0140-9883(99)00028-6
Svatkova, S. (2009). Spotrebni a ekologicke dane v Ceske Republice. 1.edition. Wolters Kluwer, Praha.
Yale Center for Environmental Law and Policy, 2014. 2014 Environmental Performance Index. [Online]. Available from Internet: http://epi.yale.edu/epi/country-profile/czech-republic. [30. June, 2014].