(UDC: 612.13/.15)
Transport and biomechanical studies in the isolated blood vessel segment
M. Rosic1, S. Pantovic1, M. Colic1, V. Ilic2, Z. Tepic2.
1Medical Faculty, Department of Physiology, University of Kragujevac, Serbia 2Faculty of Technical Science, University of Novi Sad, Serbia
Abstract
Experiments on the isolated blood vessels are very important for investigation of drug effects, new drug development, blood vessels regulatory mechanisms and other functional and biomechanical investigations. In this paper we designed an experimental study and mathematical model for dynamics response of blood vessel under different load conditions. The results from these experiments demonstrated influence of shear stress dynamics and other biomechanical properties of the blood vessel. Also the effects of drugs are different even they produce the same relaxation or constriction at alternate steady states. Experimental data for different shear stress-strain curves were fitted using exponential mathematical function. This research is very important for biomechanical analysis of blood vessels during dynamics loads.
Key words: Transport study, biomechanical analyses, isolated blood vessel segment
1. Biomechanical studies
Ex vivo blood vessels experiments in numerous studies [Ligush et al. 1992], [Madden et al 1999], [Marra et al. 2006], [Jerius et al. 2000], [Plane et al. 1998], [Gonzales et al. 2001], [Sofola et al. 2004], [Leone et al. 2004] have been commonly performed in strips or rings of blood vessels as well as in the isolated perfused blood vessels segments.
All mentioned experimental methods were used for various functional investigation (drug effects on smooth muscle, regulatory mechanisms in control of vascular tonicity, etc.) and biomechanical investigations (uniaxial or biaxial stretch, to obtain stress-strain relations and other biomechanical parameters).
Each experimental design has been created to provide some specific information such as: relaxation or constriction of blood vessels smooth muscle under different conditions, or passive and/or active biomechanical properties of blood vessels.
0 2 4 6 8 10 12 14 16 18
0 5 10 15 20
Time
P
ress
u
re
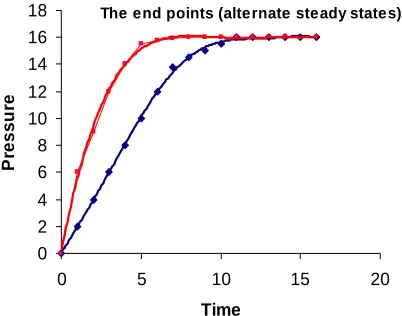
The end points (alternate steady states)
Fig. 1. The “end points” (alternate steady states) of blood vessel response to some drugs could be the same, but dynamic responses could be different. This will lead to different dynamic of
shear stress and other biomechanical properties of the blood vessel, and the effects of these drugs will be different even they produce the same relaxation or constriction at alternate steady
states.
In our studies [Rosic et al. 2006], [Rosic et al. 2008], [Pantovic et al. 2009], [Kostic et al. 1995] we use a new approach to ex vivo (isolated perfused blood vessel segments) experiments in which not only the end points of vessels response within the time interval of dynamic loading is considered, but also dynamics of this response. Further, the functional and biomechanical investigations could be performed at the same time by means of single experimental design.
This experimental method is created to measure the changes in pressure and vessel diameter when an abrupt change of pressure occurs at the vessel outlet, by applying various hydrostatic levels or resistance as step functions.
We evaluate the time history of the pressure and the vessel diameter changes in between alternate steady states, represented by the pressure-time and diameter-time curves.
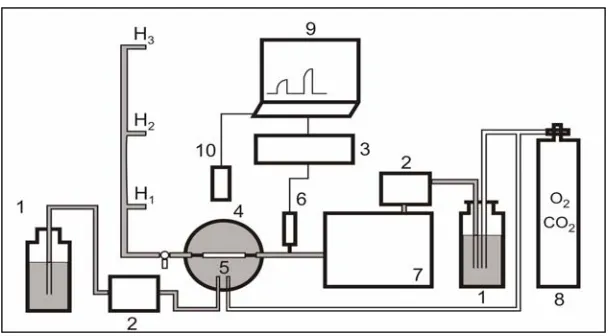
Intraluminal pressure at the constant perfusion flow and changes in blood vessels diameter, under different hydrostatic pressure conditions in the isolated blood wessel, were measured by means of the System for Biomechanical and Functional Tissue Investigations (Fig. 2)
The System for Biomechanical and Functional Tissue Investigations allows:
Continual recording of pressure and/or force developed during various design of experiments (electro stimulation, drug effects, stretch, etc.) by mechanoelectrical transducer and/or pressure transducer (by applying various hydrostatic levels at the vessel outlet);
Continual recording of changes in blood vessel outer diameter during experiment;
Continual addition of drugs into the perfusion medium by micro infusion pump, for drug effects investigations;
Linear or nonlinear fitting of experimental data (pressure and blood vessel diameter) with various mathematical formulas;
Fig. 2. Schematic diagram of the System for Biomechanical and Functional Tissue Investigations (1. perfusion fluid; 2. peristaltic pump; 3. AD converter and amplifier; 4. organ bath; 5. blood vessel; 6. transducer; 7. water bath; 8. oxygen bottle; 9. PC; 10. Camera; 11. H0,
H1, H2, H3 hydrostatic levels.)
Experimental data as the pressure/time curves were fitted using an exponential mathematical function:
21
1
b x
y
b
e
(1) where y is the pressure (in mmHg) and xis the time (s). Also, b1 and b2 are the coefficients of
the curve: b1 has units of pressure, and b2 has units of time-1.
The dominant time constant follows from the function (1): T= 1/ b2. We consider that the
alternate steady state is reached for t=5T (t=time).
To define dynamic properties of the blood vessels, we introduce a coefficient of the comparative pressure dynamics (Pd)
The coefficient of comparative pressure dynamics (Pd) is defined as the integral of the difference between two fitted curves, normalized with respect to the applied hydrostatic pressure (H):
1
1
0
2 2
1
1
1
d
b a
b x b x
P
b
e
b
e
dx
H
(2)where b2a is the coefficient of the first curve (control curve) and b2b is the coefficient of the
second curve (test curve –in the presence of some investigated drug or stimuli). Here b1 is
considered the same for booth function under the integral. The solution of the equation (2) is:
2 2 1
2 2
b a
d
a b
b
b
b
P
H b
b
(3)The calculated Pdis the area between the test and control curves and it is normalized to
left and faster development of maximal pressure (alternate steady state). In contrary, negative value of the Pd indicate the shift of the test curve to the right and slower development of
maximal pressure.
We also introduce a coefficient of total pressure dynamics (TPd) as the area under the test
and/or control curves which can be calculated from the equation:
2 1 1 2 2 b x d
b
e
TP
b x
b
b
(4)This coefficient is useful for comparing the results obtained from separate experimental group (treated and untreated animals; males and females etc.)
Experimental data, presented as the diameter/time curves, were fitted using exponential mathematical function (1), as described in the previous section, but in this case y is the blood vessel diameter (mm) and xis the time (s). Here, b1 and b2are the coefficients of the curve: b1
has units of diameter and b2 has units of time-1.
The constant b1 now represents the maximum diameter, when the experimental curve
approximately reaches the value of the alternate steady state.
As in the previous protocol we consider that alternate steady state is established for t=5T.
Analogously to the expression (2), we define distensibility properties of the blood vessels by the coefficient of comparative distensibility Dk:
1 10 0
2 2
1
1 1
k b a
b x b x
D b e b e dx
D (5)
where D0 is the original vessel diameter. The meaning of the coefficients b1, b2aandb2b are as
for the relationship 7. Further, we have:
2 2 1 2 2 b a k a bb
b
b
D
D b
b
(6)Positive values of Dk indicate faster development of maximal diameter (alternate steady
state), while negative values indicate slower development of maximal diameter.
Continual recording of pressure and diameter during experiments allows us to evaluate the stress and strain according to the following relations:
t t t t R P (7) where, σ - stress [kPa]; P - pressure; R- blood vessel internal radius; δ - blood vessel wall
thickness; and
00
mt m
t
m
R R
R (8)
where, ε - circular strain; Rm - blood vessel mean radius; Rm0 - blood vessel mean radius at the
The calculated values are than presented as the stress-strain curves and fitted using a nonlinear (polynomial) mathematical function.
Assuming that the blood vessel wall is incompressible, we can determine the wall thickness for the current mean radius
2 0
t mt mt
V
R R L
(9) where, L - length of the isolated blood vessel; and V0 is the original volume of the blood vessel,
0 0 0 0 0
V
R
L
(10) where, the sub index „0“ indicates the original values.
The wall shear stress (kPa) can also be calculated from the following equation:
4
3t
t
Q
R
(11)where τ - shear stress (kPa); μ - viscosity (poise); Q - flow (ml/s);
The calculated values are then presented as the shear stress–strain curves and fitted using nonlinear (polynomial) mathematical function.
2. Rapid dual –isotope dilution method
The transport of a radiolabeled test molecule can be investigated by means of rapid dual-isotope dilution technique using the same experimental setting described above (Fig.2).
This technique measures the relative extraction of the test molecule in relation to mannitol, (as an extracellular reference tracer), or radiolabeled albumin (as an intravascular reference tracer), as it transits the blood vessel segment.
The rapid dual-isotope dilution technique allows calculation of following transport parameters [Kostic et al 1995], [Rosic et al. 1998], [Rosic et al. 2001]: maximal cellular uptake (Umax), net cellular uptake (Unet), backflux (BF), fractional and maximal extraction (Ef and Emax) from intravascular compartment, as well as transport capacity (Vmax) and Michaelis-Menten (affinity) constant (Km) for carrier mediated transports.
After the blood vessel have been excised and perfused with a peristaltic pump using the constant-flow technique, a bolus containing 3H test molecule and D-14C manitol as an
extracellular reference tracer or 14C albumin as an intravascular reference tracer have been
injected into the perfusion system.
The effluent samples have been sequentially collected and than prepared for counting in a Rackbeta scintillation counter.The activity of each isotope recovered in the effluent sample, in desintegrations per minute (d.p.m.), has been than ploted against collection time or sample number in order to obtain concentration-time curves, i.e. dilution profiles for both test and reference traces.
The cellular uptake of test molecule have been estimated directly from the dilution profiles using eq. (12), where 3H test and D-[14C]mannitol represent activities (in d.p.m.) recovered in
successive effluent samples.
Uptake (%) = (1- [3H] test / D-[14C] mannitol) 100 (12)
If we use albumin instead of mannitol as a reference tracer, than calculated value from eq. (12) will represent extraction of test molecule from intravascular to extravascular space.
The maximal uptake (Umax) for test molecule is the mean of the uptake values taken over the time period when the uptake has reached a plateau.
The Unet is the mean uptake over the whole period, i.e. the recovered activity in all samples. The net cellular uptake (Unet) can be calculated as:
Unet= (1- Total recovered 14C / Total recovered 3H) 100 (13)
The backflux (BF) of test molecule (from intracellular to extracellular space or from interstitial to intravascular space) can be calculated as:
BF= (Umax-Unet) / Umax (14)
The unidirectional transport or flux of test molecule has been estimated (in mmol min-1 g-1) from the maximal fractional tracer uptake (Umax), the perfusion rate (F, ml min-g-1) and concentration of unlabelled test molecule in perfusate (Ca,M):
V = -Fln (1-Umax)Ca (15)
Linear increase of V indicates nonsaturable transport (simple diffusion) while exponential increase indicates carrier mediated transport.
From the rate of test molecule uptake at different concentrations of unlabelled test molecule, the maximal rate of transport (Vmax) and Michaelis-Menten constant (Km) can be calculated using Eadie-Hofstee analysis if the transport is carrier mediated.
3. Concluding remarks
Извод
Биомеханичкаанлизаитранспортнастудијанаизолованомкрвномсуду
M. Rosic1, S. Pantovic1, M. Colic1, V. Ilic2, Z. Tepic2.
1Medical Faculty, Department of Physiology, University of Kragujevac, Serbia 2Faculty of Technical Science, University of Novi Sad, Serbia
Резиме
Експериментинаизолованимкрвним судовимасувеомазначајнизаиспитивањеефекта
дејства и развоја нових лекова, регулаторног механизма и осталих функционалних и
биомеханичкихистраживања. Уовомрадуједизајнираноексперименталноистраживање
и математичкимоделзадинамички одзивкрвних судова подразличитим оптерећењем.
Резултати ових експеримената показују утицај динамике, смичућег напона и
биомеханичких карактеристика крвних судова. Такође је показано да су ефекти
коришћења лекова различитииако производе истурелаксацију и сужење припромени
стационарногстања. Експерименталниподацизаразличитедијаграмесмичућегнапонаи
деформације су фитоване помоћу математичких функција. Ово истраживање је веома
значајнозабиомеханичкуанализукрвнихсудовазавремединамичкогоптерећења.
Кључнеречи: Транспортнастудија, биомеханичкастудија, изолованикрвнисуд
References
Ligush J, Labadie RF, Berceli SA, Ochoa JB, Borovetz HS. Evaluation of endothelium-derived nitric oxide mediated vasodilatation using ex vivo perfusion in an intact vessel. J Surg Res 1992; 52:416-21.
Madden JA, Christman NJT, Integrin signaling, free radicals and tyrosine kinase mediate flow constriction in isolated cerebral arteries. Am J Physiol 1999; 277:H2264-71
Marra SP, Kennedy FE, Kinkaid JN, Fillinger MF. Elastic and rupture properties of porcine aortic tissue measured using inflation testing. Cardiovasc Eng 2006; 6:125-33
Jerius H, Bagwell CA, Beall A, Karolyi D, Brophy C. Vascular smooth muscle mechanics in isolated perfused segments of carotid arteries. Surgery 2000; 127(2):148-54
Plane F, Wiley KE, Jeremy JY, Cohen RA, Garland CJ. Evidence that different mechanisms underlie smooth muscle relaxation to nitric oxide and nitric oxide donors in the rabbit isolated carotid artery. Br J Pharmacol 1998; 123(7):1351-8
Gonzales MC, Arribas SM, Molero F, Fernandez-Alfonso MS. Effects of removal of adventitia on vascular smooth muscle contraction and relaxation. Am J physiol Heart Circ Physiol 2001; 280:H2876-81
Sofola O, Knill A, Myers D, Hainsworth R, Drinkhill M. High-salt diet and responses of the pressurized mesenteric artery of dog to noradrenaline and acetylholine. Clin Exp Pharmacol Physiol 2004;31(10):696-9
Rosic M, Pantovic S, Obradovic Z. Experimental and mathematical model for the evaluation of dynamic responses of isolated vessels. Medicus 2006;7(3):98-102
Rosic M, Pantovic S, Rankovic V, Obradovic Z, Filipovic N, Kojic M. Evaluation of dynamic reponse and biomechanical properties of isolated vessels. J biochem Biophys Methods 2008; 70:966-72
Pantovic S, Rosic G, Obradovic Z, Rankovic G, Stojiljkovic N and Rosic M. Dynamic response of blood vessels in acute renal failure. Gen Physiol Biophys 2009; 28:87-92
Kostic M, Rosic G, Segal M and Rosic M. Biphasic L-arginine uptake by the isolated guinea-pig heart. Experimental Physiology 1995; 80:969-79
M.A. Rosic, S.B. Pantovic, A.P. Lucic, N. Ribarac-Stepic, T. Trtic, I. Andjelkovic, M.B. Segal. Triiodothyronine uptake by the isolated rat heart. Die Pharmazie, 1998; 53(5): 351-352. Rosic M. A., Pantovic S.B., Lucic A.P., Ribarac-Stepic N., Andjelkovic I.Z. Kinetics of
thyroxine (T4) and triiodothyronine (T3) transport in the isolated rat heart. Experimental