Testing Methods of Component Contents during
Rare-earth Extraction Process Based on Image
Feature Retrieval
Sen WangEast China jiaotong university, Nan-Chang City, China Email: [email protected]
Zijie Gao and Rongxiu Lu
East China jiaotong university, Nan-Chang City, China Email: [email protected]
Abstract—One online monitoring method based on the component contents of image feature retrieval is proposed to conduct the extracting and separating process for the rare-earth ion’s feature color. By analyzing different component contents of rare-earth ion color features, it is exposed with the relevance between component contents and the color feature H component. By combining the image retrieval technique based on contents, two retrieval algorithms, H component histogram and H component coherence vector, are proposed to help with the rare-earth component contents’ testing. In order to improve the soft sensing accuracy, the sensing accuracy correction algorithm based on PSO is suggested. To verify the effects of the above algorithm, the rare-earth component contents soft sensing experimenting platform based on image retrieval has been developed with VC6.0 and SQL Server. After doing imitation experiment with the component contents from the subjects of the rare-earth’s two components Pr/Nd extraction separation system, this method is proved with a fairly high testing accuracy.
Index Terms—rare-earth extraction,image feature, content retrieval, soft sensing
I. INTRODUCTION
Solvent extraction method intends to separate one or some components from other components with the help of extraction agents by allowing the contact of aqueous solution containing segregation substances with unmixable organic solvents. The solvent extraction method has been accepted as the main method for domestic rare-earth metallurgy industries to separate and purify rare-earth, as for its advantages of huge handling capacity, fast reaction speed and efficient separation effect. It has been guaranteeing the product quality to do real time online monitoring with the rare-earth extraction process, which is the foundation to carry out the automation control and operation optimization of the extraction separation process.
The previous online testing methods of component contents with the rare-earth extraction process are mainly
UV/visible spectrophotometer method, FIA, LaF3 ISE, XRF by isotope excitation, etc. But all of those methods are costly, unstable, unreliable, and difficult to maintain, thus, the application to the rare-earth extraction process shall be quite limited. Literature item [2,3] mentions one
on-line estimation based on soft sensing technique to the component contents of the rare-earth extraction process, but it requires for a huge amount of complete extraction process data from soft sensing models with fairly-high precision and fairly-strong generalization ability. All in all, this essay shall offer one real time online monitoring method based on the image feature retrieval of the component contents to the rare-earth extraction process, which focuses on the subjects of the extraction separation system to the rare-earth ion with the color traits, while analyzing the changing patterns of ions of component contents during the rare-earth extraction process. The same time, a model for the relation between rare-earth color feature (database) and component contents, together with one real time on-line monitoring system experimenting platform to the rare-earth component contents, shall be built to verify the feasibility of the method.
II. DESCRIPTION FOR THE COLOR FEATURE OF RARE
-EARTH ION SOLUTION
Two components cascade stages separation systems, which feature in the color features of rare-earth ion, have the easier extraction components gathering at the lavation period while the more difficult extraction components gathering at the extraction period, with color features respectively. Take the Pr/Nd extraction separation process in the P507-HCI system as one example, weightless green appears in the extraction period, while light purple appears in the lavation period[4]. When the
quantitatively describe the relation between the gradual changing process of rare-earth ion color features and contents variation, researchers have to further analysis with the solution image color features of rare-earth ion and its component contents’ changing patterns.
The common descriptive method for image color feature is the color histogram by Swain[5] ,that is,
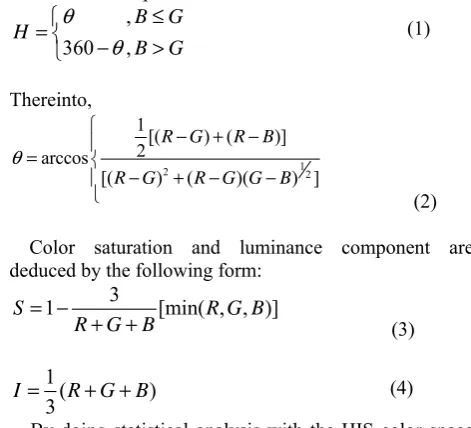
quantizing the whole color space in RGB space (R means Red, G means Green, and B means Blue), and analyzing statistically the probability histogram of each color in the image. As people have a sharper vision sense of light degrees than the shades of color, normally, HIS (H means Hue, S means Saturation and I means Intensity) color space, which is more suitable for the image feature descriptions, is adapted. Meanwhile, H, S and I are comparatively independently, so, they could be dealt with respectively, which will simplify the workload of image analysis and handling. The conversion[9] of RGB color
space helps with the information of rare-earth ion color features in HIS space as follows:
, 360 , B G H B G θ θ ≤ ⎧ =⎨ − >
⎩ (1)
Thereinto,
1
2 2
1 [( ) ( )] 2
arccos
[( ) ( )( ) ]
R G R B
R G R G G B
θ ⎧ − + − ⎪ = ⎨ − + − − ⎪
⎩ (2)
Color saturation and luminance component are deduced by the following form:
3
1 [min( , , )]
S R G B
R G B
= −
+ + (3)
1 ( )
3
I = R+ +G B (4)
By doing statistical analysis with the HIS color space distribution of rare-earth ion solution images with different component contents being collected respectively on the spot and in the experiment labs, people can find out the color H component histogram shows a more obvious change with the changing rare-earth component contents. Table 1 describes the variations circumstances of mean value of Nd component contents in the color H component histogram from 68.42% to 89.20% when dealing with Pr/Nd extraction separation process.
TABLE I:
THE VARIATIONS CIRCUMSTANCES OF COLOR HCOMPONENT WITH
THE COMPONENT CONTENTS
Nd component content/% Hue histograms’ distribution range Main component position of Hue Hue components’ mean statistics*100
68.42 145-150 147 87.7
72.39 146-150 148 84.2
75.68 147-151 149 80.2
81.89 148-153 151 72.9
84.66 150-155 153 65.8
89.2 151-157 155 53.9
Table 1 shows H component histogram presents an obvious difference in the rare-earth solution colors with the varying rare-earth ion Nd component contents, including its H histogram distribution range, main component positions of H and H components’ mean statistics. Therefore, a certain relation is shown between the H component of rare-earth solution colors and its component contents, which is why a H component description database for the ion color of the rare-earth ion extraction process could be built, and one real time online monitoring system to realize the rare-earth component contents based on image feature retrieval techniques could be applied.
III. TESTING METHOD OF COMPONENT CONTENTS BASED
ON IMAGE RETRIEVAL
The following is the introduction to the online monitoring of realizing rare-earth component contents by using H component of solution colors.
A. The Establishment of Rare-earth ion Color Feature Retrieval Base
With 300 frames of color images being taken from spot collection and lab solution collocation, a color image database can be built to cover the whole production process of Pr, Nd component variation range, which shall take the two Pr/Nd component cascade stage extraction process in the P507-HCl system as object of study. Among them, the single Nd component content variation range is from 9.97% to 96.06%, which meets the requirements of the online monitoring range from 10% to 90% for component contents during the production process.
With the setting-up of the above color image database and abstraction of its features, the rare-earth ion color feature retrieval database shall be built up. The abstraction of image features is the transitional process from image content information to abstract mathematics description, concerning image understanding, analysis and setting-up of mathematics models, etc. This paper uses the H component histogram of rare-earth ion colors and the H component aggregation vector quantity to describe color features. As the H component histogram has been introduced in the above parts, the following parts will focus on depicting the color feature vector of the H component aggregation vector quantity.
difference of having a more classified category of each component quantity in the H component histogram.
By abstracting 313 collected frames with the H component histogram and the H component aggregation vector quantity, each image in the form of feature vector description will be stored in the image feature database. Suppose one quantized image is described as C(x,y), the H component color histogram feature will descry to be the image as:
( , )
=
HC x y
w
(5)1 2 256
[ , , ,
]
H
w
=
x x
"
x
,andx
i∈
{0,1, ,255}
"
(6)In the above,
w
H refers to the H component proper value, whilex
i refers to the respective color value after quantizing the H component color histogram, with the color value range as 0-255.So, the H component color aggregation vector quantity can be described as the following;
' ' '
1 1 2 2 256 256
[
,
, ,
]
ccv
w
=
x
+
x x
+
x
"
x
+
x
,and
x
i、
x
i'∈
{0,1, ,255}
"
(7)In the above,
x
i, refers to aggregation pixel, while'
i
x
refers to non-aggregation pixel, the others refer to the previous descriptions.
B. Testing Method of Component Contents Based on Feature Retrieval
The testing method of component contents based on feature retrieval is realized by matching image retrievals, for the algorithm of image similarity measurement determines the accuracy of image matching.
The algorithm essence of image similarity is calculating the similarity degree of corresponding image features. Usually, image features are described by vector, as listed in formula (6) and (7). Normally, the image feature vector is thought as one point in the multidimensional space, then the distance between points of feature space is used to show the similarity degree of images, so, to retrieve the matching process is to find out those images most close to each other, that is, the same or similar images.
This paper uses weighting Euclidean distance to measure the similarity among image features, when realizing the component contents testing by doing image retrieval of rare-earth ion color features. When analyzing the relation between color feature and its component contents in HSI space, an obvious shift appears when the maximum value of the H component changes with component contents, so, an improvement of the weighting Euclidean distance, which adapts better to the similarity measurement of mixed rare-earth solution image, can improve the precision of the image retrieval. The improved calculation formula is as follow:
max max
256
1
(
j)
jj ip ip p p
i
p
p
α
x
x
β
y
y
=
− =
∑
−
+
−
(8)
In the above,
p
refers to the target image,p
jrefers to the to be retrieved image in the image database,x
ip、j
ip
x
refers to the color feature vector ofp
、p
jrespectively,
y
pmax 、y
pjmax refers to the maximumposition of
p
、p
j’s color feature the H component, andα
、β
are the weighting coefficient.With theanalysis of the retrieval results, the distribution of component contents shows a certain pattern based on the retrieved result image of the above two color features, that is, the initial retrieval result has one certain component content as the center with some certain percentage fluctuating. Therefore, an average method is adopted in this paper to calculate the component contents of to-be-retrieved images, that is, the component content result is obtained by using the average when the similarity of the image contents reaches 1.
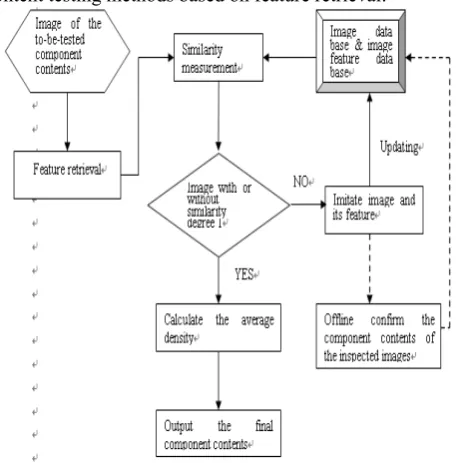
As shown in graph 1 is the flow chart of component content testing methods based on feature retrieval:
Figure 1: The flow chart of component content testing methods based on feature retrieval
IV. HE CORRECTION METHOD TO THE TESTING
ACCURACY OF COMPONENT CONTENTS TESTING
Color feature extraction and its feature similarity determine, to a degree, the accuracy of the initially retrieved rare-earth component contents, but the initial retrieval results do not mean a satisfactory retrieval accuracy. Hence, RF technique[8,9] is introduced from the
CBIR research field[8,9]. To apply certain RF technique
is done with the RF, thus, a soft sensing accuracy correction method is born, including two parts: feature database correction and extraction process optimization correction..
A. Updating Feature Database
Even though the process of building a database is supposed to simulate the actual process of Pr/Nd extraction production line, there is no 100% guarantee to the completeness of all the images and their feature database. Under that circumstance, it is necessary to keep updating the existed images and their feature data accordingly, as shown in graph 1, a certain judgment has to be made for the same color feature image after the retrieval matching, once there is no such possibility, the image and its color feature value have to be copied for an off-line computation to gain its component contents, which is to store and update the feature base.
Since the component contents of the to-be-retrieved image remains uncertain when updating the feature base, a formula (9) is used to show the relation between to the previous color feature
μ
H and its component contents off-line, thus, the component contents are ascertained. The flow goes like the Graph 1.3 2 2
1391.0 156.1 7.0 1.0,0.0130 0.1020 ( )
0.1020 0.160 109.7266 34.1644 2.766,
H H H H
H
H H
p x
μ
μ
μ
μ
μ
μ
μ
⎧− + − + ≤ ≤
⎪
=⎨ ≤ ≤
− +
⎪⎩
(9)
B. Adjusting Optimization of the Retrieval Process It is essential to do adjustment to the retrieval process in order to improve retrieval accuracy, that is adjusting optimization of the retrieval process, which is actually one algorithm of query optimization. Meanwhile, considering the former successful application of PSO algorithm in many optimization puzzles, this paper proposes one soft sensing accuracy adjustment method based on PSO by combining PSO and RF. The method is one online interactive method, which meets the real time testing requirements of rare-earth component contentsG. A Quick Checklist
The soft sensing accuracy adjustment method based on PSO initializes one particle swarm according to users’ initial feedback results in the assigned image feature space, and then co-guides the aviation particles in feature space together with users under the supervision of chosen exemplary images. The feedback image is artificial in a certain degree, but basically some certain component contents from the initial retrieval results are chosen as the center, with certain fluctuating percentage image as the ideal solution, which is the initial value of particle swarm optimization.
By assigning the first labeled designate feature code of N frames image, the particle optimization spaces from the extracted color feature contents amount are set as 258 dimensions. The feedback image features are real-number coded as the initial position of particles
x
i ,' '
1 2 256
( , ,
, , )
i
x
=
α α
"
α
β δ
; the initial speedv
iis taken as one random number in each vector component
range, so the individual optimal position is presented as
1 2
( , , ,
)
i i i iQ
p
=
p
p
"
p
, and the global optimal position isp
g=
( ,
p
g1p
g2, ,
"
p
gQ)
.The updating formula for the position speed of the particle swarm optimization is as following:
1
1
(
)
2(
)
k k k k k k
id id id id gd id
v
+=
wv
+
c
ξ
p
−
x
+
c
η
p
−
x
(3)1 1
k k k
id id id
x
+=
x
+
rv
+ (4) In the above,w
refers to inertia weight,c c
1=
2=
2
refers to learning factor,
ξ
,η
are equally distributedrandom numbers in the section [0,1], and
r
refers to constraint factor.If suppose the feedback image as
p p
1, ,
2"
p
N, the target image asp
, then the fitness function is defined as:max max
256
' ' ' '
1 1 1
( , , )i N j N ( i ipj ip) pj p
j j i
f α β δ p p β α x x δ x x
= = =
=
∑
− =∑ ∑
− + −(5)
The similarity of target image and image group is defined as:
max max
256
1
(
j)
jj i ip ip p p
i
p
p
β
α
x
x
δ
x
x
=
− =
∑
−
+
−
(6)
In the above,
β
,δ
are similar weight as thedetermined value, which means
β
=
0.4,
δ
=
0.6
. Hence, the relative feedback puzzle based on PSO is described as finding one vectorx
i in the space [0,1], thatis, the formula
x
i=
( , ,
α α
1 2"
α
256, , )
β δ
' ' makesthe distance between the feedback image and the target image the shortest.
V. XPERIMENTAL TESTING AND RESULTS ANALYSIS
A. The Framework for the Lab Platform
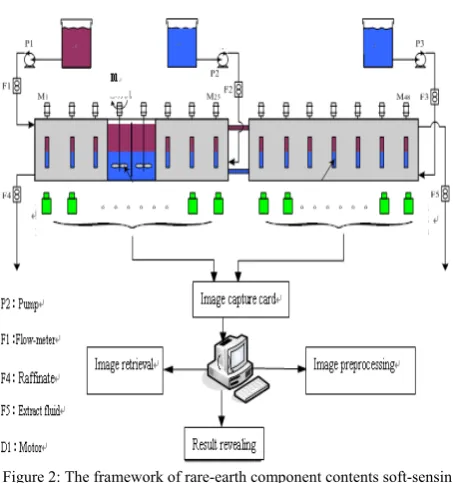
Figure 2: The framework of rare-earth component contents soft-sensing based on feature retrieval
The diagram takes the most obvious rare-earth ion feature color (the maximum concentration) and some cell body in different degrees before and after as the video monitoring point, and collects rare-earth solution images with different component contents. It is usually supposed that the most obvious rare-earth feature color is at cell body J under the optimal extraction technique condition, so cell body J and several other cell body before and after are taken as the video monitoring point. By collecting on the spot the rare-earth solution images with different component contents with a video camera Guppy F-033C, the clipped pictures are to be stored in the format of bmp. After the pre-processing with the main images on the platform of the rare-earth component contents soft-sensing based on CBIR technology, image retrieval matching and soft sensing results presentation, the specifics are as follows:
Figure 3: The structure diagram of rare-earth component contents soft-sensing based on image retrieval
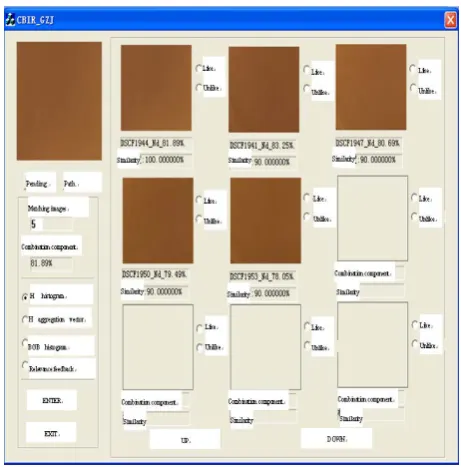
Figure 4: The lab platform of rare-earth component contents soft sensing based on image retrieval
One company in Jiangxi Province offers the experiment subjects from the color images extracted from different Pr/Nd solutions in the rare-earth extraction and separation system. All the images are processed into 128*128 pixel. Based on the theory foundation of this paper, one platform of rare-earth component contents soft sensing based on CBIR is programmed with VC 6.0 and SQL Server technique, and the operation interface is shown in Graph 4.
To verify the effects of the above rare-earth component contents soft sensing method based on image retrieval, Nd component image database, that is Nd component, is chosen as the testing subject, with the range being defined as C(Nd)=(9.97%--96.06%).
The experiment content: to one certain component content of rare-earth solution image, firstly, its two flag value of the H component histogram and the H component color coherence vector are calculated; secondly, the similarity degree between the rare-earth solution images in the image database are calculated to retrieve one frame of several frames rare-earth solution images and their corresponding component contents, and export the component contents of the tested image; if the user is not satisfactory with the retrieved results, a RF adjustment method is used to do a second or even more retrievals, and soft sending accuracy adjustment will be done, until it can meet the requirements of the user, in which a real time requirement is obtained. Lastly, rank
TABLE 3:
EXPERIMENT RESULTS.
Different Nd component
contents /%
Number of the image with the
initial retrieval similarity
as 1
Platform testing
result (initial)/%
Retrieval results after twice
accuracy adjustment
Relative error
/%
96.06 2 96.08 96.08 0.021 89.20 2 87.63 87.63 1.76 79.49 3 79.41 79.41 0.10 68.42 5 68.45 68.45 0.044 58.76 7 58.87 58.87 0.19 49.95 5 45.22 48.63 2.64 24.79 2 24.14 24.14 2.62 12.72 2 12.62 12.72 0.79
the retrieved image with the to be retrieved rare-earth solution images according to the similarity sequence. The experiment results are shown in Table 3.
Observe from Table 3, the rare-earth component real-time measured concentration can be guaranteed within
2%
±
of the actual concentration value after feedback adjustment from the perspective of retrieval. Furthermore, the whole process from collecting image to presenting retrieval results is done within 3 minutes, which meets the requirement of online testing. Moreover, the testing result of this platform can meet the accuracy requirements of online testing from the perspective of component contents testing results. It is worth noting that the retrieval results of the H component histogram and the H component aggregation vector are exactly the same, which means the color images distribution of rare-earth solution is uniform in one space, which means significantly to the further improvement to the online testing of rare-earth component contents.VI. CONCLUSION
show the platform can meet the requirements of online testing to rare-earth component contents.
REFERENCES
[1] Wang Q, Zhao Z Q, Yin G, Wu W Q, Zhang Z G, Xu Y H, Hang G W, Yang H, Wu G Q, Feng D. Development of on_Line Analysis in Rare-earth Countercurrent Extraction Processes[J].Journal of the Chinese Society of Rare-earths(in Chin.),23(S):282. 2005,23(S):282)
[2] YANG Hui , TAN Minghao , TIANYOU Chai. Neural networks based component content soft-sensor in countercurrent rare-earth extraction[J ] . Journal of Rare-earth, 2003, 21(6):691-696.
[3] YANG Hui, CHAI Tianyou. Component Content Soft-sensor Based on Neural Networks in Rare-earth Countercurrent Etraction Process[J].ACTA AUTOMATICA SINICA, 2006, 32(4):489-495.
[4] Hang G W. The research about the characteristics of Rare-earth ions in cascade extraction process control application[J]. Jiangxi Metallurgy, 1996,16(5):26).
[5] Swain M J, Ballard D H. Color Indexing[J]. Int. J. Computer Vision, 1991, (1):11-32.
[6] M Stricker, A Dimai. Color Indexing With Weak Spatial Constraints[J]. SPIE Procedings, 1996,2670:29-40. [7] Lansun Shen, Jing Zhang, Xiaoguang Li. Research on
Image Retrieval and Compressed Domain Processing Technology [M]. People's posts and telecommunications publishing house, 2008.
[8] Picard R W, Minka T P, Szunmer M. Modeling user subjectivity in image libraries[C]. In: Proceeding of International Conference on Image Processing Lausanne, Switzerland,1996.
[9] Cox I J, Miller M, Minka T P, Yianilos P. An optimized interaction strategy for Bayesian relevance feedback[C]. In Proceedings of IEEE Conference on Computer Vision and Pattern Recognition, Santa Barbara, CA,1998.
[10]Kennedy J, Eberhart R C. Particle Swarm Optimization[C]. In:Proceedings of IEEE International Conference On neural networks. Vol.IV IEEE.1995.1942-1948.
[11]Qie He, Ling Wang. An effective co-evolutionary particle swarm optimization for constrained engineering design problems[J]. Engineering Applications of Artificial Intelligence, 2007,20(1):89-99.
[12]Erwie Zahara, Yi-Tung Kao. Hybrid Nelder-Mead simplex search and particle swarm optimization for constrained engineering design problems[J]. Expert Systems with Applications, 2009,36(2),Part2:3880-3886.
[13]Broilo M, De Natale. A Stochastic Approach to Image Retrieval Using Relevance Feedback and Particle Swarm Optimization[J]. IEEE Transactions on Multimedia, 2010,12(4):267-277.
[14]Xiangli Xu, Libiao Zhang, Xiangdong Liu, Zhezhou Yu, Chuanguang Zhou. Image Retrieval Relevance Feedback Based on Particle Swarm Algorithm[J]. Electronic Journal, 2010, 38(8):1935-1940.
Sen Wang was born on May 25, 1969
in Qiqihar city n heilongjiang province of China.
He graduated from Hunan university in the applied mathematics undergraduate professional in 1991,and His master graduated from the Jiangxi normal university studied on computer software and theory in 2004. He is the vice President of the graduate college in the East China Jiaotong university as a professor now, and his main research field is computer control.
.