Study of Higgs Production in Fermionic Decay Channels at CMS
Niklas Mohr1,aon behalf of the CMS Collaboration.
1Institute for Particle Physics, ETH Zürich, Schafmattstrasse 20, CH-8093 Zürich
Abstract.In these proceedings to the LHCP conference 2013 results are presented on the study of the
Higgs-like particle at a mass of 125 GeV decaying into final states consisting of eitherτ+τ−
, or abb¯quark pair, based
on the full statistics of about 24 fb−1, collected in 2011 and 2012 at 7 and 8 TeV respectively with the CMS
experiment at the Large Hadron Collider. Leptonic and hadronic decay channels for theτ-lepton are included
in the search. Different production channels namely gluon fusion, vector boson fusion (VBF) and associated
production with W/Z bosons have been studiedτ+τ−
final states. Thebb¯ decay channel is studied in VBF as
well as in associated production with W/Z and top quarks.
1 Introduction
The recently discovered Higgs-like particle [1, 2] has properties so far consistent with the Standard Model (SM) expectation in terms of spin, parity and couplings [3, 4]. However the excess in fermionic decay channels is still not firmly established. Therefore the study of Higgs prop-erties in fermionic decay channels is of great importance to confirm or disprove the SM nature of the discovered Bo-son. In the SM with the present dataset of approximately 24 fb−1 delivered by the Large Hadron Collider (LHC) and recorded by the CMS experiment [5] the Higgs de-cay modes intoτ+τ−(denoted byττin the following) and bb¯ are accessible. For a mass of 125 GeV the branching ratios are about 6.2% for theττdecay and about 57% for thebb¯ decay. In thebb¯ decay channel the different pro-duction modes are very difficult to access and suffer from very different background composition, therefore different analysis techniques are used to extract the Higgs signal in each production mode. The studied production modes cover gluon fusion (only inττ), vector boson fusion (VBF) and associated production with W/Z bosons and top quarks (only inbb¯).
In these proceedings the four main analysis channels in fermionic decay modes, H(ττ),ttH¯ (bb¯), VBF-H(bb¯) and V H(bb¯) are summarized.
2
H
(ττ)
channel
In the ττchannel [6] a combined analysis on theττ in-variant mass distribution is employed. The analysis uses the full 7 and 8 TeV dataset of 24.3 fb−1. The combined analysis tests the following production modes: gluon fu-sion, VBF and associated production with a vector bo-son. Five independentτ-pair final states have been
stud-ae-mail: [email protected]
[GeV]
τ τ
m
0 100 200 300
[1/GeV] ττ
S
/B
W
e
ig
h
te
d
d
N
/d
m
0 200 400 600 800 1000
τ τ →
H(125 GeV) observed
τ τ →
Z t t electroweak QCD
[GeV]
τ τ
m 100 150 0
20
40 H(125 GeV)Data - Background→ττ Bkg. Uncertainty
-1 = 7-8 TeV, L = 24.3 fb s
CMS Preliminary,
h
τ
h
τ , h
τ µ , h
τ e , µ e
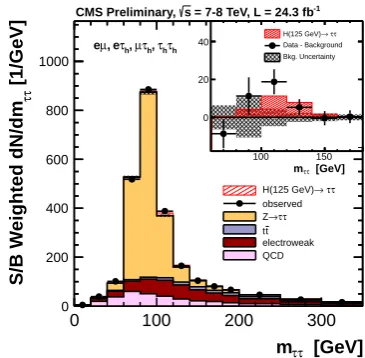
Figure 1. Observedmττdistributions for a combination of the
µτh,eτh,eµandτhτhchannels of theH(ττ) analysis. The
distri-butions obtained in each category of each channel are weighted by the ratio between the expected signal and background yields.
The insert shows the corresponding difference between the
ob-served data and expected background distributions, together with the expected signal distribution for a standard-model Higgs
sig-nal atmH=125 GeV, with a focus on the signal region.
ied: µτh,eτh,eµandτhτhchannels whereτhdenotes a re-constructed hadronicτdecay. The one-jet category selects primarily signal events with a Higgs boson produced by gluon fusion, or in association with aWorZboson decay-ing hadronically. Events in the VBF category are required to have two jets separated by a large rapidity gap, which mainly selects signal events with a Higgs boson produced by VBF and strongly enhances the signal contribution.
The event categories are defined in the following way, using jets within|η|<4.7.
© Owned by the authors, published by EDP Sciences, 2013
• VBF:In the VBF category, two jets withpT >30 GeV are required to tag the vector-boson fusion Higgs-production process. The two jets must have an invariant massMj j >500 GeV and be separated in pseudorapid-ity by∆η > 3.5. A rapidity gap is defined by requiring no additional jet with pT > 30 GeV between the two tagging jets. In theeµchannel, the largett¯background contribution is suppressed by rejecting events contain-ing ab-tagged jet ofpT >20 GeV.
• 1-jet: Events in this category are required to have at
least one jet with pT > 30 GeV, not to be part of the VBF event category, and not to contain any b-tagged jet with pT > 20 GeV. In the eτh channel, the large background from Z→ ee + jets events in which an electron is misidentified as τh is reduced by requiring MET >30 GeV.
• 0-jet:This category contains all events with no jet with
pT >30 GeV, and nob-tagged jet withpT >20 GeV. The 0-jet category is only used to constrain background normalization, identification efficiencies, and energy scales.
Backgrounds are estimated mainly from the data it-self. The dominant Drell–Yan productionZ → ττis es-timated by an “embedding” technique selectingZ → µµ events and replacing the muons with simulatedτdecays. Background fromW + jets production is estimated in a high-transverse mass control region dominated by theW+ jets and extrapolated to the signal region using simulated events. QCD backgrounds are estimated from same-sign events in data. Other small background components are estimated using MC simulations.
The SVFit algorithm is used to improve mass recon-struction in all final states and categories allowing a better separation between signal and background than using only theττinvariant mass from visibleτdecay products by uti-lizing the measurement of the missing transverse energy.
Figure 1 shows the combined observed and expected mττ distributions, weighting all distributions in each cat-egory by the ratio between the expected signal and back-ground yields for this category in amττinterval containing 68% of the signal. It also shows the difference between the observed data and expected background distributions, together with the expected distribution for a SM Higgs bo-son signal withmH=125 GeV.
The best-fit value for the signal strength combining all channels isµ=1.1±0.4 atmH=125 GeV. Fig. 2 shows the expected and observed p-value versus Higgs boson mass. The observed excess is compatible with the presence of a standard model Higgs boson of massmH =125 GeV, for which the local significance is 2.85σ.
3
t
tH
¯
(
b
b
¯
)
channel
In thettH¯ (bb¯) channel [7] the events are classified based on the decay of the associated top quarks: lepton+jets and dilepton events. The dominant background consists oftt¯events. The analysis uses the full 7 TeV and the first 5.1 fb−1of the 8 TeV dataset, so in total an integrated lu-minosity of 10.1 fb−1.
[GeV]
H
m
110 120 130 140
Local p-value
-8
10
-7
10
-6
10
-5
10
-4
10
-3
10
-2
10
-1
10 1
σ 5
σ 4
σ 3
σ 2
σ 1
p-value observed
p-value expected CMSPreliminary, s=7-8 TeV, L = 24.3 fb-1, H →ττ
Figure 2. Observed and expected p-value 1-CLb, and the
cor-responding significance in number of standard deviations in the
H(ττ) analysis. These results include the search for a SM Higgs
boson decaying into aτpair and produced in association with a
WorZboson decaying leptonically.
(GeV) H m
110 115 120 125 130 135 140
SM
σ
/
σ
9
5
%
C
L
l
im
it
o
n
0 2 4 6 8 10 12 14 16 18
20 Observed
σ
1
±
Expected
σ
2
±
Expected
Lepton+Jets and Dilepton -1
= 8 TeV, L = 5.1 fb s ;
-1
= 7 TeV, L = 5.0 fb s CMS
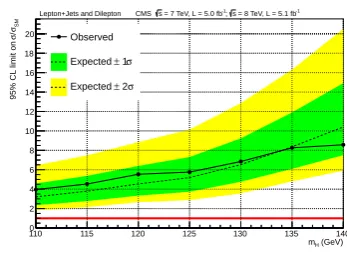
Figure 3. The observed and expected 95% CL upper limits on
the signal strength parameter for lepton+jets and dilepton
chan-nels combined in thettH¯ (bb¯) channel.
To increase the sensitivity of the analysis selected events are separated into different categories based on the number of jets andb-tags. For lepton+jets events, the fol-lowing seven categories are used:≥6 jets+2 b-tags, 4 jets
+ 3 b-tags, 5 jets +3 b-tags, ≥6 jets+3 b-tags, 4 jets
+4 b-tags, 5 jets+≥4 b-tags, and ≥6 jets +≥4 b-tags. For dilepton events, only two categories are used: 2 jets+ 2 b-tags and≥3 jets+≥3 b-tags.
Backgrounds are estimated from MC simulation and the dominant systematic uncertainties originate from the tt¯+bb¯theoretical uncertainty as well as from b-tagging.
The observed (expected) 95% confidence level (CL) limit on the cross section for Higgs boson production in association with top-quark pairs for masses from 110–140 GeV, have been derived using the 7 TeV and 8 TeV sam-ples (Fig. 3). No significant excess is found and the limit at a Higgs boson mass of 125 GeV is 5.8 (5.2) times the standard model expectation.
4 VBF-
H
(
b
b
¯
)
channel
In the VBF-H(bb¯) channel [8] events are characterized by two forward quark jets and twob-jets originating from the decay of the Higgs boson. The by far dominant back-ground consists of purely QCD multi-jet events which al-ready were reduced at the trigger level. Data at a cen-ter of mass energy of 8 TeV corresponding to an inte-grated luminosity of 19 fb−1 have been analyzed. The events are selected by requiring four jets with pT > 85, 70, 60, 40 GeV. The four jets are ordered in pairs labeled “bb” and “qq” alternatively with b-tag ordering, where the “qq” pair is made with least b-tagged jets, and withη ordering, where the “qq” pair is the mostη -separated jet pair. For both orderings the event selection further requiresmqq >300 GeV and∆ηqq >2.5. Finally, to remove the large QCD contribution of back-to-backbb pairs, events are required to satisfy∆φbb<2, for the b-tag ordered jet pair only.
To further identify if the less b-tagged jet pair among the four leading jets is likely to originate from the hadronization of a light (u,d,s-type) quark, as for signal VBF tagging jets, or from gluons, as is more probable for jets produced in QCD processes, a quark-gluon discrimi-nator has been applied to the b-tag sorted “qq” candidate jets.
The signal extraction is performed on the bbpair in-variant mass distribution. To improve the mass resolution a neural network regression technique is employed. The sensitivity of the analysis within pre-selection is improved by classifying the events based on a neural network using the characteristics of the “qq” jet pair in order not to bias thebbpair invariant mass distribution.
Data are categorized in four categories and a polyno-mial of fifth degree is used to model the QCD continuum background. A fit of thebbpair invariant mass distribution in the most sensitive category is shown in Fig. 4.
To validate the search strategy thembbfit is performed in the same way as for the Higgs boson search, but try-ing to extract VBF Z production withZ → bb¯. The data yields 2844±1127 events in the Z peak, i.e. a fit of the Z peak with a significance of 2.5 standard deviations, in agreement with expectations derived using Monte Carlo pseudo experiments.
Based on all four categories upper limits, at the 95% confidence level, on the production cross section times the branching ratio, with respect to the expectations for a stan-dard model Higgs boson, are derived for a Higgs boson in
Events / 2.5 GeV 50
100 150
200 CAT4Data
Background-only Fit σ 1 ± Fit σ 2 ± Fit
10 × Signal (125 GeV) -1
= 8 TeV L = 19.0 fb s
CMS Preliminary
(GeV)
bb
M
80 100 120 140 160 180 200 220 240
Data-Fit
-50 0 50
Figure 4. Fit of the background model to the datambb
distri-bution in the most sensitive category of the VBF-H(bb¯) analysis.
The top panel show the fitted curve and the amplified distribution of the searched SM signal, in red. The bottom panel shows the data minus fit residuals, together with the fit one and two sigma uncertainty band.
Higgs Mass (GeV)
115 120 125 130 135
SM
σ
/
σ
9
5
%
A
s
y
m
p
to
ti
c
C
L
L
im
it
o
n
0 2 4 6 8 10 12 14
Observed S CL
Expected S CL
H125 Injected S CL
σ 1 ± Expected S CL
σ 2 ± Expected S CL
CMS Preliminary = 8 TeV s
-1 L = 19.0 fb
b b
→
VBF H
Figure 5.Expected and observed 95% confidence level limits on the signal cross section in units of the SM expected cross
sec-tion for the VBF-H(bb¯) analysis, as a function of the Higgs
bo-son mass, including all four higher ANN event categories. The limits expected in the presence of a SM Higgs boson with mass 125 GeV are indicated by the dotted curve.
the mass range 115–135 GeV. In this range, the expected upper limits in the absence of a signal vary from 2.4 to 4.1 times the standard model prediction, while the correspond-ing observed upper limits vary from 2.4 to 5.2 (Fig. 5).
At a Higgs boson mass of 125 GeV the expected limit is 3.0 and the observed limit is 3.6. The fitted signal strength isµ=σ/σSM=0.7±1.4.
5
V H
(
b
b
¯
)
channel
In theV H(bb¯) channel [9] the full LHC dataset of 24 fb−1 at 7 TeV and 8 TeV has been analyzed. The follow-ing modes are included in the search: W(µν)H, W(eν)H, W(τν)H, Z(µµ)H, Z(ee)H and Z(νν)H, all with the Higgs boson decaying tobb¯.
[GeV] b b M
0 50 100 150 200 250
weighted entries / 15
0 20 40 60
80 Data
VH (125 GeV)
VV
Sub. MC stat. uncert.
Visible MC stat. uncert.
CMS Preliminary
-1
= 8TeV, L = 19.0 fb s
-1
= 7TeV, L = 5.0 fb s
b b → VH; H → pp
Figure 6. Weighted dijet invariant mass distribution, combined
for all channels of theV H(bb¯) analysis. For each channel, the
relative weight of each pT(V) bin is obtained from the ratio of
the expected number of signal events to the sum of expected
sig-nal and background events in a window ofmb¯bvalues between
105 and 150 GeV. The expected signal used corresponds to the production of a Higgs boson with a mass of 125 GeV. The weight
for the highestpT(V) bin is set to 1.0 and all other weights are
adjusted proportionally. All backgrounds, except dibosons, have been subtracted. The solid histograms for the background and the signal are summed cumulatively. The data is represented by points with error bars.
a few times larger than the production cross section for VH and, given the nearly identical final state for VZ with Z→bb¯, this process provides a benchmark against which the Higgs boson search strategy is tested.
Backgrounds are reduced by requiring a boost of the pT of the vector boson, pT(V). In that case the Higgs and Vector boson recoil away from each other with a large azimuthal opening angle, ∆φ(V,H), between them. For each mode, different regions of pT(V) boost are consid-ered. Due to different signal and background composition, each boost region has different sensitivity and the analysis is performed separately in each region. The results from all regions are then combined for each channel. The “low”, “intermediate”, and “high” boost regions for the W(µν)H and W(eν)H channels are 100 < pT(V) < 130 GeV, 130 < pT(V) < 180 GeV, and pT(V) > 180 GeV. For the W(τν)H a single pT(V)> 120 GeV region is consid-ered. For the Z(νν)H channel the “low”, “intermediate”, and “high” boost regions are 100 < pT(V) < 130 GeV, 130 < pT(V) < 170 GeV and pT(V) > 170 GeV, and for the Z(``)H channels, the “low” and “high” regions are 50<pT(V)<100 GeV andpT(V)>100 GeV.
The Higgs boson mass resolution is improved by ap-plying a bosted decision tree (BDT) regression technique. Using this a further correction, beyond the standard CMS jet energy corrections, for individual b-jets improves the bb¯invariant mass resolution by around 15%.
To estimate the backgrounds a set of simultaneous fits is performed to several distributions of discriminating
vari--4 -3.5 -3 -2.5 -2 -1.5 -1 -0.5 0
Entries / 0.25
-1
10 1 10
2
10
3
10
4
10
5
10
Data
VH (125 GeV)
Background
MC uncert. (stat.)
CMS Preliminary
-1 = 7TeV, L = 5.0 fb s
-1 = 8TeV, L = 19.0 fb s
(S/B)
10
log -4 -3.5 -3 -2.5 -2 -1.5 -1 -0.5 0
Data/(S+B) 0.5 1
1.5-4 -3.5 -3 -2.5 -2 -1.5 -1 -0.5 0
Data/(B)
0.5 1 1.5
Figure 7.Combination of all BDT discriminants of theV H(bb¯) analysis into a single distribution where all events, for all chan-nels, are sorted in bins of similar expected signal-to-background ratio, as given by the value of the output of their correspond-ing BDT discriminant (trained with a Higgs boson mass of 125 GeV). The two bottom insets show the ratio of the data to the background-only prediction (above) and to the predicted sum of background plus signal (below).
ables in the control regions, separately in each channel, to obtain consistent scale factors by which the Monte Carlo yields are adjusted.
In each of the pT(V) categories a boosted decision tree discriminator is used to distinguish signal from back-ground events. Input variables consist of topological infor-mation, b-tag related quantities and kinematic quantities. The most important variable in the analysis is the mass of thebb¯ system (see Fig. 6), which is also used as input to the BDT. To extract the VH signal a combined fit to all BDT distributions is employed.
As a validation of the multi-variate approach to this analysis, these BDT discriminants are also trained to find diboson signals (ZZ and WZ, with Z→ bb¯) rather than the VH production signal. Using this Diboson BDT the VZ process with respect to the NLO VZ cross-section, is measured to be 1.19+−0023.28with a significance exceeding 7σ. Additionally a shape analysis on the mass as a single variable is used to perform a cross-check analysis of the BDT for both VZ and VH signals, yielding consistent re-sults for both cases.
A summary of the BDT analysis is shown in Fig. 7 where all bins in the different categories are shown sorted by their s/b. An excess is visible in the most significant bins of the analysis.
[GeV] H m
110 115 120 125 130 135
Local p-value
-6 10
-5 10
-4 10
-3 10
-2 10
-1 10
1
Observed
Expected from SM Higgs CMS Preliminary
-1 = 7 TeV, L = 5.0 fb s
-1 = 8 TeV, L = 19.0 fb s
VH(bb), combined
σ 1
σ 2
σ 3
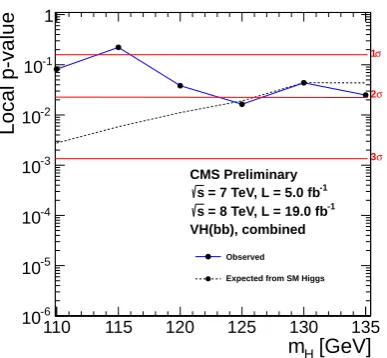
Figure 8.p-values for background fluctuations to account for the
observed excess of events in the data in theV H(bb¯) analysis.
the expected limit is 0.95. An excess of events is observed above the expected background with a local significance of 2.1 standard deviations, which is consistent with the expectation from the production of the SM Higgs boson (Fig. 8). The signal strength corresponding to this excess, relative to that of the SM Higgs boson, is 1.0±0.5.
6 Summary
Four analysis of Higgs boson production in fermionic de-cay channels have been presented. Different production channels namely gluon fusion, vector boson fusion (VBF) and associated production with W/Z bosons have been studied in theττ mode. Thebb¯ decay channel has been studied in VBF as well as in associated production with W/Z and top quarks. All derived limits, significances of the excesses and signal strength with respect to the SM expectations in the four analysis are summarized in Tab. 1.
Table 1.Observed 95% CL limits (expected in parentheses),
significance and signal strength (µ-value) with respect to the SM
expectation in the four analysis channels.
Channel Limit Significance µ-value
H(ττ) 2 (0.83) 2.9 1.1±0.4
V H(bb¯) 1.9 (0.95) 2.1 1.0±0.5 VBF-H(bb¯) 3.6 (3.0) - 0.7±1.4
ttH¯ (bb¯) 5.8 (5.2) -
-In the H(ττ) and V H(bb¯) first hints of a signal are emerging at a significance above 2σ. Individually non of the channels is able to claim an evidence for Higgs decays into fermions at present.
However, a combination of theH(ττ) and theV H(bb¯) analysis yields an observed significance of 3.4σ[4] at a Higgs boson mass of 125 GeV, which can be interpreted as evidence for decays of the Higgs boson into fermions.
Nevertheless a larger dataset will be needed to firmly establish all Higgs boson decay and production processes in fermionic decay channels. This dataset is expected to be collected at a higher center of mass energy during the LHC Run 2 starting in 2015.
References
[1] Atlas Collaboration, Physics Letters B 716, 1 - 29 (2012)
[2] CMS Collaboration, Physics Letters B716, 30 - 61 (2012)
[3] Atlas Collaboration, Atlas conference note
ATLAS-CONF-2013-040, 2013
[4] CMS Collaboration, CMS physics analysis summary
HIG-13-005, 2013
[5] CMS Collaboration, Journal of Instrumentation 3, S08004 (2008)
[6] CMS Collaboration, CMS physics analysis summary
HIG-13-004, 2013
[7] CMS Collaboration, Journal of High Energy Physics
5, 1-47 (2013)
[8] CMS Collaboration, CMS physics analysis summary
HIG-13-011, 2013
[9] CMS Collaboration, CMS physics analysis summary