A Computerized Approach towards Breast Volume
Calculation
Indra Kanta Maitra
Research Fellow
Dept. of Computer Science &
Engineering,
University of Calcutta
Kolkata, India
Sanjay Nag
Research Scholar
Dept. of Computer Science &
Engineering,
University of Calcutta
Kolkata, India
Samir K. Bandyopadhyay
Professor
Dept. of Computer Science &
Engineering,
University of Calcutta
Kolkata, India
ABSTRACT
Breast cancer and other abnormalities in breast are becoming a health hazard all over the world. The development of such diseases have no direct cause so effective diagnostics for early detection is the only way to prevent or reduce mortality. Breast volume calculation plays an important role in such diagnostics and it is also plays an important part in cosmetic surgeries of breast. Breast volume calculations are carried out using complex procedures that also includes surgical means. Calculation by using computerized methods using biomedical image processing is an important and painless method for the deduction of breast volume. In this research paper we have proposed a new three dimension model containing a two half paraboloid facing each other and lying on the same elliptical base, as a geometrical representation of breast to calculate volume. We have also formulated to calculate the volume of the same. We have used a set of two digital mammogram views (CC and MLO) for each breast and developed a fully automated system to calculate the volume.
Keywords
Mammogram, Volume, BHEA, BBDA, PMDA, and Elliptical Paraboloid
1.
INTRODUCTION
The breast cancer in women is one of the most challenging health hazards that the world is facing today. It is not only the common problem of developed nation but it has high impact on developing countries like China, India, Malaysia [1], etc. It has been found that around ten percent of all women suffer breast cancer whereas nearly twenty five percent of all cancers detected in female are breast cancers [2]. Almost all categories of cancer cells develop tumor. The tumors are named after the body part where it originates. The tumors are initiated in breast tissue. Breast tissue is made up of milk producing glands, called lobules and connecting ducts that links lobules to the nipple. Rest part is made-up with fatty, connective and lymphatic tissue [3]. The cause of breast cancer is unknown, so tangible prevention is also undefined. It is true that early detection can reduce the breast cancer mortality rate. Digital mammography is most reliable and cost effective way to determine breast cancer.
Katariya et al [4] cited two reports Wynder, Ross and Hirayaina 1960 [5] and WXynder 1968 [6] that reported that risk of breast cancer is related to the size of the breast. In contrary Kataria et al [4] also stated that according to a study
conducted in USA, observed no differences in women with cancer and normal controls, but Japanese report shows women with cancer have larger breast than normal samples. An interesting finding by the University of Liverpool team is that the women with asymmetrical breasts in volume may be more likely to develop breast cancer than others. According to them “breast asymmetry is higher in healthy women who are free of breast disease but subsequently go on to develop breast cancer than in women who remain disease-free in the same period” [7]. In view of above studies, breast volume is someway related with breast cancer. It is not only significant to diagnosis but it is an indicator of future risk. So, accurate breast volume calculation is extremely important. Breast volume has an important role in today’s cosmetic breast surgery also. The estimation of esthetics by the surgeons is highly influenced by accurate calculation of breast volume.
There are several interesting works that has been carried out to estimate breast volume by researchers of different field of studies. Some of important works are like displacement methods [7, 8], external casting [9], anthropometric measurements [10, 11] and mammographic methods [4, 12– 14]. In our work, we have proposed an automatic computer aided method to compute the volume by combining both the cranio-caudal (CC) and medio-lateral oblique (MLO) views of mammogram.
2.
LITERATURE REVIEW
In the course of literature review phase, we found several works that had been done using algebraic formulas or computerized algorithms to determine the volume of the complex structure like breast. The review work by Carl L. Kalbhen et al [14] covered the topic comprehensively related to comparing different methods of breast volume calculation. In this work, they covered three different approaches. First one is Keddy et al [13] method where they measured the maximum orthogonal breast dimensions on the CC and MLO views of mammograms and used a computer algorithm to calculate breast volume. Next they described the Katariya et al. [4] method. The last one is the method stated by Stomper et al. [12] where they have used MLO view and categorized the breast small, medium or large according to size.
The method proposed by Katariya et al. [4] is one of the most early and path breaking research. Here they used only the CC view of mammogram to calculate the volume. They visualized the breast like a cone with circular base. They considered the vertical line drawn from the nipple to base of the breast as height of cone and took half the distance of the sum of two
1 Senior System Analyst, B.P. Poddar Institute of Engineering and
parts formed on the base by the vertical line representing the height, as radius of the circular base.
James T. K. Fung et al [15] altered the Katariya et al. method. They have taken into consideration both CC and MLO view of mammogram. They have also used cone as geometrical representation of breast but they differ from the Katariya et al. method regarding base of the cone. According to their study, base of the breast is elliptical in nature rather than a regular circle. For that they have cited their logic that width of CC and MLO view are not same. So, they replace the cone with circular base model by the cone with elliptical base model.
Both the papers are well defined, related to our concept of representation of the breast as a geometric structure and significant, so, we considered these two as our base papers. Our concept has some differences related to these two papers. We consider the breast as a very complex structure that cannot be represented by simple geometric structure. We also believe that a curved structure like breast should not be represented by a cone structure because a large area of breast specifically along the curve will be omitted for the same. Here we proposed a model which will consider the complete breast.
3.
PROPOSED METHODS
Katariya et al proposed method which calculates breast volume as a circular cone on the cranio-caudal (CC) view mammogram. The limitation of this method is that the authors did not consider the medio-lateral oblique (MLO) view of mammogram. Later Fung et al proposed a method which considers both the CC and MLO view. This consideration transformed the circular cone structure to an elliptical cone structure. Though this was an improvement over Katariya et al method but it still left a significant portion of breast outside the consideration for calculation of breast volume.
Human organs like the breast is a complex geometrical structure that can be better represented as hemispherical dome with an elliptical base rather than a cone structure. The complexity further increases as it can be observed that the upper portion of the breast and the lower portion of the breast have different curvatures in the MLO view. So we divide the breast into two parts along the plane that is formed by the longest perpendicular distance from chest wall to skin adjacent to the nipple. The upper part of the breast is the region that extends from lateral thoracic artery to the aforesaid plane. The lower part extends from the dividing plane to the infra-mammary fold. We take into consideration these assumptions while proposing our method.
For evaluation of our said methods we have used the mammogram database from Lawrence Livermore National Laboratories (LLNL), along with University of California at San Francisco (UCSF) Radiology Dept. The library contains 198 films from 50 patients (4 views per patient containing CC and MLO views) selected among a wide range of subjects of interest. These films were digitized to 35 microns and all pixels were sampled to 12 bits of grayscale. The images in the database vary in dimensions and have been standardized by us to 1024 by 1024 pixel for optimization.
3.1
Isolation of Breast Region of Interest
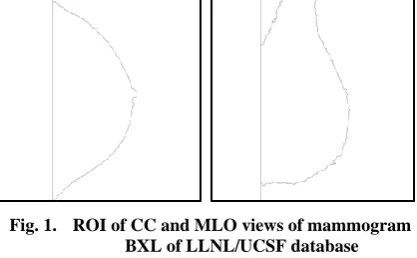
Detection of the Breast Region of Interest (ROI) for MLO and CC views of mammogram is a complicated and multistage process that starts with preprocessing of mammogram images. This is performed in three distinct steps that involve[15]. The preprocessed mammogram images are homogenized and enhanced using our proposed Binary Homogeneity Enhancement Algorithm (BHEA) for digital mammogram [15]. This step is vital for proper segregation of mammogram image. After the mammogram image was enhanced we then use our proposed EDA edge detection algorithm [15] to obtain the edge map that isolates different intensity zones in the image. At this stage the mammogram image contains the breast tissues, pectoral muscle and the zero intensity radio-opaque background. This background region needs to be eliminated along with the high intensity pectoral region which is void of breast tissue. We obtain the breast contour of the mammogram images by using our proposed BBDA algorithm [15] and eliminate the pectoral region by using our proposed PMDA algorithm [15]. After merging the images obtained from Pectoral Muscle Detection Algorithm (PMDA) and Breast Boundary Detection Algorithm (BBDA) we get the ROI of the Breast for mammogram images for both CC and MLO views.
Fig. 1. ROI of CC and MLO views of mammogram BXL of LLNL/UCSF database
3.2
Calculation of ROI Measurement
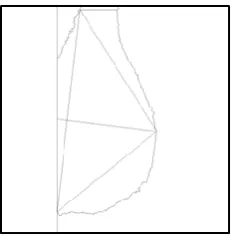
The breast like any other human organ is a complex structure that is difficult to define as a specific geometric form. To calculate the volume we need the three corresponding dimensions from the ROI of the CC and MLO views. The two ROI images obtained from the above methods are two dimensional (2D) images but have two different perspectives. From the ROI image of the MLO view we can obtain the height (hMLO) and the width (wMLO). Similarly, from the CC view of the ROI image we can get the height (hCC) and the width (wCC). The height in the MLO and CC views are of same value, so we can consider either of the ROI image to calculate the height. The width in CC and MLO views are the remaining two dimensions for calculating the volume of breast.Fig. 2. MLO view showing width (wMLO) and height
(hMLO) (BXL of LLNL/UCSF database)
To calculate the height in MLO view hMLO, we consider the longest perpendicular distance from the chest wall to the skin adjacent to the nipple region. We name this point as C. This forms the largest cross sectional distance for the breast region. Now, we need to draw a line that is perpendicular to the line AB connecting C. To do this we first calculate the slope of line AB and then iterate through the points of line AB to the point where the value is the negative inverse of the slope AB and passes through C. We name this point that lies on the line AB as D. The distance of CD is the value of hMLO.
(1)
(2)
(3)
The breast ROI in the CC view appears as a semicircular structure in 2D. The height in the CC view hCC is longest perpendicular distance from the chest wall to skin adjacent to the nipple. The width in CC view is the distance between two lateral extremes. We name the two lateral extreme points as E and F. The distance EF corresponds to the wCC value.
3.3
Proposed Elliptical Paraboloid Model
After merging the two ROI images of the breast in CC and MLO views we get a three dimensional (3D) structure with three distinct values for the three corresponding dimensions. We take the hMLO, wMLO and wCC as the three values for calculating the volume.Fig. 3. 3D structure showing the hMLO, wMLO and wCC
The obtained 3D structure gets divided into two unequal parts by the CD and EF plane due to AD ≠ DB. On the CD and EF plane an ellipse can be drawn that is passing through the points E, C and F.
Fig. 4. 3D structure showing the elliptical base with radii of a and b, with h1≠h2 for AB
The breast being a complex structure is proposed by us as a pair of elliptical paraboloid sharing same elliptical base. We draw two elliptical paraboloid facing each other on the same axis AB with the vertex A and B passing through point C, E and F.
Fig. 5. Proposed pair of elliptical paraboloid structure
The human breast assumes different shape during the different phases in life from puberty to old age. With increasing age the breast sags with respect to the chest wall. So the axis AB of the breast is not parallel to the chest wall but gets tilted on aging. So the geometric representation also gets tilted on the axis AB.
Fig. 6. The proposed model tilted on AB axis
Fig. 7. Plane of elimination
Fig. 8. The final 3D structure for representation of breast
Now we calculate the volume of the half elliptical paraboloid model where AD and DB are h1, h2 and CD and FD are a and b respectively.
3.4
Formulation to Determine the Breast
Volume
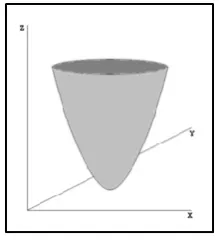
Elliptic Paraboloid is such a structure that from one side, it is an elliptical in shape and from other two sides it has a parabolic in shape but with a different eccentricity. It is elliptic shape when the figure is cut on a horizontal plane or the x-y plane. The figure 9 is showing Elliptical Paraboloid in X, Y and Z plane.
Fig. 9. Elliptical paraboloid in 3D plane
To compute volume of Elliptical Paraboloid we have to use triple integration. This will be extremely complex to calculate. The best way to approach this problem is to slice the figure along the Z axis into differential volumes dz in thickness with the shape of an ellipse.
The equation of Elliptic Paraboloid is
(4)
The Differential Volume (dV) then
(5)
(6)
To put x in terms of z in equation 4, cut the volume with the y = 0 plane. Therefore the equation will be that of a parabola:
(7)
So,
(8)
Same way, to put y in terms of z in equation 4, cut the volume with the x = 0 plane. The equation will be that of a parabola:
(9)
So,
(10)
Then we can rewrite the Differential Volume (dV) equation
(11)
So,
(12)
Here the height of the elliptic paraboloid is known; we can set up the limits and integrate to obtain the volume (V).
(13)
Here, we have two elliptic paraboloids with same elliptical base and height of axis of the same is not equal (h1 ≠ h2), where the height of the axis are h1, h2 and volume are V1, V2 respectively. According to our proposed model, we need the half of the volume of each elliptic paraboloid. We used the equation 13 here.
(14)
(15)
(16)
So, the final equation for our proposed model will be
4.
RESULTS
We have implemented our proposed model to calculate the volume for all set of mammograms in the LLNL/UCSF database. The results of three sets are displayed below that are representative of different shape and size.
4.1
Case 1
The images of BFL of LLNL/UCSF database in CC and MLO views are used to calculate the volume. The original images are condensed by a factor of 4.7715 for CC and by 5.4824 for MLO respectively. So for these two images the digitization is 0.0167 cm and 0.0192 cm respectively. The calculated volume by our proposed algorithm is 975 ml.
Fig. 10. Experimental result on BFL of CC and MLO views
4.2
Case 2
The images of BHL of LLNL/UCSF database in CC and MLO views are used to calculate the volume. The original images are condensed by a factor of 5.25 for CC and by 6.3301 for MLO respectively. So for these two images the digitization is 0.0184 cm and 0.0221 cm respectively. The calculated volume by our proposed algorithm is 773 ml.
Fig. 11. Experimental result on BHL of CC and MLO views
4.3
Case 3
The images of BMR of LLNL/UCSF database in CC and MLO views are used to calculate the volume. The original images are condensed by a factor of 6.0703 for CC and by 5.9473 for MLO respectively. So for these two images the digitization is 0.0212 cm and 0.0208 cm respectively. The calculated volume by our proposed algorithm is 1473 ml.
Fig. 12. Experimental result on BMR of CC and MLO views
5.
DISCUSSION
The simple method used by Katariya et al is the use of a circular cone to represent a breast geometrically. Though the calculation was simple as they used only the CC view but the process lacked other parameters due to their consideration of only one perspective view. The other perspective view i.e. MLO was considered by Fung et al. They considered the breast as an elliptical cone rather than a circular cone structure as perceived by the previous author. Though it was an improvement but their assumption was based on the 2D structure of the views resulting in consideration of a curved structure as a straight line. This according to our assessment was major under segmentation of the breast. Moreover, we observed that the breast in almost all cases can be virtually divided into two heterogeneous half along the plane from nipple region to chest wall in MLO view. This has not been considered by either of the authors in their studies. So a significant volume of breast was not considered mathematically. To take all these into consideration and the different curvatures observed in upper and lower half of breast, we proposed a paraboloid structure; with two half paraboloid sharing the same elliptical base and having different focus for upper and lower half of breast along the virtual plane.
6.
CONCLUSION
Human breast like any other organ of the human body is a complex structure containing different tissues under-laying different organs. The breast also undergoes transformation during the life time of the female depending on the hormonal changes that occur from puberty through lactating mother to post menopause. During this time the shape and structure of the breast changes significantly from a firm structure to a sagging structure. A sagged breast structure has been represented by our paper as a paraboloid structure having two half paraboloid placed on the same elliptical base. We have also deduced a formula for calculating the volume of the breast based on the CC and MLO views of the breast. Both these views provide us a 3D perspective to the breast and help us to reconstruct the breast as a geometric model for calculation of the volume. Our proposed model takes into consideration the curved structure of the breast and the sagging that occurs due to aging, while developing the model. It is our firm belief that our model takes into consideration a greater portion of the breast tissue for calculating the volume of the breast. Accurate breast volume measure by computational method can help in cases of breast diagnostics, cosmetic surgeries and other related areas without the need of complex procedures currently performed.
7.
ACKNOWLEDGEMENTS
We are extremely grateful to Lawrence Livermore National Laboratories (LLNL), along with University of California at San Fransisco (UCSF) Radiology Dept for using their mammographic database for purely academic purpose. We have used the database by downloading it from website.
8.
REFERENCES
[1] Siti Noraini Sulaiman et al, "An Expert Image Processing System on Template Matching", International Journal of Computer Science and Network Security, 2007, Vol. 7, No.7, pp. 234-238
[2] S. Detounis, "Computer-Aided Detection and Second Reading Utility and Implementation in a High-Volume Breast Clinic", Applied Radiology, 2004, Vol. 33, No. 9, pp. 8–15
[3] "Breast Cancer Facts & Figures, 2009-2010", American Cancer Society, Inc.
[4] Katariya RN, Forrest AP, Gravelle IH, "Breast volumes in cancer of the breast", Br J Cancer, 1974, Vol. 29, pp. 270–273
[5] Wynder et al, Cancer, N. Y., 1960, 13, 559
[6] Wynder et al, "In Prognostic Factors in Breast Cancer", Ed. A. P. M. Forrest and P. B. Kunkler, Edinburgh and London: E. & S. Livingstone Ltd, 1968, p. 32
[7] Bouman FG, "Volumetric measurement of the human breast and breast tissue before and during mammoplasty", Br J Plast Surg, 1970, Vol. 23, pp. 263– 264
[8] Ward C et al, "The search for volumetric symmetry in reconstruction of the breast after mastectomy", Br J Plast Surg, 1986, Vol. 39, pp. 379–385
[9] Campaigne BN et al, "Measurement of breast volume in females: description of a reliable method", Ann Hum Biol, 1979, Vol. 6, pp. 363–367
[10]Smith DJ Jr et al "Breast volumeand anthropomorphic measurements: normal values", Plast Reconstr Surg, 1986, Vol. 78, pp. 331–335
[11]Loughry CW et al, "Breast volume measurement of 598 women using biostereometric analysis", Ann Plast Surg, 1989, Vol. 22, pp. 380–385
[12]Stomper PC et al, "Analysis of parenchymal density on mammograms in 1353 women 25– 79 years old", AJR Am J Roentgenol, 1996, Vol. 167, pp. 1261–1265
[13]Keddy RJ et al, "Negative development xeroradiography of the breast: doses and clinical indications", Br J Radiol, 1980, Vol. 53, pp. 325–330
[14]Kalbhen CL et al, "Mammographic determination of breast volume: comparing different methods", AJR Am J Roentgenol, 1999, Vol. 173, pp. 1643–1649
[15]World J Surg et al, "Mammographic Determination of Breast Volume by Elliptical Cone Estimation", World Journal of Surgery, 2010, Vol. 34, No. 7, pp.1442–1445