Volume 1, Issue 8 (October2012) PP: 14-19
A ROBUST PERFORMANCE OF A VOLTAGE SOURCE
CONVERTER BASED HIGH VOLTAGE DIRECT CURRENT
Nadir Ghanemi
1, Djamel Labed
2,
1 ,2Electrical Laboratory of Constantine, Constantine University, Algeria
Abstract:––In this paper, we presented the modelling of VSC (Voltage Source Converter) of a DC link in the field of Park. A control strategy based on the separation of active and reactive power is proposed. Simulation in Matlab / Simulink system proposed under normal operation and faulty operation allows us to evaluate the performance of a VSC HVDC.
Keywords:––VSC, HVDC, decoupled control
I.
INTRODUCTION
The power transmission DC has being historically the first used solution, but the technology of that time did not allow the development of this type of power transmission.
The first power transmission system using HVDC (High Voltage Direct Current) was released in 1954 [1], since then research on power transmission DC has started.
Nowadays, and following the progress of the field of power electronics, converters based on VSC technology are realized with IGBT (Insulated Gate Bipolar Transistor). These showed many advantages [1], [2] as compared to converters used for the traditional HVDC and are realised with thyristors.
In this study, we present a model of the VSC HVDC that will allow us to establish a mathematical model, or a so called control strategy. This model for separating control is used to power the controlled converter VSC. A simulation with Matlab / simulink is performed to highlight the performance of a VSC HVDC.
II.
MODELING
OF
THE
VSC
HVDC
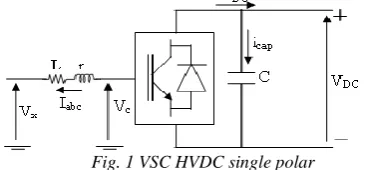
The configuration of a single polar VSC [1] is given by "Fig. 1". Rated AC voltages can be expressed by the following formula:
abc abc xabc
cabc rI
dt di L V
V (1)
Our goal is to establish a mathematical model that will be used for the control law. For this, we choose the study in the area of Park, or we will establish a control system called VSC control by powers decoupled.
Fig. 1 VSC HVDC single polar
To facilitate the calculation, we used the transformation of Clark. This transformation the following result:
dq
abc
The transition from normal reference to real reference Clark is given by "(2)":
c
b
a
.
2
1
2
1
2
1
2
3
2
3
0
2
1
2
1
1
3
2
0
(2)
rI
dt
di
L
V
V
c
x
(3)The relation between the Park reference and the Clark reference is given by:
jwt dq
e
X
X
.
(4)Where
is the angular velocity of Park reference as compared to the real reference.Using the formula "(3)," and "(4)":
jwt dq jwt dq jwt
xdq jwt
cdq
rI
e
dt
e
i
d
L
e
V
e
V
(
.
)
(5)On the other hand, we have:
dt
e
d
I
L
dt
I
d
e
L
dt
e
I
d
L
jwt dq dq jwt jwt
dq
(.
)
.
.
.)
(
.
.
)
.
(
(6)jwt dq dq
jwt jwt dq
e I jwL dt I d e L dt
e I d
L ( . ) . . ( .) . . (7)
If we substitute "(7)," in "(5),", and eliminate the term
e
jwt:dq dq dq
xdq
cdq
jwLI
rI
dt
dI
L
V
V
(8)The equation "(8)," represents the mathematical model of a Single Polar VSC configuration in the Park reference.
III.
CONTROL
OF
THE
VSC
HVDC
If we consider the axis (
d
) of reference (dq
) is in phase with the voltage (A) of the real reference, this meansthat for every moment
Vxd
Vx
[3], [4]. Therefore, the equation "(8)," becomes:
q q q
cq
d d d
xd cd
rI
jwLI
dt
dI
L
V
rI
jwLI
dt
dI
L
V
V
0
(9)
With:
q d I
jI And jIq Id (10)
Applying the Laplace transform on the results "(9)," and "(10),"
d cq q
q xd cd d
wLI V I r SL
wLI V
V I r SL ) (
(11)
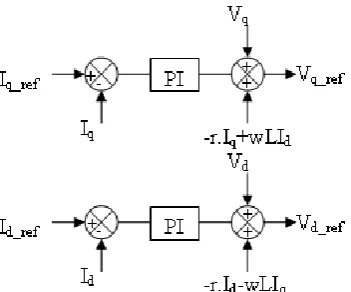
1. Inner current controllers
The principle of inner control is based on current formula "(11)". This type of control allows through a reference
currents (
I
d) and (Iq) of the generated reference voltage (V
d) and (Vq) for generating control pulses for VSC converters.The block diagram of the inner control current is given by "Fig. 2".
2. Outer controllers
The power exchanged with the alternative network through the VSC in the Park reference is given by the formula "(12)," [5]:
Vxd jVxq
Id jIq
S .
2 3
(12)
With
Vxq
0
, the equation "(12)," becomes:q xd d
xdI j V I V
S .
2 3 . 2 3
(13)
Hence the active and reactive powers are:
q xd
d xd
I V Q
I V P
. 2 3
. 2 3
(14)
On the other hand, the variation of the DC voltage can be expressed as follows [3]:
i
dt
C
C
q
V
capcap DC
1
(15)
With (
C
) represent the smoothing capacitor voltage DC side.If we neglect the power losses in converters (rectifier, inverter), and apply the theorem of energy conservation, we can write:
0
2
3
DC DC cap DC d
xd
I
V
i
V
I
V
(16)From "(15)," and "(16)," we have:
xd DC DC d
DC xd DC
V I V I CV
V
dt V d
3 2
2 3
(17)
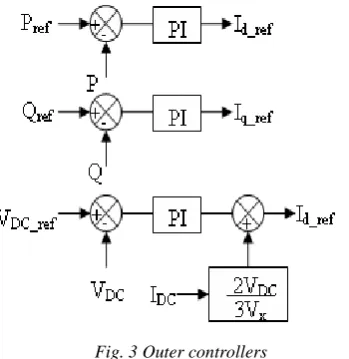
From equation "(14)," controlled VSC in active and reactive powers can be formed separately. For the control voltage and
according to the equation "(17)", the DC voltage is affected by the current (
I
d) and (V
xd).If we consider an AC electrical network low-power
SCR
2
(Short Circuit Ratio) the (V
xd) has a value almost constant,this means that the voltage (
V
DC) is dependant on only the current (I
d).The control structure is given by "Fig. 3"
Fig. 3 Outer controllers
Generally, the converters using a technique VSC are controlled [6] [7] by active and reactive powers for the rectifier mode, reactive power and DC voltage for inverter mode.
Fig. 4 VSC HVDC controllers
The controllers PI (Proportional Integrator) of the control system are calculated using the symmetrical optimum criterion [2], [8], Table (1) gives the different gains of the controllers.
Table I. GAINS OF THE CONTROLLERS
PI Outre controllers Inner controllers
KP KI KP KI
P (station1) 0,17 12 7 85
Q (station1) 0,12 12 3 55
V (station2) 1 26 5 45
Q (station2) 0,3 25 3 35
IV.
SIMULATION
AND
RESULTS
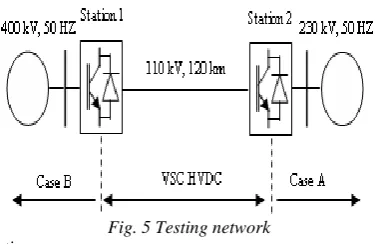
To test the performance of the VSC HVDC transmission under normal operation (change of control settings), and a default operation (single and three phase short circuit) was selected see the network "Fig. 5".
Fig. 5 Testing network
1. Variations in the command instructions
In the first simulation, we will test the response of the VSC-HVDC for changes in control settings.
Initial settings : Pref 0pu, Q1_ref 0 pu, Q2_ref 0pu etVDC_ref 1 pu.
The scenario change is given in Table II.
Table II. VARIATION OF THE SETTINGS
time (s) Pref Q1_ref Q2_ref VDC_ref
0,5 -0,5 0 0 1
1 0 0,1 -0,1 1
1,3 0 0,1 -0,1 1
1,5 0,5 0,15 -0,15 0,9
Figures "Fig. 5," and "Fig. 6," respectively includes the results of stations 1 and 2.
Fig. 5. Change orders (Station 1) Fig. 6. Change orders (Station 2)
The simulation supports that the physical quantity (voltage, power ...) follow the instructions of command, the
physical quantities are stabilized with a delay time
t
0
,
4
s, which is translated into a good operational stability. Changethe setting of active power creates a slight disturbance reactive power e DC voltage in Station 1 and Station 2, but this
disturbance does not affect the system stability.
2. Short circuit
In this section, we conducted a single-phase earth short circuit at time
t
1
s tot
1
,
2
s in station 2, a short threephase circuit and earth at time
t
1
,
8
s tot
2
s in station 2. Control settings for this simulation are: Pref 1pu,1 , 0
_ 1 ref
Q pu Q2_ref 1 pu and VDC_ref 1 pu.
Figures "Fig. 7" and "Fig. 8" illustrates the simulation results.
The simulation shows that for a short circuit (single phase or three phases) in station 2, the tension in the station 1 is infected (see "Fig. 7," and "Fig. 8"). For a single phase short circuit, the active power transited through the line decreases,
0 0.5 1 1.31.5 1.82 2.5 0
0.5 1 1.5
0 0.5 1 1.31.5 1.82 2.5 -1
-0.5 0 0.5 1 1.5
P1 P1ref
0 0.5 1 1.31.5 1.82 2.5 -0.4
-0.2 0 0.2 0.3
0.1
Q1 Q1ref
0 0.5 1 1.31.5 1.82 2.5 -1
-0.5 0 0.5 1 1.5
Id1 Id1ref
0 0.5 1 1.31.5 1.82 2.5 -1
-0.5 0 0.5
Iq1 Iq1ref
t (s)
VDC
(
p
u
)
P1
& P
1
_r
ef
(
p
u
)
Q1
& Q
1
_r
ef
(
p
u
)
Id
& I
d
_r
ef
(
p
u
)
Iq
& I
q
_r
ef
(
p
u
)
t (s)
VDC
(
p
u
)
P2
& P
2
_r
ef
(
p
u
)
Q2
& Q
2
_r
ef
(
p
u
)
Id
& I
d
_r
ef
(
p
u
)
Iq
& I
q
_r
ef
(
p
u
)
0 0.5 1 1.31.5 1.82 2.5 0
0.5 1 1.5
0.9
Vdc2 Vdc2ref
0 0.5 1 1.31.5 1.82 2.5 -1
-0.5 0 0.5 1
0 0.5 1 1.31.5 1.82 2.5 -0.4
-0.2 0 0.2
-0.1
Q2 Q2resf
0 0.5 1 1.31.5 1.82 2.5 -1.5
-1 -0.5 0 0.5 1
Id2 Id2ref
0 0.5 1 1.31.31.5 2 2.5 -1
-0.5 0 0.5 1
Fig. 7. Short circuit (Station 1) Fig. 8.short circuit (Station 2)
while for the second case (short-three phase circuit) power is almost zero. The reactive power consumed by a station swung round to its initial value during the short circuit that is either single or three phases, but this oscillation does not have great influence on the alternative side of Station 1.
V.
CONCLUSION
In this paper, we simulated a VSC HVDC configuration at normal stresses and strains of failing to achieve evaluated the performance of such a configuration. Simulation in Matlab / Simulink has proven that the method used to control VSC converters is reliable in terms of physical quantities has followed their instructions, and that the use of such a system (VSC HVDC) in a network AC increases network reliability for VSC HVDC That a connection does not allow the propagation effects of a short circuit on the AC side of a HVDC terminal to another terminal.
REFERENCES
1. Cuiqing, D. VSC-HVDC for Industrial Power Systems. Ph.D. Division of Electric Power Engineering, Department
of Energy and Environment, Chalmers University of Technology, Goteborg, Sweden 2007.
2. Zhang, L. Modeling and Control of VSC-HVDC Links Connected to Weak AC Systems. Ph.D, Royal Institute of
Technology, School of Electrical Engineering, Electrical Machines and Power Electronics, Stockholm 2010.
3. Temesgen, M.; Molinas, M. Multi-Terminal VSC-HVDC System for Integration of Offshore Wind Farms and
Green Electrification of Platforms in the North Sea. Nordic Workshop on Power and Industrial Electronics, June 2008.
4. Dash, P.K.; Mallick, R.K. Design of Multivariable Controller for an AC_VSC-HVDC, International journal of
electrical and power engineering, Vol 4 (3):1990-7958, 2010.
5. Jovcic, D.; Lamont, L.; Abbott, K. Control System Design for VSC Transmission. Elsevier, 0378-7796,
December 2006.
6. Latorre, H.F.; Ghandhari, M.; Soder, L. Active and Reactive Power Control of a VSC HVDC. Elsevier,
0378-7796, march 2008.
7. Khatir, M.; Zidi, S.; Hadjeri, S.; Fellah, M. Dynamic Performance of A Back–to–Back HVDC Station Based on
Voltage Source Converters, VOL. 61 (1): 1335-3632, 2010.
8. Toledo, P. Modeling and Control of a Line-Commutated HVDC Transmission System Interacting With a VSC
STATCOM, Ph.D, Royal Institute of Technology, Department of Electrical Engineering, Stockholm 2007.
t (s)
VDC
(
p
u
)
P1
(
p
u
)
Q1
(
p
u
)
Vab
c
(
p
u
)
Iabc
(
p
u
)
0 0.5 11.2 1.82 2.5 0
0.2 0.4 0.6 0.8 1 1.2
0 0.5 1 1.2 1.8 2 2.5 -0.5
0 0.5 1 1.5
0 0.5 1 1.2 1.8 2 2.5 -0.5
0 0.1
-0.1
0 0.5 1 1.2 1.8 2 2.5 -1
0 1 1.5
-1.5
Va Vb Vc
0 1 1.2 1.8 2 2.5 -1
0 1 1.5
-1.5
Ia Ib Ic
t (s)
VDC
(
p
u
)
P2
(
p
u
)
Q2
(
p
u
)
Vab
c
(
p
u
)
Iabc
(
p
u
)
0 0.5 1 1.2 1.8 2 2.5 0
0.5 1 1.5
0 0.5 1 1.2 1.8 2 2.5 -1.5
-1 -0.5 0 0.5
0 0.5 1 1.2 1.8 2 2.5 -1.5
-1 -0.5 0 0.5
0 0.5 1 1.2 1.8 2 2.5 -1
0 1 1.5
-1.5
Va Vb Vc
0 0.5 1 1.2 1.8 2 2.5 -5
0 5 2.5
-2.5 Ia