e-ISSN: 2278-7461, p-ISSN: 2319-6491
Volume 5, Issue 5 [May 2015] PP: 39-45
Evaluation of Sandy Land Degradation Based on
Geo-Information Techniques: a case Study South Part
of Iraq
Prof. Dr. Mushtak T. Jabbar
1, Dr. Ammar S. Dawood
21Geology /Earth Sciences/ Highline collage/ Seattle, Washington, 98198 USA 2Department of Civil Engineering, College of Engineering, University of Basrah, Iraq
Abstract:
This research utilizes the integrated using “3S” (RS-remote sensing, GIS-geographic information systems and GPS-global positioning system) technology and field investigation in the southern part of Iraq was taken as a case, to monitor, map, and quantify the land degradation risk detection techniques using a 1:250 000 mapping scale. According to the surface landscape indices, the sandy land was divided into four types, such as shifting sandy land, semi-shifting sandy land, semi-fixed sandy land and fixed sandy land, and the degraded land had been divided into light level degraded, moderate level degraded, severe level degraded and heavily level degraded corresponding. The data of sandy land in these two dates were interpreted and obtained by interpreting the images of TM in 2000 and ETM+ in 2010 with the visually interactive interpretation. The data of dynamic changes of reversing from sandy land and degraded land were obtained by overlaying databases in these two periods. The study results show that (1) there was 1749.7 km2 of newly degraded land occurred, and most of the newly degraded lands are very severe degraded grades; (2) as a result, the degraded increased by 582.1 km2 kept a stable sandy degradation land situation as a whole during the 10-year periods. Some constructive countermeasures, for the ecological protection and the ecological refugee settlement of the southern part of Iraq, are proposed in the paper.Keywords: Geo-information technology, sandy degradation, landscape indices, arid region, Iraq
I.
INTRODUCTION
Sandy land degradation is a kind of desertification characterized by soil erosion, mainly resulted from the excessive human activities in arid, semi-arid regions and it is the main process of land degradation in Iraq (Al-Farrajii, 1998, Dejong, 1994, Jabbar, 2006). Iraq like many other countries in the arid and semi-arid region is exposed to land degradation problems, especially in the Middle and Southern parts of the Iraq, which are estimated to be about one million hectares (Al-Farrajii, 1998, UNEP, 2001). This problem started because of the negligibility of the problem which is now expected to have more than 90% of the cultivable lands (Dougramedji, 1999). Some of the main causes of land degradation in Iraq are the overgrazing, misuse of the plant coverage, and sand dune formation. Land degradation involves multiple causes, and it proceeds at varying rates in different climates (Hassan and Al-Dabbas, 1987). The movable sand dunes have a direct effect on the infrastructure such as highways, railways, irrigation canals, agricultural soils, soil erosion, sand storms, as well as the direct negative effect on the environment and human health (Al Janabi et al., 1988). Land degradation also affects plant growth, especially forages and rangelands that are considered to be one of the most crucial problems facing animal production in Iraq (Naqash and Shaker, 1986; Salman and Saadallah, 1986). The continuous use of unsustainable practices, damage of the infrastructure during the War, and poor maintenance worsened by sanctions, has caused a further soil and plant deterioration. Recent estimates showed that 75% of the total land in Iraq was arid and semi-arid regions and 50% of this land is subject to soil wind erosion particularly in the south western part of the Iraq, where the degradation of land becomes a serious problem (Dougramedji, 1999).
aggregate-level change detection should be comparable to that of the pixel-aggregate-level assessment. Finally, we present the application of this study as a way to alleviate some methodological issues in land change science.
The emphasis of this paper is not the modeling aspects of sandy land degradation, but rather to develop an empirical methodology for change detection of sandy land degradation in the study location. No modeling procedures have been developed to estimate land degradation in the study. We assume a reduction in the productivity of the land to be a universal definition for sandy land degradation, and should be applicable from the global to the local context. Assessment of positive and negative amounts in vegetative cover and proportion of drifting sand area change will yield measurements for differing amounts of sandy land degradation. However, the issue here is what amount of vegetative cover and proportion of drifting sand area change should be considered as significant in terms of land degradation or land greening during the study period, especially since the Earth greened. To account for the full range of vegetative cover and proportion of drifting sand area change, it is necessary to derive a standardized amount of annual vegetation and soil indices change. This is necessary to quantitatively test for normal amounts of vegetative cover and proportion of drifting sand area change in the southern part of Iraq so that we can detect significant amounts of land degradation.
The objective of this study is based on remote sensing data and GIS to monitoring and analyze the dynamic change of land degradation from 2000 to 2010, which including the spatial distribution and quantities of the newly increased degraded land and the rehabilitated degraded land, the grades of degraded land, and to investigate the causes of dynamic change of land degradation, so as to derive the useful references for the restraining land degradation and the further gathering sandy land in the future.
II.
MATERIALS
AND
METHODS
2.1 MATERIALS
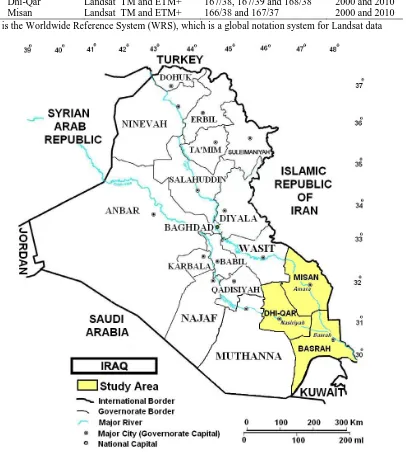
The study area, located in the southern parts of Iraq, lies within longitude 45o 65′ to 48o 65′ E and from latitude 29o 13′ to 32o 84′ N with a total area of 48,855 km2 (Figure I). This area is a typical representation of about 11.23% of the total area of Iraq. To study the land degradation risk detection, the Governorates of Basrah, Dhi-Qar, and Misan were selected as a study area. The Governorates are situated in the southern parts of Iraq. The soil of Iraq is considered as sedimentary soil, especially in the central and southern parts (Buringh, 1960). There are two main features of the study area. Firstly there is a great variation of temperature; in the summer, it is very high and in winter very low .The average of highest (annual) temperature is about 48o C, and the average lowest temperature is about 4o C. Secondly, there is no rainfall for about six months during the summer (May to October) when the land remains absolutely dry. The annual humidity is less than 50% and remains less than 30% during the daytime. The average evaporation exceeds 2450 mm/year with average annual rainfall less than 100 mm. The desert plants are adapted to these variations of meteorological factors, and represent 66% of the total cover; these plants begin to grow immediately after rainfall, and complete their life cycle by the end of the rainy period, and soon after the temperature begin to rise.
The images (Landsat TM 2000) and 8 thematic map (ETM 2010) were acquired in (June to September), 2000 and 2010 (Table I). All the five thematic layers were generated in GIS environment at a scale of 1:250,000. The software’s packages used for this study were (ERDAS ver. 9.2), GIS (ArcGIS ver. 10.1), and SPSS (statistical analysis).
2.2 METHODS
2.2.1 FIELD WORK AND LABORATORY STUDIES:
Before visually interpreting images, the fieldwork was carried out to acquire the total situation of vegetation cover and land use in this area. The soil erosion map and vegetarian type map were collected in this region. The fieldwork, concurrent with the satellite acquisition over the study area, includes sampling soil and measurement of vegetation plots. The sampling spots were chosen to span the range of dominant surface features using 1:250 000 topographical maps and located by GPS. Biomass and coverage percentage of 30 x 30 meter sized plots were measured. The degraded land interpretation indicator system and land degraded grade indices were set up with the assistance of previous research as references (Zhu, 1984) (Table II).
Table I: Remotely sensed data that used in the study
Basrah Landsat TM and ETM+ 165/39, 166/39 and 166/40 2000 and 2010 Dhi-Qar Landsat TM and ETM+ 167/38, 167/39 and 168/38 2000 and 2010
Misan Landsat TM and ETM+ 166/38 and 167/37 2000 and 2010
*a WRS is the Worldwide Reference System (WRS), which is a global notation system for Landsat data
Fig. I: General Location of the study area
Table II: The grade indices of degraded land Degradation class Rate of shifting sand
area (%)
Vegetation cover ration (%)
Feature description of surface landscape
Light < 5 >50 Shifting sand has not yet occurred in the most land, there occur spot shifting sand by chance.
Moderate 5-20 20-50 The combination with patch shifting sand, sandy pile with windy bush and windy erosion.
Degradation class Rate of shifting sand area (%)
Vegetation cover ration (%)
Feature description of surface landscape
Severe 20-50 5-20 Shifting areas distribute in large area, crowded with sandy piles and bushes.
Very severe > 50 < 5 Dense shifting dune takes most part.
Landsat TM/ETM+ satellite images were taken over a span of 10 years (2000–2010) coupled with a field observations served as the basic sources of data. Radiometric corrections and cloud-free had been conducted. The 2010 image was first rectified and geo-referenced to the Albers equal area projection using ground control points from the 1:250 000 topographic map of the study area with the help of Intergraph MGE. The 2000 Scene was co-registered to the 2010 image using not less than 30 ground control points. In all cases, the nearest neighbor re-sampling method was used with a second order polynomial model. The RMSE of rectification was less than 0.5 in this study (Table III). Landsat TM bands 4, 3 and 2 color composites were generated for interpretation (Karnieli, 1997, Zha et al., 2003).
Table III: Geometric correction; the number of ground control points, type of re-sampling method and root mean square (unit pixel) for the corrected sense.
Corrected sense No of
GCP’s
Re-sampled scheme RMSE Geodetic Datum
Map projection
2000 sense to map 50 nearest neighbor 0.5 WGS84 NUTM38
2010 sense to 2000 sense 50 nearest neighbor 0.3 WGS84 NUTM38
2.2.3 Post Processing Of The Images:
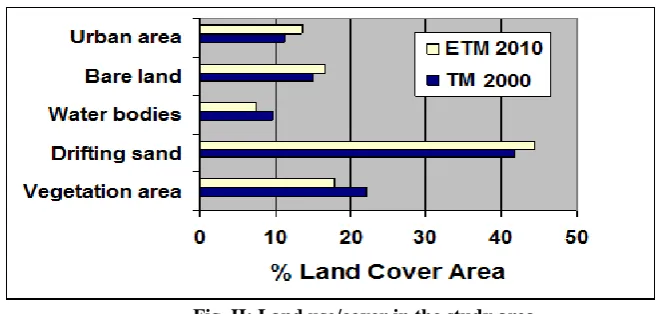
The degraded land interpretation indicator system and land degraded grade indices were set up with the assistance of previous research as references (Zhu, 1984). According to the characteristics of the surface landscape such as the moving dune ratio and the vegetarian cover ratio (Figure II), the sandy land was divided into four types such as shifting, semi-shifting, semi-fixing and fixed sand. Correspondingly, degraded land was classified into four types such as light degraded land, moderate degraded land, severely degraded land and heavily severe degraded land (Table II). Then sandy land databases at two times were derived by visual interactive interpretation TM images of 2000 and ETM+ 2010 using ArcGIS (Karnieli, 1997). The comparison of sandy land databases elaborated on different dates is a straightforward way to assess land degradation. Dynamic databases of the reversed land from sand and degraded land were obtained by overlaying databases of sandy land in two periods. Comparing the dynamic databases with sand data in 2000, the land degradation and the rehabilitated sand data were obtained. At the same time, the dynamic databases were overlaid with land use /land cover in the same period, which formerly were digitalized with the same scale. The transition matrix between no degradation land and the degraded land was generated. In order to obtain every Governorate the degradation data, the administrative division coverage was overlaid with the dynamic change map of land degraded.
Fig. II: Land use/cover in the study area.
III.
RESULTS
AND
DISCUSSION
3.1 The Sandy Degradation Land Situation Of This Area In 10-Years
GPS being an efficient GIS data collection technology, allowed users to compile their own data sets directly from the field as part of 'ground truthing' (Al-saadi, 2002). Ground-truth surveys were an essential component for the determination of accuracy assessment for sand drifting, vegetation change, and classified satellite imagery.
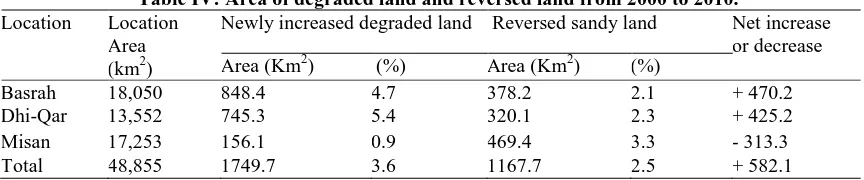
The area of reversion sandy land in this area was 1167.7 Km2, which mainly distributing in Misan Governorate with 3.3% among reversion areas. The areas in Basrah and Dhi-Qar were the smallest with the reversion areas of 2.1% and 2.3% respectively. In the same period, the newly increased degraded land was 1749.7Km2, 4.7% of which distribute in Basrah Governorate and 5.4% in Dhi-Qar Governorate. The small degradation areas were in Misan Governorate with the rate of 0.9%. As a result, the degraded land increased by 582.1 Km2 kept a stable sandy degradation situation as a whole during the 10-year periods.
Table IV: Area of degraded land and reversed land from 2000 to 2010.
Location Location Area (km2)
Newly increased degraded land Reversed sandy land Net increase or decrease
Area (Km2) (%) Area (Km2) (%)
Basrah 18,050 848.4 4.7 378.2 2.1 + 470.2
Dhi-Qar 13,552 745.3 5.4 320.1 2.3 + 425.2
Misan 17,253 156.1 0.9 469.4 3.3 - 313.3
Total 48,855 1749.7 3.6 1167.7 2.5 + 582.1
3.2 Degradation Land Types
Dune reactive or encroach land occupied about 810.1 km2 , the grassland degradation land occupied about 468.9 km2, farmland degradation land occupied about 341.2 km2, accounting for 46.3%, 26.8% and 19.5% of the total newly sandy degradation land area respectively, accounting for 1.6%, 0.9% and 0.7% of the total study area respectively (Table V). The dune reactive or encroach and grassland degradation were the main sandy degradation types, because the southern part of Iraq is surrounded by big desert in the northwest and natural environment is atrocious, irrational human activities will aggravate the process of grassland vegetation degradation and thereby lead to the occurrence of moving sand or the formation of sand dunes.
The very severely sandy degradation lands were almost the dune reactive or encroach and grassland degradation land. The new cultivation converted from salinized land and sand land at the margins of the southern part of Iraq was another type facing the very severely sandy degradation.
Table V: The different of newly increased sandy degradation area type
Degradation type Area (Km2) Area percentage (%)
Grassland degradation 468.9 26.8
Farmland degradation 341.2 19.5%
Dune reactive or encroach 810.1 46.3%
Sandy degradation land 1749.7 100%
3.3 Evaluation Of Degradation Land Areas
The grades of land degraded (Table VI) showed that the total newly sandy degradation land area was about 1749.7 km2; the very severely sandy degradation land occupied the largest percentage, about 976.3 km2 in area, accounting for 55.8% of the total sandy degradation land area and 2.1% of the total study area; the area of severely sandy degradation land was about 412.9 km2, ranking the second place and accounting for 23.6% of the total sandy degradation land area and 0.9% of the total study area; the moderately sandy degradation land was 216.9 km2 in area, accounting for 12.4% of the sandy degradation land and 0.5% of the total study area, the slightly sandy degradation land was 143.5 km2 in area, accounting for 8.2% of the sandy degradation land area and 0.3% of the total study area. In Basrah and Dhi-Qar Governorates, the very severe degraded land took most part with respective areas of 62.8% and 64.5% for very severely degradation. The other Governorate took the area of 39.9% of the very severe degraded land. Of the severely degraded land, 23.6% of which distributed 16.7% in Basrah, 15.9% in Dhi-Qar and 38.2% in Misan Governorate. The areas of moderately degraded land in the study area were the large with the areas of 216.9 Km2. The smallest area was in Slight grade with the area of 143.5 Km2 which distributed 150.5 Km2 in Basrah, 117.2 Km2 in Dhi-Qar and 162.7 Km2 in Misan Governorate. These data showed that quarter of the study area faced the danger of sandy degradation which is different to restore and control.
Table VI: The area of degradation grades from 2000 to 2010.
Location Degradation class*a
Area (km2)
Proportion (%)
Area
(km2) (%) Area
(km2) (%)
Area
(km2) (%)
Basrah 150.5 8.6 208.2 11.9 292.2 16.7 1098.8 62.8
Dhi-Qar 117.2 6.7 225.7 12.9 278.2 15.9 1128.5 64.5
Misan 162.7 9.3 220.5 12.6 668.3 38.2 698.1 39.9
Total 143.5 8.2 *b 216.9 12.4 412.9 23.6 976.3 55.8
*a indices were set up with the assistance of previous research as (Zhu, 1984) *b (Slight) total area (km2) / Total newly increased degraded areas (km2) × 100
3.4 Assessment of Surface Landscape Indices
By further analysis of table VII, the shifting sand land mainly transferred into fixed and semi-shifting ones with the respective areas of 549.3 km2 and 1033.8 km2, which respectively occupies 31.4% and 59.1% of the newly sandy degradation land. The area of reversed fixed sandy land was 165.1 km2, which takes only 9.4% of total areas. In space distribution, the reversed sandy land was mainly in the Basrah and Dhi-Qar Governorates, accounting 9.9% and 7.1% among the areas of sandy land reversion and with 18.1% in Misan Governorate. Without a doubt, the results suggest, that the gravity of vegetation cover change and drifting sand development as problems in the south part of Iraq. The results of this study indicated that land degradation resulted from natural and anthropogenic factors. The overlay of land degradation severity layers, interpreted from multi-temporal remotely sensed materials in a GIS, in conjunction with field investigation, revealed that the spatial extent of degraded land in the area has drastically expanded during the ten-year study period (2000-2010).
Table VII: The area of surface landscape type from 2000 to 2010.
Location Semi-shifting sandy land
Semi-fixed sandy land
Fixed sandy land
Total
Basrah 517.5 246.1 84.8 848.4
Dhi-Qar 469.5 223.6 52.2 745.3
Misan 46.8 79.6 28.1 156.1
Total 1033.8 549.3 165.1 1749.7
IV.
POSSIBLE
SOLUTIONS
FOR
SANDY
DEGRADATION
CONTROL
We believe that the main cause of sandy degradation is natural and anthropogenic factors on land. Therefore, degradation control should not only concentrate on enhancing the carrying capacity of lands but also on decreasing anthropogenic activities. The following possible solutions for sandy degradation control were proposed.
First, vegetation plays a very important role in degradation. Make an effort to convert degraded farmland into grassland, to popularize sandy-land a forestation techniques, and to establish protective forests to form a preliminary sand-control system. Second, efforts should be made to change current farming structures, to popularize grain-grass intercropping, to develop a three-crop planting rotation for grain, forage, and other cash crops to enhance soil fertility, and to form a stable eco-agricultural system. Third, promoting the development of regional economies and improving farm incomes could help resolve some sandy degradation problems. The technical innovation including water-saving techniques should be encouraged. Besides what was mentioned above, ecological immigration policy can also be considered by local government.
V.
CONCLUSION
REFERENCES
[1] Al-Farrajii, F.A.H. Combating desertification in Iraq. Desertification Control Bulletin , 1998. No. 33 pp. 2-10.
[2] Al Janabi, K.Z. Ali, A.J., Al-Taie, A. and Jack, T.J. Origin and nature of sand dunes in the alluvial plains of southern Iraq. J. Arid Environ, 1988. 14: 27-34.
[3] Al-saadi, K.M. Use of remote sensing data for detection the desertification in dry climate areas. First Iraqi scientific symposium in meteorology and seismic (Dryness in Iraq). Baghdad, 1988. 26-27/Feb./2002.
[4] Buringh, P. Soil and soil conditions in Iraq. Ministry of Agriculture, Directorate General of Agricultural Research and projects, Baghdad, Iraq. 1960.
[5] Dejong S. M.. Derivation of vegetative variables from a Landsat TM image for modeling soil-erosion. Earth Surface Processes and Landforms, 1994. Vol. 19, Iss .2, pp. 165-178.
[6] Dougramedji, J.S. Aeolian sediment movements in the lower alluvial plain, Iraq. Desertification Control Bulletin, 1999. No.35 pp. 45-49.
[7] Hassan, H.A. and M. Al-Dabbas. Environmental Function for Determination of Sand Origin, J.A.W.R.R., 1987. vol. 6, No. l pp. 55-74.
[8] Jabbar M T. Land degradation assessment with the aid of geo-information techniques. Earth Surface Processes and Landforms ,2006. 31: 777–784.
[9] Karnieli, A. Development and implementation of spectral crust index over dune sands. International Journal of Remote Sensing, 1997. 18: 1207--1220.
[10] Naqash, A.B. and Shaker, S.N. Aeolian sedimentation processes in lower Mesopotamian Plain; J. Water Res. 1986. 5 (1): 486-508. [11] Salman, H.H. and A.S. Saadallah. Dust fallout in central and southern Iraq. J. Water. Res. 1986. 5 (1): 599-620.
[12] UNEP. The Mesopotamian marshlands: the demise of an ecosystem. Early Warning and Technical Assessment Report, UNEP/DEWA/TR.01–3. http://www.grid.unep.ch/activities/sustainable/tigris/mesopotamia.pdf (accessed May 2003).
[13] Zha, Y., Gao, J., & Ni, S. Use of normalized difference built-up index in automatically mapping urban areas from TM imagery. International Journal of Remote Sensing, 2003. 24(3), 583−594.