Volume No.02, Special Issue No. 01, September 2014 ISSN (online): 2348 – 7550
82 |
P a g e
A COMPARATIVE STUDY OF ECONOMIC LOAD
DISPATCH BY USING GA AND PSO
Pooja Singh
Head, Department of Electrical Engineering, J.I.T. Nashik (India)
ABSTRACT
The economic load dispatch plays an important role in the operation of power system. The main objective of this
paper is to determine the optimal combination of power outputs of all generating units so as to meet the
required demand at minimum cost while satisfying all types of constraints. In this paper the lambda iteration
method and the two main types evolutionary optimization technique genetic algorithm and particle swarm
optimization which are generic population based probabilistic search optimization algorithms and can be
applied to real world problem are respectively applied to solve an ELD problem and at last the comparison
between all three method has been presented. The PSO provides the generation level such that the generation
level is coming out to be lower than the cost resulted with genetic algorithm method.
Keywords: - Economic Load Dispatch, Genetic Algorithm, Particle Swarm Optimization
Algorithm, Swarm Intelligence.
I. INTRODUCTION
The Economic load dispatch problem is one of the fundamental issues in power system operation. The economic
load dispatch can be defined as the process of allocating generation levels to the generating units, so that the
system load is supplied entirely and most economically. For an interconnected system it is necessary to
minimize the expenses.Conventionally the cost function for each unit in ELD problem has been approximately
represented by a quadratic function and is solved using mathematical programming techniques. Generally for
obtaining the global optimum solution these mathematical methods are required some marginal cost
information. Unfortunately, the real world input output characteristics of generating units are highly non-linear
and non-smooth because of the different types of constraints like valve point effect, prohibited operating zones
and multi fuel effects etc. Thus practical ELD problem is considered as a non-smooth optimization problem with
equality and inequality constraints, which directly cannot be solved by the mathematical methods. Because these
methods are highly sensitive to starting points and often converge to local optima.The ELD problem involves
the solution of two different problems. The first of these is the unit commitment or pre dispatch problem
wherein if is required to select optimally out of the available generating sources to operate meet the expected
load and provide a specified margin of operating reserve over a specified period of time. The second aspect of
Economic Dispatch is the online economic dispatch wherein it is required to distribute the load among the
generating unit actually paralleled with the system in such manner as to minimize the total cost of supplying to
minute requirements of the system. The main objective is to reduce the cost of energy production taking into
83 |
P a g e
generators are assumed to be monotonically increasing piece-wise linear functions, such an approach will not be
workable for non-linear functions in practical systems. In past decade, conventional optimization techniques
such as lambda iteration method, linear & quadratic programming, have been successfully used to solve power
system optimization problem such as unit-commitment and economic load dispatch. for highly non-linear and
combinatorial optimization problems, the conventional methods are facing difficulties to locate the global
optimal solution. Recently there is an upsurge in the use of modern evolutionary computing techniques in the
field of power system optimization. PSO first introduced by Kennedy and Eberhart, is one of the modern
heuristic algorithm. It was developed through simulation of a simplified social system and has been found to be
robust in solving continuous non linear optimization problems. The PSO technique can generate high quality
solutions with in shorter calculation time and stable convergence characteristics.
II. ECONOMIC LOAD DISPATCH
The objective function & subjected constraints can be defined as:
2.1
The Problem Formulation: Objective Function-
The objective of economic load dispatch for power system consisting of thermal generating units is to find the
optimal combination of power generations that minimises the total generation cost while satisfying the specified
equality & inequality constraints. The fuel cost function of generator is represented as a quadratic function of
generator active powers.
Objective function=
𝑚𝑖𝑛
𝑛𝑖=1𝐹𝑖(𝑝𝑔𝑖)
2
( g i) i g i i g i i
F P a P b P c
Where the Fi(Pgi) is the operation fuel cost of generator i andai,bi,ci are the cost coefficients for i
th unit.
2.2 Constraints
The problem is subjected to power balance constraints and generating capacity constraints as follows
2.2.1 Power Balance Constraints-Equality Constraints
1
N G
g i D
i
P P
+
P
L2.2.2
.Inequality Constraints
m in m a x
g i g i g i
Volume No.02, Special Issue No. 01, September 2014 ISSN (online): 2348 – 7550
84 |
P a g e
Where PD is the load demand. Pg i is output power of ith generator , PL is the transmission loss.
m in
g i
P And
m a x
g i
P are the maximum & minimum output powers of the ith generator respectively.
III. APPLIED METHODS
3.1 Lambda Iteration Method
In this method λ is a variable, introduced in solving constraint optimization problem and is already known as
Lagrange Multiplier. It is significant to that Lambda can be solved at hand by solving systems of equations.
Since all the inequality constraints to be satisfied in each trial the equations are solved by the iterative method.
Assume a suitable value of λ(0).
The value of lambda should be more than the largest intercept of the incremental cost characteristic of the
various generators.
Compute the individual generations.
Check the equality constraint,
1
n g
g i d L
i
h P P P
is satisfied. If not satisfied, make the second guess λ repeat above steps.
3.2 Genetic Algorithm
A global optimization technique known as Genetic algorithm has emerged as a candidate due to its flexibility
and efficiency for many optimization applications. It is a stochastic searching algorithm. The method was
developed by John Holland in 1975.GA is inspired by the evolutionary theory which is explaining by the origin
of species. Normally in our nature weak and unfit species within their environment are faced with extinction
with natural selections. The strong one has greater opportunity to pass their genes to the future generation via
reproduction process. In the long run the species those are carrying the correct combination in their genes
become dominant in their population. Some times during the slow process of evolution, random changes may
occur in genes. If these additional advantages in the challenge for survival, new species evolve from the old
ones, unsuccessful changes are eliminated by natural selection. The GA is a search heuristic technique that
mimics the process of natural evolution. The heuristics technique is routinely used to generate useful solutions
to optimization and search problems. GA belong to the larger class of evolutionary algorithm, which generate
solutions to the optimization problems using natural evolution such as mutation, selection, crossover and
inheritance. GA offer a new and powerful approach to the optimization problems make possible by the
increasing availability of high performance of computers at relatively low cost. These algorithms have recently
found extensive applications in solving global optimization searching problems when the closed form
85 |
P a g e
because, it simultaneously, evaluates many points in the parameter space. It does not need to assume that the
search pace is differentiable or continuous.
3.2.1 Algorithm of Economic Load Dispatch using GA-
1. Read data, such as cost coefficientsai,bi,ci number of iterations, length of strings population size, probability
of mutation and crossover, power demand Pm inand Pm a x.
2. Create the initial population randomly in the binary form.
3. Now decode the string, or obtain the decimal integer from the binary string.
4. Calculate the power which generated from the decoded population by using equation.
m a x m in
m in ( )
2 1
j
j i i i
i i l
P P y P P
i = 1,2...NG
j = 1,2...NG
L= Number of string or population
size.
5. Check Pij ,
If Pij>Pmax, then set Pij=Pimax
If Pij<Pmax then set Pij=Pimin
6. Find the fitness or cost function from second equation.
7. Find the population with maximum fitness and average fitness of the population.
8. Perform the reproduction process, which includes these steps
Set selection rate and number of mating in a pool.
Define total fitness as the sum of values obtained by using above steps for all chromosomes which are selected.
Select percentage of each chromosome which is equal to the ratio of its fitness value to the total fitness value i.e.
find probability, which can be written as
Probability=fitness/∑Fitness‟s.
Calculate cumulative sum (CS) to normalize the values between 0.0 to 1.0.
9. Perform crossover operation:
Choose a pair of random numbers between 0 and 1to select one mother and one father chromosome, so as to
produce new offspring.
Pairing the chromosome from different location, for different location the crossover point has to be selected
Volume No.02, Special Issue No. 01, September 2014 ISSN (online): 2348 – 7550
86 |
P a g e
10. Perform mutation by randomly selecting the mutation point from the total no. Of bits in the population matrix.
11. Update the population.
12. If the no. Of iteration reaches the maximum then go to step (13) otherwise will go to step (6).
13. The fitness that generates the minimum total generation cost is the solution of the problem.
3.3 Particle Swarm Optimization
Kennedy and Eberhart developed a particle swarm optimization behavior (PSO) algorithm based on the
behavior of individual (i.e. particles or agents) of the swarm. Its roots are in zoologist modeling of the
movement of individuals (i.e. fishes, birds, and insects) with in a group. It has been noticed that members of the
group seem to share information among them, a fact that leads to increase the efficiency of the group. PSO as an
optimization tool provides a population based search procedure in which individuals called particles change
their position (states) with time. In a PSO system particles flying around the multi dimensional space. In particle
swarm optimization, each individual makes its decision based on its own experience together with other
individual‟s experience. Particle swarm optimization (PSO) is a population based stochastic optimization
technique which is inspired by a social psychological metaphor instead of the survival of fittest individual.
During the flight period each particle adjusts its position according to its own experience and the experience of
neighboring particles and making use of best position taken by it and neighbors. The swarm direction of a
particle can be defined by the set of particles neighboring the particles and its history experience. In PSO we are
not using evolutionary operation to manipulate the individuals, in the PSO each individual flies in the search
space with a velocity which is dynamically adjusted according to its own flying experience and its companions
flying experience also.
3.3.1 Algorithm Of Economic Load Dispatch By Using PSO
The algorithm for economic load dispatch by using particle swarm optimization is given as follows.
1. Initialize the individuals of the population according to the limit of each unit including the individual
dimension, searching point, and velocities. This initial solution must be feasible candidate solution that
satisfies the practical operation constraints.
2. To Each chromosome of the population the dependent unit output PD will be calculated from the power
balance equation and Bm n coefficient matrix.
3. Calculate the evaluation value of each individual Pg i, in the population using the evaluation function f
given by
1
( ) ( )
n g
i i i
M in im iz e F C i f P
4. Compare each individual‟s evaluation value with itsPb e s t. The best evaluation value among Pb e s t is
denoted asGb e s t.
87 |
P a g e
( 1 ) ( ) 1 ( ) ( ( ( ) ) 2 ( )
( ( ) )
i d i i d
i d i d
v t w v t C R a n d P b e s t P g t C R a n d g b e s t P g t
Where i=1,2….n and d=1,2….m
6. Check the velocity component constraint occurring in the limits from the following conditions.
If vij(r1 ) vjm a x then vij(r1 ) vjm a x
If vij(r1 ) vjm in then vij(r1 ) vjm a x
Where, vjmax = -0.5Pjmin
Where, Vjmax = +0.5Pjmax
7. Modify the member position of each individualPg .
( 1) ( ) ( 1)
g id g id id
P t P t v t
Pg i d(t1 )Must be modified toward the near margin of the feasible solution.
8. If the evaluation value of each individual is better than previous Pb e s t , the current value is set to be Pb e s t.
If the best Pb e s t is better than the Gb e s t , the value is set to beGb e s t .
9. If the number of iterations reaches the maximum, then go to step 2.
10. The individual that generates the latest Gb e s t is the optimal generation power of each unit with the
minimum total generator cost.
VI. COMPLETE WORK AND CALCULATIONS.
In this paper the result of economic load dispatch after the implementation of proposed method lambda-iteration
method, genetic algorithm (GA) and particle swarm optimization (PSO) are discussed. The programs are
implemented in MATLAB 7.6.0. The performance is evaluated with considering the total transmission losses
using two generating test system i.e. three generator system, and six generator system whose input and output
data are given below.
Case Study1
:
Solving Three Generator System By Using Lambda Iteration Method
The coefficients of fuel cost and maximum and minimum power limits are given below. the power demand is
considered to be 850(MW). The results corresponding to Lambda iteration GA and PSO are detailed in section.
The cost characteristic of the three units are given as
Volume No.02, Special Issue No. 01, September 2014 ISSN (online): 2348 – 7550
88 |
P a g e
F2 = .0042P22 + 8.93P2 + 600 Rs/hr
F3 = .0045P32 + 6.78P3 + 650 Rs/hr
The unit operating constraints are
100𝑀𝑊 ≤ 𝑃1 ≤ 600𝑀𝑊
60𝑀𝑊 ≤ 𝑃2 ≤ 300𝑀𝑊
300𝑀𝑊 ≤ 𝑃3 ≤ 650𝑀𝑊
For the above system considering the load of 550mw, 850mw, 900mw conventional lambda iteration method is
applied to obtain the economic load dispatch. The table 1 shows that the economic load dispatch of above
mentioned loads neglecting the transmission line losses.
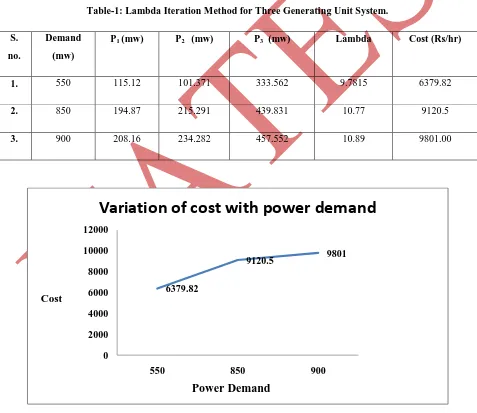
Table-1: Lambda Iteration Method for Three Generating Unit System.
S. no.
Demand (mw)
P1 (mw) P2 (mw) P3 (mw) Lambda Cost (Rs/hr)
1. 550 115.12 101.371 333.562 9.7815 6379.82
2. 850 194.87 215.291 439.831 10.77 9120.5
3. 900 208.16 234.282 457.552 10.89 9801.00
Fig .1: Variation of Cost with Power Demand for Three Unit System
Case Study2
-
Solving Three Generator Systems By Using Genetic Algorithm Method
The coefficients of fuel cost and minimum and maximum limits are given in table2.
6379.82
9120.5 9801
0 2000 4000 6000 8000 10000 12000
550 850 900
Variation of cost with power demand
Cost
89 |
P a g e
Table:2- Specification For GA Of Three Generating SystemUnit no. ai bi ci Pmin Pmax
1. .0001562 7.92 561 150 600
2. .000194 7.85 310 100 400
3. .00482 7.97 78 50 200
Optimal solution using genetic algorithm for case study (2) –
Table: 3- Optimal Result of GA
S.no. Demand
(MW)
P1 (MW) P2 (MW) P3 (MW) Total cost
(Rs/hr)
1. 550 190.57 60.62 300.77 6299.00
2. 820 211.30 88.82 519.88 9000.60
3. 850 395.5 325.7 128.8 8719.55
4. 1500 560 290 650 17178.00
Fig.2: Cost Variation of Three Unit System By GA.
Case Study (3): Solving Three Generator Systems By Using PSO Method
Table:4- Specification For PSO Of Three Generating System 6299
9000.6 8719.55
17178
0 2000 4000 6000 8000 10000 12000 14000 16000 18000 20000
550 820 850 1500
Cost
Volume No.02, Special Issue No. 01, September 2014 ISSN (online): 2348 – 7550
90 |
P a g e
Unit no. ai bi ci Pmin Pmax
1. .0001562 7.92 561 150 600
2. .000194 7.85 310 100 400
3. .00482 7.97 78 50 200
Optimal solution using PSO for case study (3)-
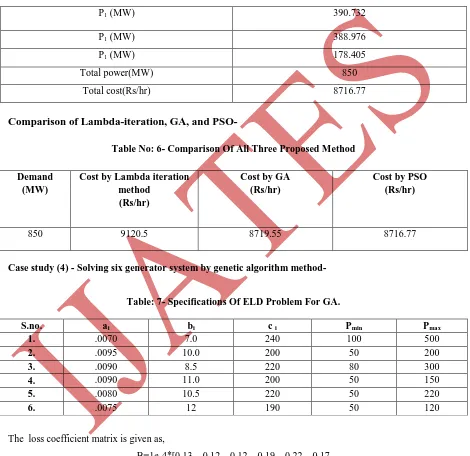
Table: 5- Results Of PSO For Three Generating Unit System.
P1 (MW) 390.732
P1 (MW) 388.976
P1 (MW) 178.405
Total power(MW) 850
Total cost(Rs/hr) 8716.77
Comparison of Lambda-iteration, GA, and PSO-
Table No: 6- Comparison Of All Three Proposed Method
Demand (MW)
Cost by Lambda iteration method
(Rs/hr)
Cost by GA (Rs/hr)
Cost by PSO (Rs/hr)
850 9120.5 8719.55 8716.77
Case study (4) - Solving six generator system by genetic algorithm method-
Table: 7- Specifications Of ELD Problem For GA.
S.no. ai bi c i Pmin Pmax
1. .0070 7.0 240 100 500
2. .0095 10.0 200 50 200
3. .0090 8.5 220 80 300
4. .0090 11.0 200 50 150
5. .0080 10.5 220 50 220
6. .0075 12 190 50 120
The loss coefficient matrix is given as,
B=1e-4*[0.13 0.12 0.12 0.19 0.22 0.17
0.16 0.7 0.12 0.15 0.14 0.4
0.16 0.12 0.66 0.18 0.25 0.18
0.18 0.15 0.16 0.70 0.2 0.23
91 |
P a g e
0.23 0.1 0.18 0.24 0.34 0.82];
Optimal Solution By Using Genetic Algorithm For Case Study (4)-
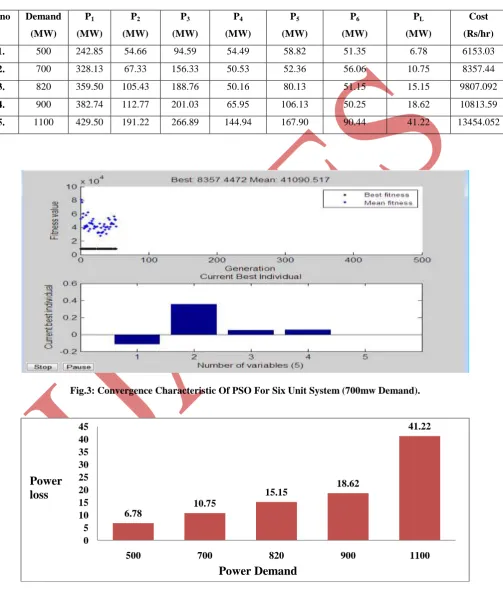
Table: 8- The Result Of GA For Case Study-4.
S.no Demand (MW)
P1 (MW)
P2 (MW)
P3 (MW)
P4 (MW)
P5 (MW)
P6 (MW)
PL (MW)
Cost (Rs/hr)
1. 500 242.85 54.66 94.59 54.49 58.82 51.35 6.78 6153.03
2. 700 328.13 67.33 156.33 50.53 52.36 56.06 10.75 8357.44
3. 820 359.50 105.43 188.76 50.16 80.13 51.15 15.15 9807.092
4. 900 382.74 112.77 201.03 65.95 106.13 50.25 18.62 10813.59
5. 1100 429.50 191.22 266.89 144.94 167.90 90.44 41.22 13454.052
Fig.3: Convergence Characteristic Of PSO For Six Unit System (700mw Demand).
Fig .4: Variation Of Power Loss With The Load Demand For Six Unit System In GA.
Solving Six Generator System By Particle Swarm Optimization Method
6.78
10.75
15.15 18.62
41.22
0 5 10 15 20 25 30 35 40 45
500 700 820 900 1100
Power
loss
Volume No.02, Special Issue No. 01, September 2014 ISSN (online): 2348 – 7550
92 |
P a g e
The coefficient of fuel cost and minimum / maximum power limits are given in table 7, a number of power
demands are considered here.
Optimal Solution By Using Particle Swarm Optimization For Case Study (4)
The initial particles are randomly generated within the feasible range. The parameters c1 and c2 and inertia
weight are selected for best convergence characteristic. Here c1=1.99 and c2=1.99 are used, and the maximum
value of w is chosen to be 0.9 and minimum value is 0.4. The velocity limits are selected as Vmax=0.5*Pmax and
minimum value is selected as Vmin = -0.5*Pmax. There are 10 number of particle are selected in the population.
For different values of c1 and c2 the cost curves convergences in different region. So the best value is taken for
the minimum cost of the problem. If we increase the number of particles then cost curve converges faster. From
this solution analysis, it can be observed the loss has no effect on the cost characteristic, it has been observed
even if number of units is increased the convergence is less affected.
Table: 9- Output Result Of PSO For Case Study-4
S.No Demand (MW)
P1 (MW)
P2 (MW)
P3 (MW)
P4 (MW)
P5 (MW)
P6 (MW)
PL(Losses) (MW)
Cost (Rs/hr)
1. 500 221.16 50 84.4 50 50 50 5.5842 6132.2
2. 700 322.81 77.01 158.56 50 52.34 50 10.74 8352.61
3. 820 361.42 103.35 185.74 52.31 82.29 50 15.13 9805.86
4. 900 383.04 118.76 201.21 67.42 98.04 50 18.50 10812.2
5. 1100 436.52 115.43 239.16 103.72 137.63 56.09 28.58 13452.42
6. 1300 482.67 187.68 271.81 135.90 171.39 91.76 41.26 16256.68
93 |
P a g e
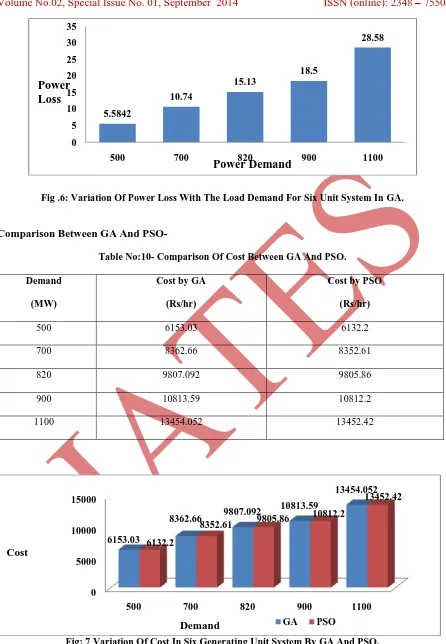
Fig .6: Variation Of Power Loss With The Load Demand For Six Unit System In GA.Comparison Between GA And PSO-
Table No:10- Comparison Of Cost Between GA And PSO.
Demand
(MW)
Cost by GA
(Rs/hr)
Cost by PSO
(Rs/hr)
500 6153.03 6132.2
700 8362.66 8352.61
820 9807.092 9805.86
900 10813.59 10812.2
1100 13454.052 13452.42
Fig: 7 Variation Of Cost In Six Generating Unit System By GA And PSO.
Comparison Of Losses From GA And PSO-
5.5842
10.74
15.13
18.5
28.58
0 5 10 15 20 25 30 35
500 700 820 900 1100
Power
Loss
Power Demand
0 5000 10000 15000
500 700 820 900 1100
6153.03
8362.66 9807.092
10813.59
13454.052
6132.2
8352.61 9805.86
10812.2
13452.42
GA PSO
Cost
Volume No.02, Special Issue No. 01, September 2014 ISSN (online): 2348 – 7550
94 |
P a g e
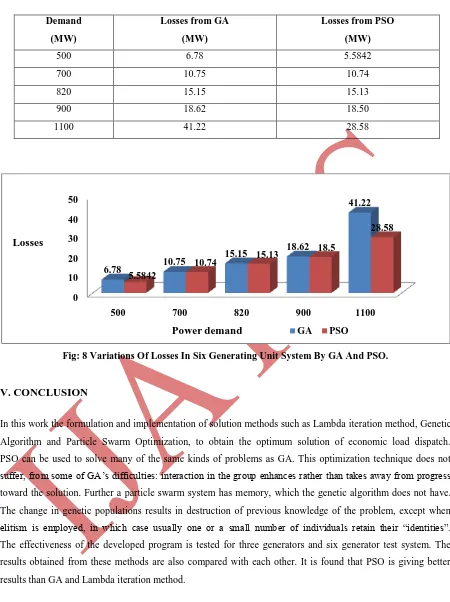
Table No: 11 Comparisons Of Losses Between GA And PSO.Demand (MW)
Losses from GA (MW)
Losses from PSO (MW)
500 6.78 5.5842
700 10.75 10.74
820 15.15 15.13
900 18.62 18.50
1100 41.22 28.58
Fig: 8 Variations Of Losses In Six Generating Unit System By GA And PSO.
V. CONCLUSION
In this work the formulation and implementation of solution methods such as Lambda iteration method, Genetic
Algorithm and Particle Swarm Optimization, to obtain the optimum solution of economic load dispatch.
PSO can be used to solve many of the same kinds of problems as GA. This optimization technique does not
suffer, from some of GA‟s difficulties: interaction in the group enhances rather than takes away from progress
toward the solution. Further a particle swarm system has memory, which the genetic algorithm does not have.
The change in genetic populations results in destruction of previous knowledge of the problem, except when
elitism is employed, in which case usually one or a small number of individuals retain their “identities”.
The effectiveness of the developed program is tested for three generators and six generator test system. The
results obtained from these methods are also compared with each other. It is found that PSO is giving better
results than GA and Lambda iteration method.
REFERENCES
[1] A.Y. SABER, T. SENJYU, T. MIYAGI, N. URASAKI AND T. FUNABASHI, FUZZY UNIT COMMITMENT SCHEDULING USING ABSOLUTELY STOCHASTIC SIMULATED ANNEALING, IEEE TRANS. POWER SYST, 21
(MAY2006), PP.955–964)
[2] A.J.WOOD AND B.F.WOLLENBERG,POWER GENERATION,OPERATION, AND CONTROL,JOHN WILEY AND
SONS.,NEW YORK (1984).
0 10 20 30 40 50
500 700 820 900 1100
6.78 10.75
15.15 18.62
41.22
5.5842
10.74 15.13
18.5
28.58
GA PSO
Losses
95 |
P a g e
[3] IEEECOMMITTEE REPORT,PRESENT PRACTICES IN THE ECONOMIC OPERATION OF POWER SYSTEMS,IEEE TRANS.POWER APPA.SYST.,PAS-90(1971)1768–1775.
[4] N. SINHA, R. CHAKRABARTI AND P.K. CHATTOPADHYAY, EVOLUTIONARY PROGRAMMING TECHNIQUES FOR ECONOMIC LOAD DISPATCH, IEEE EVOL. COMPUT.,7(FEBRUARY (1))(2003), PP.83–94. [5] H.T.YANG,P.C.YANG AND C.L. HUANG,EVOLUTIONARY PROGRAMMING BASED ECONOMIC DISPATCH
FOR UNITS WITH NONSMOOTH FUEL COST FUNCTIONS,IEEE TRANS. POWER SYST., 11(FEBRUARY 1996), PP. 112–118.
[6] P.ATTAVIRIYANUPAP,H.KITA,E.TANAKA AND J.HASEGAWA,A HYBRID EP AND SQP FOR DYNAMIC ECONOMIC DISPATCH WITH NONSMOOTH FUEL COST FUNCTION,IEEE TRANS. POWER SYST., 17(MAY (2))
(2002), PP.411–416
[7] ZWE-LEE.GAING,PARTICLE SWARM OPTIMIZATION TO SOLVING THE ECONOMIC DISPATCH CONSIDERING THE GENERATOR CONSTRAINTS, IEEE TRANS. POWER SYST. 18 (3)(2003), PP. 1187–1195 CLOSURE TO DISCUSSION OF „PARTICLE SWARM OPTIMIZATION TO SOLVING THE ECONOMIC DISPATCH CONSIDERING THE GENERATOR CONSTRAINTS‟,IEEETRANS.POWER SYST.,19(NOVEMBER (4))(2004)2122–2123.
[8] D.N. JEYAKUMAR, T. JAYABARATHI AND T. RAGHUNATHAN, PARTICLE SWARM OPTIMIZATION FOR VARIOUS TYPES OF ECONOMIC DISPATCH PROBLEMS,ELECT.POWER ENERGY SYST,.28(2006), PP.36–42.
[9] T.O.TING,M.V.C. RAO AND C.K. LOO,A NOVEL APPROACH FOR UNIT COMMITMENT PROBLEM VIA AN
EFFECTIVE HYBRID PARTICLE SWARM OPTIMIZATION,IEEE TRANS. POWER SYST,. 21(FEBRUARY (1))(2006),
PP.411–418.
[10] A.I. SELVAKUMAR AND K. THANUSHKODI, A NEW PARTICLE SWARM OPTIMIZATION SOLUTION TO NONCONVEX ECONOMIC DISPATCH PROBLEMS,IEEE TRANS. POWER SYST,. 22(FEBRUARY (1))(2007), PP. 42–51
[11] J.-B. PARK, K.-S. LEE, J.-R. SHIN AND K.Y. LEE, A PARTICLE SWARM OPTIMIZATION FOR ECONOMIC
DISPATCH WITH NONSMOOTH COST FUNCTIONS,IEEE TRANS. POWER SYST,. 20(FEBRUARY (1))(2005), PP. 34–42.
[12] J. KENNEDY AND R.C. EBERHART, PARTICLE SWARM OPTIMIZATION, PROCEEDINGS OF THE IEEE, INTERNATIONAL CONFERENCE ON NEURAL NETWORKS PERTH,AUSTRALIA (1995), PP.1942–1948.
[13] Y.SHI AND R.C.EBERHART,PARAMETER SELECTION IN PARTICLE SWARM OPTIMIZATION,PROCEEDINGS OF
THE SEVENTH ANNUAL CONFERENCE ON EVOLUTIONARY PROGRAMMING,IEEEPRESS (1998).
[14] J.KENNEDY AND R.C. EBERHART,A DISCRETE BINARY VERSION OF THE PARTICLE SWARM ALGORITHM,
PROC. IEEE CONF. SYST. MAN CYBERNE, (1997), PP.4104–4109. .
[15] Y.SHI AND R.C.EBERHART,FUZZY ADAPTIVE PARTICLE SWARM OPTIMIZATION,IEEE INT. CONF. EVOL. COMPUT. (2001), PP.101–106..