Published online February 20, 2013 (http://www.sciencepublishinggroup.com/j/ijema) doi: 10.11648/j. ijema.20130101.12
Development and calibration of a particulate matter
measurement device with wireless sensor network
function
Duckshin Park*, Soon-Bark Kwon, Youngmin Cho
Eco-Transport Research Division, Korea Railroad Research Institute, Uiwang-si, Gyeonggi-do, Korea
Email address:
dspark @krri.re.kr (D. Park)To cite this article:
Duckshin Park, Soon-Bark Kwon, Youngmin Cho. Development and Calibration of a Particulate Matter Measurement Device with Wireless Sensor Network Function, International Journal of Environmental Monitoring and Analysis. Vol. 1, No. 1, 2013, pp. 15-20. doi: 10.11648/j.ijema.20130101.12
Abstract:
A Zigbee-based ubiquitous sensor network (USN) has many industrial applications and provides flexible measuring environments. In particular, the USN system can replace existing measuring devices in harsh environments such as subway stations. To monitor the intensities of various pollutants and air qualities in subway tunnels, this study applied the USN technique. A novel wireless sensor module, PMX, was designed and manufactured to simultaneously detect PM10and PM2.5. Measurements were conducted at a subway station in Seoul. The PM concentrations using PMX were measured,
analyzed, and compared with those obtained using an established commercial dust spectrometer (Grimm Aerosol Technik, 1.109). The measurements were performed from 24 March 2010 to 9 April 2010. PMX and the dust spectrometer measured PM10 levels of 98.3 and 40.7 ㎍/㎥, respectively, and PM2.5 concentrations of 86.5 and 16.6 ㎍/㎥, respectively. The
monitored PM levels were investigated in a bimodal form during the sampling period. The PM10 and PM2.5 average
correlations between PMX and the dust spectrometer were r2=0.81 and r2= 0.97, respectively. The two systems showed a similar time series trend, even though the measured values differed. A simple correlation analysis of the two data groups showed coefficients of determination of 0.7 for PM10 and 0.9 for PM2.5. The PMX data were mostly concentrated around
the trend curve. Therefore, calibration of PMX data was required prior to use in the field. For the calibration, simple linear regression and nonlinear regression were used. The resulting correlation coefficients of simple linear regressions were 0.8 for PM10 and 0.9 for PM2.5, whereas those for nonlinear regressions were 0.7 for PM10 and 0.9 for PM2.5. The higher
correlation coefficient for PM10 by the nonlinear regression indicates that it is the better method for calibrating the system
developed in this study.
Keywords:
Particulate Matter, Ubiquitous Sensor Network, Subway, Indoor Air Quality1. Introduction
Previous studies have reported the negative effects of fine dust on human health. For example, daily death rates were found to increase by 0.5~1.5% when the fine dust concentration in the atmosphere increased (Pope, 1995), and incidences of disease also increased as the fine dust concentration increased (Dockery et al., 1993).
Measurement of fine dust both indoors and outdoors can be performed by a mass concentration method using a filter, a beta ray absorption method using beta rays, and a light scattering method based on the light scattering of dust. Although the mass concentration method is ideal for studies
requiring chemical composition, it has a low time-series resolution and requires an extended period of time for data collection. Furthermore, it can both under-measure (due to volatile substances such as ammonium nitrate and organic carbon) and over-measure (due to gas condensation) the dust mass (Chow, 1998).
The light scattering method, which determines the concentration of fine dust based on the size, shape, and refractive index, has high measurement error in terms of dust concentration and size because of humidity. However, it is still used in various studies because it enables continuous measurement and is simple to conduct (Coffey, 2010).
16 Duckshin Park et al.: Development and calibration of a particulate matter measurement device with wireless sensor network function
attempting to reduce the fine dust concentration in subway stations. The most common way to reduce fine dust is to dilute inside air through ventilation using continuously running large-capacity ventilation fans. The portion of HVAC operating costs within total operating costs is not precisely known, but it is estimated that fan operation accounts for most of the cost. Because HVAC systems dedicated to fine dust concentration are not commonly used, it would be very useful to develop an accurate and low-cost fine dust measurement system.
In this study, we
developed a
dust measurement system that can monitor fine dust in subway stations or large indoor areas at a lower cost than existing equipment. The novel product features real-time fine dust monitoring and wireless sensor network functions. For evaluation, the developed system and an existing commercial product were installed in the same place, and the developed system was calibrated using various statistical analyses. This study provides the reference data required for calibration when a new fine dust measurement system is developed to replace existing commercial products.2. Materials and Methods
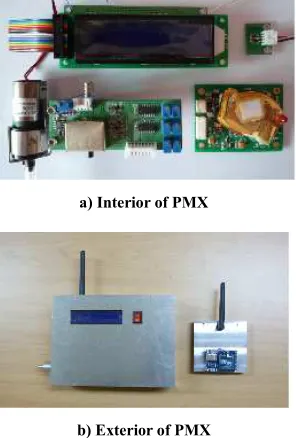
The fine dust measurement system (PMX) developed in this study features a radio frequency (RF) amplifier mounted onto a Zigbee, and uses the wireless sensor network to transfer data up to 1 km wirelessly in clear space. The fine dust measurement range of PMX is 0~10,000 ㎍/㎥(grain density = 1.0 basis), the flow rate is 2 l/min, and the system has an eight-channel (0.3, 0.5, 1.0, 1.5, 2.5, 5, 7, 10 µm) size range. In addition to fine dust, the PMX can include built-in CO, CO2, temperature, and
humidity sensors to simultaneously measure different indoor air qualities.
a) Interior of PMX
b) Exterior of PMX
Fig. 1. View of the wireless PMX sampler.
The PMX was installed in the entrance to a tunnel located about 200 m from Gireum Station toward the Miasamgeori Station of Seoul Metropolitan Subway Line No. 4. Fine dust was measured for about 1 month beginning on 25 March 2010. For comparison with PMX, a dust spectrometer (Grimm Aerosol Technik, Germany), which uses the light scattering method was used. Both systems measured the fine dust concentration every minute for 24 hours a day.
Fig. 2. Particulate matter sampling site and sampling station in the subway tunnel.
Measurement values differed between the dust spectrometer and PMX. To minimize these differences, PMX measurements were calibrated using statistical methods. For the calibration, a simple linear regression analysis and a non-linear regression analysis were used.
A regression analysis is a statistical analysis technique which identifies the correlation among variables by first assuming a mathematical model and then estimating the model from the measured data. Generally, this estimation model is used to predict or statistically deduce values. As an indication of the suitability of the estimated regression curve, the coefficient of determination was used. The coefficient of determination ranges from 0≤ R2 ≤1; the regression curve is more significant as R2 becomes closer to 1 (Seber, 1997).
measurements using the correlation from a simple linear regression analysis. Equation 1 shows the equati
simple linear regression:
In Equation 1, is a vector of predictors of sample from the observed system n;
simple linear regression variables calculated with the regression analysis; and is the ith value of the observed system n restructured by Equation 1 (Fox
study, the fine dust concentration was set to calibration and after calibration.
If there was no linear correlation between th values using PMX and the dust
correlation was calculated using nonlinear regression by Equation 2, and used to calibrate the measured PMX values.
,
in Equation 2 is a vector of calculated nonlinear regression variables; is a vector of the
concentrations confirmed using the observed system is a vector of fine dust concentrations restructured by Equation 2. Finally, is the random error
3. Results and Discussion
To calibrate PMX, the dust spectrometer ( were confirmed using numerous stability tests)
The sampling interval of the two systems was adjusted to 1 minute, and thus 1,440 data points were sampled in a 24 hour period. Table 1 summarizes the 10
the measured values of the two systems. As shown in 1, the concentration differences between PMX and the dust spectrometer averaged 58 ㎍/㎥ for PM
for PM2.5.
Table 1. Summary of the average mass concentration
Min Percentile
25 50 75
PMX PM10 32.9 73.2 108.4 124.8
PM2.5 30.5 64.6 94.7 109.3
Dust spectrometer
PM10 12.7 31.5 41.6 48.9
PM2.5 4.7 12.8 18.2 20.6
Figure 3 shows the daily PM10 and PM
changes in the two systems, which show The concentration gradually decreased AM (which is when subway operation rapidly increased beginning at 5:00 AM operation begins). This shape is similar
Imre (2007) for a subway platform in Austria using tapered element oscillating microbalance
USA). Thus, this bimodal shape would likely be found in all environments which operate on a fixed
measurements using the correlation from a simple linear regression analysis. Equation 1 shows the equation of the
(1)
is a vector of predictors of the ith
is a vector of the simple linear regression variables calculated with the
value of the observed Fox, 2002). In this was set to before
n between the measured ust spectrometer, the nonlinear regression, given and used to calibrate the measured PMX
, (2)
in Equation 2 is a vector of calculated nonlinear is a vector of the fine dust
observed system; and is a vector of fine dust concentrations restructured by
is the random error (Fox, 2002).
pectrometer (whose data confirmed using numerous stability tests) was used. ystems was adjusted to 1 were sampled in a 24-hour period. Table 1 summarizes the 10-minute averages of the measured values of the two systems. As shown in Table the concentration differences between PMX and the dust PM10 and 70 ㎍/㎥
average mass concentration (㎍/㎥).
Max Avg SD
124.8 165.5 98.3 35.9
109.3 144.2 86.5 30.8
48.9 80.2 40.7 13.1
20.6 27.3 16.6 5.7
and PM2.5 concentration
two systems, which show bimodal shapes. decreased beginning at 1:00 subway operations close) and then beginning at 5:00 AM (when subway . This shape is similar to the results of a subway platform in Austria using a icrobalance (Model 1400a, would likely be found in fixed schedule, such as
subways.
a) PM
b) PM
Fig. 3. Daily concentration variations of a) PM by PMX and the dust spectrometer.
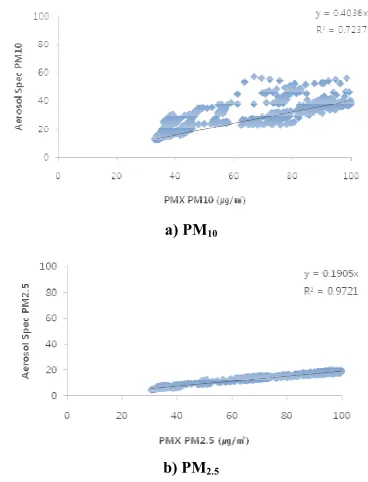
Figure 4 is a schematization
analysis result. The coefficient of determination w
PM10 and 0.9 for PM2.5. These correlation results are similar
to but slightly lower than those reported by (2009). However, as shown in Figure 4, the data concentrated near the linear trend curve, indicating that the measurement results of PM10
a) PM
b) PM
Fig. 4. Correlation coefficients of a) PM the dust spectrometer.
a) PM10
b) PM2.5
Daily concentration variations of a) PM10 and b) PM2.5 measured
Figure 4 is a schematization of the simple correlation analysis result. The coefficient of determination was 0.7 for ese correlation results are similar to but slightly lower than those reported by Kim et al. (2009). However, as shown in Figure 4, the data were concentrated near the linear trend curve, indicating that the
and PM2.5 were reliable.
a) PM10
b) PM2.5
18 Duckshin Park et al.: Development and calibration of a particulate matter measurement device with wireless sensor network function
3.1. Simple Linear Regression Analysis
Calibration is required to use PMX as a commercial product. For statistical analysis, popular regression methods were used. A regression analysis is a statistical analysis technique used to identify correlation among variables by first assuming a mathematical model and then estimating the model from the measured data (Seber, 1997; Ahn et al., 2004). The simple linear regression model used for data calibration is shown in Equation 3 for PM10 and Equation 4
for PM2.5.
PM10,
0.4036 ! (3)
PM2.5,
0.1905 ! (4)
Table 2 summarizes the data calibrated using the simple linear regression analysis. The calibration result shows that the average PMX values were 39.7 ㎍/㎥ for PM10 and
16.5 ㎍/㎥ PM2.5. These values were similar to those of the
dust spectrometer, which were 40.7 ㎍/㎥ for PM10 and
16.6 ㎍/㎥ for PM2.5. Figure 5 shows the time-series
analysis after calibration. In the figure, both a) PM10 and b)
PM2.5 have similar time-series graphs. The correlation
coefficients from the simple linear regression were 0.7 for PM10 and 0.9 for PM2.5. As mentioned above, there was no
difference in the correlation coefficients obtained by simple linear regression.
Table 2. Summary of average PM concentration using PMX and the dust spectrometer after simple linear regression (㎍/㎥).
Min
Percentile
Max Avg SD
25 50 75
PMX
PM10 13.3 29.5 43.7 50.4 66.8 39.7 14.5
PM2.5 5.8 12.3 18.0 20.8 27.4 16.5 5.9
Dust spectrometer
PM10 12.7 31.5 41.6 48.9 80.2 40.7 13.1
PM2.5 4.7 12.8 18.2 20.6 27.3 16.6 5.7
Fig. 5. Daily concentration variations of a) PM10 and b) PM2.5 using PMX
and the dust spectrometer after simple linear regression.
Kwon et al. (2009) reported coefficients of determination of 0.81~0.90 in a study using three different CO2
measurement systems with a wireless sensor network. Our coefficients of determination showed trends similar to theirs, although the values were slightly different.
a) PM10
b) PM2.5
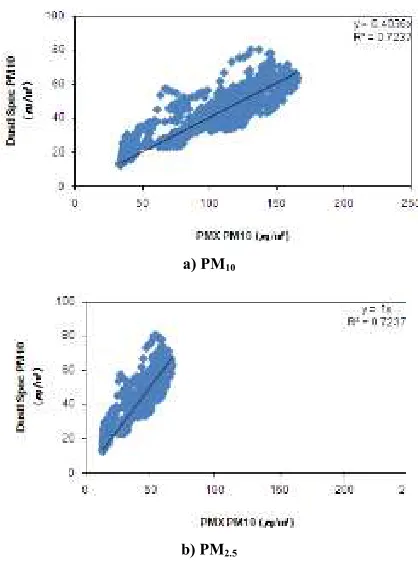
Fig. 6. Correlation coefficients of a) PM10 and b) PM2.5 using PMX and
the dust spectrometer after simple linear regression.
3.2. Nonlinear Regression Analysis
Although PMX was calibrated using simple linear regression analysis, the correlation coefficients were somewhat low at 0.7 for PM10 and 0.9 for PM2.5. Therefore,
a nonlinear regression method was performed on the models in Equations 5 and 6 to improve the reliability of PMX.
PM10
PM2.5,
0.2237 ! %.+,,- (6)
Table 3 summarizes the PMX data calibrated with nonlinear regression. The PMX averages were 40.2 ㎍/㎥ for PM10 and 16.6 ㎍/㎥ for PM2.5. The PM averages by
nonlinear regression of PMX were close to the values measured by the dust spectrometer of 40.7 ㎍/㎥ for PM10
and 16.6 ㎍/㎥ for PM2.5. The standard deviation of the
linear regression analysis was even more similar to the measured values using the dust spectrometer.
Table 3. Summary of average PM concentration using PMX and the dust spectrometer after nonlinear regression (㎍/㎥).
Min Percentile Max Avg SD
25 50 75
PMX PM10 18.5 33.0 43.9 48.6 50.9 40.2 11.3
PM2.5 6.1 12.5 18.1 20.8 27.2 16.6 5.7 Dust
spectrometer
PM10 12.7 31.5 41.6 48.9 80.2 40.7 13.1 PM2.5 4.7 12.8 18.2 20.6 27.3 16.6 5.7
Fig. 7. Daily concentration variations of a) PM10 and b) PM2.5 using PMX
and the dust spectrometer after nonlinear regression.
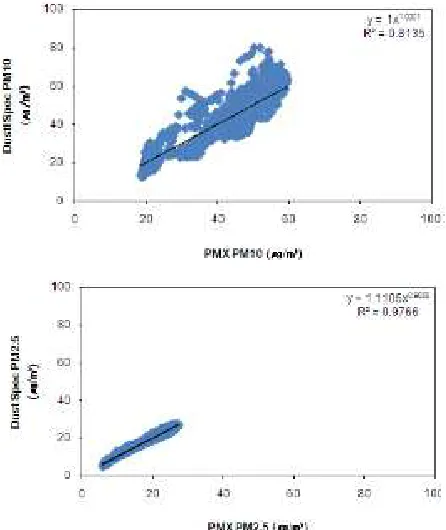
The non-linear regression analysis obtained correlation coefficients of 0.8 for PM10 and 0.9 for PM2.5. The
correlation coefficient of the nonlinear regression was higher for PM10 than for the linear regression, while the two
methods were similar for PM2.5. Kim et al. (2009) also
found higher correlation coefficients by nonlinear than by linear regression in their study using the light scattering and beta ray absorption methods for PM10.
Fig. 8. Correlation coefficients of a) PM10 and b) PM2.5 using PMX and a
dust spectrometer after nonlinear regression.
4. Conclusions
Korea’s Ministry of the Environment regulates subway operations and has prepared a long-term plan and invested a huge budget into reducing fine dust concentrations in subway stations. However, these efforts have not yet produced results. Ventilation is the most common way to reduce fine dust concentrations, but the cost of fan operation places a heavy burden on operating costs. Since HVAC systems dedicated to fine dust concentrations are not yet common, it would be very useful to develop an accurate and low-cost fine dust measurement system. In this study, PMX was developed as a fine dust measurement system. To test the reliability of PMX, the system was installed at the same location as a dust spectrometer (which has been evaluated in several previous studies) at Gireum Station in the Seoul Metropolitan Subway on Line No. 4.
The two systems showed a similar time-series trend, although the measured values were somewhat different. A simple correlation analysis of the two data groups showed coefficients of determination of 0.7 for PM10 and 0.9 for
PM2.5. For the PMX data, most data were concentrated
around the trend curve. Therefore, calibration of PMX data was required prior to application in the field. For the calibration, simple linear regression and nonlinear regression were applied. The correlation coefficients of simple linear regression were 0.8 for PM10 and 0.9 for
PM2.5, while those for nonlinear regression were 0.7 for
PM10 and 0.9 for PM2.5. For PM10, the nonlinear regression
20 Duckshin Park et al.: Development and calibration of a particulate matter measurement device with wireless sensor network function
PMX can monitor the air quality in real time in large spaces, such as a subway station, at a lower cost than existing commercial products. It can increase the efficiency of the subway ventilation system and reduce power consumption by analyzing the air quality status in real-time and interfacing with the ventilations system. However, the developed system requires calibration before it can be applied in the field, as shown in this study. Therefore, further studies are required to observe the air quality sensors and ensure high reliability and durability.
References
[1] Ahn, Y.J., Kwon, W.T., Kim, Y.W., 2004. Estimation of tool life by simple & multiple linear regression analysis of Si3N4 ceramic cutting tools, Transaction of the Korean Society of Machine Tool Engineers, 13(4), 23-29.
[2] Chow, J.C., Watson, J.G., 1998. Guideline on speciated particulate monitoring, Office of Air Quality Planning and Standards U.S. EPA, NC 27711.
[3] Coffey, C.C., Pearce, T.A., 2010. Direct-reading methods for workplace air monitoring, J. of Chemical Health & Safety, 17(3), 10-21.
[4] Dockery, D.W., Pope, C.A., Xu, X.P., Spengler, J.D., Ware, J.H., Fay, M.E., Ferris, B., Speizer, F.E., 1993. An
association between air-pollution and mortality in 6 United States cities, New England J. of Medicine, 329, 1753-1759.
[5] Fox, J., 2002. Nonlinear regression and nonlinear least squares, Appendix to an R and S-PLUS companion to applied regression.
[6] Imre S., Weidinger, T., Maenhaut W., 2007. Time-resolved mass concentration, composition and sources of aerosol particles in a metropolitan underground railway station, Atmospheric Environment, 41(37), 8391-8405.
[7] Jung, C.H., Cho, Y.S., Hwang, S.M., Jung, Y.G., Ryu, J.C., Shin, D.S., 2007. Analysis of measurement error for PM10 mass concentration by inter-comparison study, J. KOSAE, 23(6), 689-698.
[8] Kim, S.J., Son, Y.S., Kang, H.S., Kim, J.C., Lee, J.H., Kim, G.S., Kim, I.W., 2009 Proceeding of the 49th Meeting of KOSAE, 613-615.
[9] Kwon, J.W., Kim, J.C., Kim, G.S., 2009. Air quality monitoring system using NDIR-CO2 sensor for underground space based in wireless sensor network, J. of the IEEK, 46(4), 23-38.
[10] Pope, C.A., Bates, D.V., Raizenne, M.E., 1995. Health effects of particulate air pollution: time for reassessment, Environmental Health Perspectives, 103, 472-480.