Optimization Of Multiple Performance
Characteristics In Electro Discharge Machining
Using Grey Relational Analysis
Subhakanta Nayak, B.C.Routara
Abstract: This paper discusses the application of the Taguchi method to optimize the machining parameters for machining of tungsten carbide in electro-discharge machining (EDM) for individual responses such as material removal rate, electrode wear rate and surface roughness. Moreover, a multi-response performance characteristic was used for optimization of process parameters with application of grey relational analysis. The machining parameters are selected as current, pulse-on-time and pulse-off-time where as the response variables selected as material removal rate (MRR), electrode wear rate (EWR) and surface roughness (Ra). The results from confirmation runs indicated that the determined optimal combination of machining parameters improved the performance of the machining process.
Key words:ANOVA , EDM, EWR ,Grey Relational analysis, MRR ,Optimization, Surface Roughness, Taguchi Method ,
————————————————————
1. INTRODUCTION
Electrical Discharge Machining (EDM) is a non-traditional manufacturing process based on removing material from a part by means of a series of repeated electrical discharges (created by electric pulse generators at short intervals) between a tool, called electrode, and the part being machined in the presence of a dielectric fluid. Electrical Discharge Machining (EDM) is a process that is used to remove metal through the action of an electric discharge of short duration and high current density between the tool and the work piece. It has been proven to be especially valuable in the machining of super-tough, electrically conductive materials such as the new space-age alloys. These metals would have been difficult to machine by conventional methods, but EDM has made it relatively simple to machine intricate shapes that would be impossible to produce with conventional cutting tools. This machining process is continually finding further applications in metal machining industry. In EDM, a potential difference is applied between the tool and work-piece. Both the tool and the work material are to be conductors of electricity. The tool and the work material are immersed in a dielectric medium. Generally kerosene or de-ionized water is used as the dielectric medium. A gap is maintained between the tool and the work-piece. Depending upon the applied potential difference and the gap between the tool and work-piece, an electric field would be established.
2. LITERATURE REVIEW
This review outlines some of the recent reports published in literature on machining of different materials in EDM to find out the effect of the input parameters taken, on the responses. Literature depicts that C.H. Che Haron et al. (8) has taken copper electrodes of different diameters and done machining in EDM of AISI 1045 tool steel at two current settings and concluded that the material removal rate and the electrode wear rate were not only dependent on the diameter of the electrode but also had close relation with the supply of current. Low current was found suitable for small diameter electrode, high current for big diameter electrode. M. Kiyak (9) has examined the machining parameters on surface roughness in EDM of tool steel and has concluded that surface roughness increases with increase of pulse current and pulse time and increases material removal rate. I. Puertas et al. (1) has concluded the same result in machining WC-Co in EDM. Lau et al. (10) carried out an experiment work to investigate the feasibility of EDM as a means of machining carbon fiber composite materials. The machining was conducted at various currents, pulse durations and with different tool materials and polarities. It was clearly concluded that there exits an optimum material removal rate with peak current and pulse on time. It was again proved that copper electrodes perform better than graphite electrodes in terms of tool wear and surface finish. S.H. Lee (6) studied the influence of operating parameters of EDM of tungsten carbide on the machining characteristics. The effectiveness of the EDM process with WC is evaluated in terms of material removal rate, electrode wear ratio and surface finish. They found that material removal rate and surface finish of the work piece are directly proportional to the discharge current intensity. Soni and Chakraverti [4, 12] studied the surface quality, material removal rate, wear ratio, and dimensional accuracy in EDM of alloy steels. Singh et al. investigated the effect of machining parameters on electrode wear in die-sinking EDM of En-31 tool steel with different electrode materials [5]. Also, Luis et al. have carried out a study on electrode wear in EDM of silicon carbide using the technique of design of experiments In 1989, Narumiya et al. began to notice and examined the effects of silicon powder in the working fluid on EDM. They found that foreign particles were capable of reducing the recast layer, preventing cracks, and producing a mirror like surface finish in the EDMed _______________________
Subhakanta Nayak, B.C.Routara
College Of Engineering, Mechanical Engineering, Bhubaneswar
components. In 1993, Yan et al. continued to investigate the effects of dielectrics with suspended aluminum, alumina, and silicon carbide powders, respectively on EDM. They observed the same results as those produced by silicon powders. Tsai and Wang developed a semi empirical model in which parameters affecting the surface roughness were identified to be spark time, maximum current, polarity, input power, material density, conductivity of the material, specific heat capacity, heat conductivity, melting point, and boiling point of the material. Tai et al.[13] suggested surface cracking can be reduced by increasing the pulse current or shortening the pulse-on duration. Furthermore, it is shown that steels with a lower carbon equivalent index or a higher thermal conductivity are more resistant to crack formation. Bhattacharya et al.[14] set the parameter for rough and finished machining operations in EDM for EN31and exhibited maximum MRR as compared to the other two materials such as H11 and HCHCr at similar process settings. Copper (Cu) electrode with aluminum suspended in the dielectric maximized the MRR. The grey system theory initiated by Deng in 1982 has been proven to be useful for dealing with poor, incomplete, and uncertain information. The grey relational analysis based on the grey system theory can be used to solve the complicated interrelationships among the multiple performance characteristics effectively. Through the grey relational analysis, a grey relational grade is obtained to evaluate the multiple performance characteristics. As a result, optimization of the complicated multiple performance characteristics can be converted into optimization of a single grey relational grade. In Grey relational analysis, the complex multiple response optimizations can be simplified into the optimization of a single response Grey relational grade. In the present study, the process parameters of EDM, viz., current (A), pulse-on-time (µs) and pulse-off-time (µs) are optimized for individual responses. Grey relational analysis is done to have optimum cutting parameter combination that yields desirable machining characteristics. Confirmation experiments are conducted to verify the optimal cutting parameter combination as predicted by grey relational analysis. ANOVA is also carried out to observe the level of significance of factors and their interactions on the overall grey relational grade. Results indicate that this approach is both efficient and effective in determining the optimal cutting parameters on MRR, EWR and surface roughness.
3. EXPERIMENTAL DETAILS
3.1 Experimental set up
During this study, a series of experiments on EDM of tungsten carbide of size 20mm x 20mm x 5mm was conducted on a ECOWIN MIC-432C electrical discharge machine to examine the effects of input machining parameters such as pulse on time, pulse off time and current, on the material removal rate and electrode wear rate and surface roughness. The electrode taken was 99.9% copper rod of diameter 8 mm. Separate copper electrode was taken for each experiment. Paraffin was used as dielectric fluid in this experimentation. The machining tests were carried out with a total time of 10 minutes for each experiment. The pressure and temperature of the dielectric fluid was assumed to be constant throughout the experiment. Material is removed during machining from both the work piece and the tool by the erosive action of electrical discharges. The material removed from the work
piece and the tool then determined from their respective weight differences before and after undergoing EDM process. This is then divided by respective densities in order to convert it into volumetric term and further divided by the actual time of machining to obtain the material removal rate and electrode wear rate. The surface roughness is measured by stylus type profilometer (Taylor’s Hobson Surtronic +25).
3.2 Tool material & Work-piece material used
The electrode material used during this study was electrolytic copper rod of diameter 8mm having 99.9% copper as shown in Fig.1. The work-piece material is tungsten carbide as shown in Fig.2.
Fig.1 Electrodes used in experiment
Fig .2 Tungsten Carbide Plates
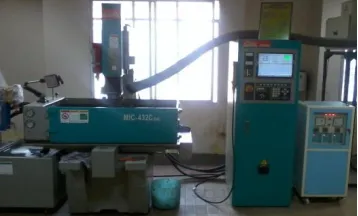
3.3 Machine tool
The ECOWIN 432C machine shown in Fig.3 is a die-sinking machine manufactured by Ecowin Corporation, Taiwan. It is energized by a 60 A pulse generator. Paraffin was used as dielectric fluid during the experiments. All the machining work has been done in this machine taking separate copper electrode and tungsten carbide as work-piece for individual experiments.
3.4 Selection of process parameters
The selected process parameters are: Current (A), Pulse-on-time (µs) and Pulse-off-Pulse-on-time (µs).
3.5 Selection of response variable Material removal rate (MRR)
It represents the volume of material removed from the work piece in unit time.
machining of
Time
part from removed material
of Volume
MRR
Electrode Wear Rate (EWR):
It is defined as the volume of material eroded from the tool electrode per unit time divided by the volume of material eroded from the work piece in the same time.
time unit per piece work
from removed material
of volume
time unit per electrode from
removed material
of Volume
EWR
Surface roughness (Ra)
The centre line average surface roughness (Ra) of the machined surface was measured using a stylus type surface roughness tester (Taylor Hobson, Surtronic +25) of sampling length 0.8 mm, evaluation length of 4 mm and least count of 0.01 μm. The result of the surface roughness depends on the stylus path direction. For this reason the roughness were measured four times and averaged and expressed in microns (μm).
3.6 Design of experiments
As 3 process parameters with 3 levels are selected, the total number of experiments as per full factorial design should be 27. Taguchi proposes the L9 orthogonal array for three level
three factor design which corresponds to only 9 experiments. This reduces the machining time and cost. The process variables (design factors) with their values on different levels are listed in Table 1. The experimental layout for the three process parameters using the L9 orthogonal array is shown in
Table 2. Table 3 shows the experimental results after machining.
Table 1.Factors and levels of process parameters
Factors Symbols Levels
1 2 3
Current
(A) A 20 22 24
Pulse on
time(µs) B 10 50 100
Pulse off
time(µs) C 10 15 20
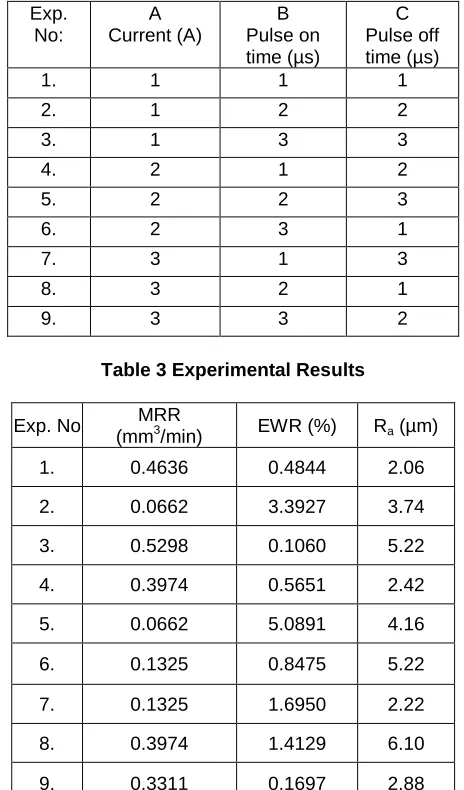
Table 2.Experimental layout using an L9 orthogonal array
Exp. No:
A Current (A)
B Pulse on time (µs)
C Pulse off time (µs)
1. 1 1 1
2. 1 2 2
3. 1 3 3
4. 2 1 2
5. 2 2 3
6. 2 3 1
7. 3 1 3
8. 3 2 1
9. 3 3 2
Table 3 Experimental Results
Exp. No: MRR
(mm3/min) EWR (%) Ra (µm)
1. 0.4636 0.4844 2.06
2. 0.0662 3.3927 3.74
3. 0.5298 0.1060 5.22
4. 0.3974 0.5651 2.42
5. 0.0662 5.0891 4.16
6. 0.1325 0.8475 5.22
7. 0.1325 1.6950 2.22
8. 0.3974 1.4129 6.10
9. 0.3311 0.1697 2.88
4. GREY RELATIONAL ANALYSIS
characteristics. In the grey relational analysis, data preprocessing is first performed in order to normalize the raw data (Table 4) for analysis. In this study, a linear normalization of the experimental results for MRR, EWR and surface roughness were performed in the range between zero and one, which is also called the grey relational generation. In the EDM operation, the material removal rate should be higher. Therefore the normalized data processing for the material removal rate is the higher-the-better performance characteristics considered and is expressed as
)
(
min
)
(
max
)
(
min
)
(
)
(
k
y
k
y
k
y
k
y
k
x
i i i i i
(1)In the grey relational analysis, the normalized data processing for electrode wear rate (EWR) and surface roughness (Ra)
corresponding to lower-the-better criterion is expressed as
)
(
min
)
(
max
)
(
)
(
max
)
(
k
y
k
y
k
y
k
y
k
x
i i i i i
(2)Eq (1) is used for the ―larger-the-better‖ responses and Eq (2) is used for the ―lower-the- better‖ responses, where xi(k) is the
value after grey relational generation, min yi(k) is the smallest
value of yi(k) for the kth response, and the max yi(k) is the
largest value of yi(k) for the kth response. An ideal sequence is
xo(k) where (k= 1, 2, 3 for MRR, EWR and Ra respectively).
The definition of grey relational grade in the course of grey relational analysis is to reveal the relational degree between the nine sequences [xo(k) and xi(k), i=1, 2,3…..9]. The grey
relational coefficient
k
i
can be calculated asmax max min
)
(
)
(
k
k
oi i (3)Where
oi
x
o(
k
)
x
i(
k
)
=difference of the absolute value between xo(k) and xi(k); Ψ= distinguishing coefficientbetween zero and one, the purpose of which is to weaken the effect of
max when it gets too big, and thus enlarges the difference significance of the relational coefficient. In the present case,
= 0.5 is used.Table 4 Data processing of each performance characteristic (Grey relational generation)
Exp. No MRR EWR Ra
Ideal Sequence 1 1 1
1 0.857204 0.075937 0.000000 2 0.001294 0.659569 0.415842 3 1.00000 0.000000 0.782178 4 0.714409 0.092131 0.089109 5 0.000000 1.000000 0.519802 6 0.143011 0.148803 0.782178 7 0.143011 0.318878 0.039604 8 0.714409 0.262266 1.000000 9 0.571398 0.012783 0.202970
Then the overall grey relational grade is calculated by averaging the grey relational coefficient corresponding to each selected process response using Eq.(4). The overall grey relational grade is shown in Table 19.
n k i ik
n
1)
(
1
(4)Where n = number of process responses. The higher value of grey relational grade is considered as the stronger relational degree between the ideal sequence x0(k) and the given
sequence xi (k). It has already been mentioned that the ideal
sequence x0(k) is the best process response in the
experimental layout. Thus the higher grey relational grade implies that the corresponding parameter combination is closer to the optimal.
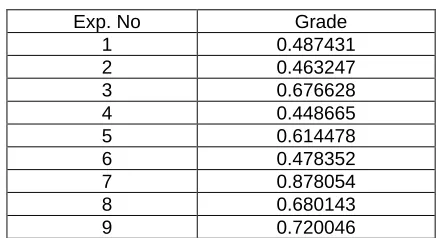
Table5. Grey relational grade of performance characteristic
Exp. No Grade
1 0.487431
2 0.463247
3 0.676628
4 0.448665
5 0.614478
6 0.478352
7 0.878054
8 0.680143
9 0.720046
The higher grey relational grade represents that the corresponding experimental result is closer to the ideally normalized value. In other words, optimization of the complicated multiple performance characteristics can be converted into optimization of a single grey relational grade. The grey relational grade is shown in the Table 5. Since the experimental design is orthogonal, it is then possible to separate out the effect of each machining parameter on the grey relational grade at different levels. Basically, the larger the grey relational grade, the better is the multiple performance characteristics. However, the relative importance among the machining parameters for the multiple performance characteristics still needs to be known so that the optimal combinations of the machining parameter levels can be determined more accurately.
ANOVA for grey relational grade
performance characteristic when F is large is shown in Table 6.
Table 6 ANOVA for Grey relational grade
Source df SS MS F P
A 2 0.1082 0.0541 2027.6 0.000 B 2 0.0023 0.0011 42.89 0.023 C 2 0.0625 0.0312 1171.2 0.001 Error 2 0.0005 0.0002
Total 8 0.1730 0.0541 2027.6
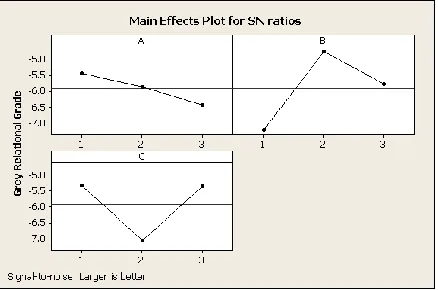
In the grey relational grade graph (Fig.3), it is clearly mentioned that first level of current, second level of pulse on time, first level of pulse off time (A1B2C1) are the optimal
combination of process parameters for multiple performance characteristics.
Fig 3.Grey relational grade graphs of multiple performance characteristics
Confirmation Tests
After the optimal level of machining parameters has been identified, a verification test needs to be carried out in order to check the accuracy of analysis. The estimated grey relational grade,
ˆ
, using the optimal level of the process parameters can be calculated as:
oi
m i
m
1
ˆ
(5)where
m is the total mean grey relational grade,
i is themean grey relational grade at the optimal level, and o is the number of the main design parameters that significantly affect the machining characteristics of EDMed surfaces. Table 7 shows the comparison of the estimated grey relational grade with the actual grey relational grade obtained in experiment using the optimal cutting parameters. It may be noted that there is good agreement between the estimated value (0.67784) and experimental value (0.70860). The improvement of grey relational grade from initial parameter combination (A1B1C1) to the optimal parameter combination (A1B2C1) is
0.2211. This is about 28% of the mean grey relational grade and thus there is significant improvement. Here, it may conclude that the multiple performance characteristic of the
EDM process such as material removal rate and surface finish are improved together by using this approach.
Table 7 Results of the confirmation tests
Initial cutting parameters
Optimal cutting parameters
Prediction Experiment Setting
Level A1B1C1 A1B2C1 A1B2C1
MRR 0.4636 0.5524
EWR 0.4844 0.3521
Surface
Roughness 2.0600 1.8672
Grey relational grade
0.48743 0.67784 0.7086
Improvement of grey relational grade = 0.2211
5. CONCLUSION
The use of the orthogonal array with grey relational analysis to optimize the EDM process with the multiple performance characteristics has been reported here. A grey relational analysis of the experimental results of MRR, EWR and surface roughness can convert optimization of a single performance characteristic called the grey relational grade. As a result, optimization of the complicated multiple performance characteristics can be greatly simplified through this approach. It is shown that the performance characteristics of the EDM process such as MRR, EWR and surface roughness are improved together by using this approach.
REFERENCES
[1]. Puertas I., Luis C.J., Álvarez L., ―Analysis of the influence of EDM parameters on surface quality, MRR and EW of WC–Co‖, Journal of. Material. Processing. Technology 153–154, 1026–1032, 2004.
[2]. Routara B.C., Sahoo P. and Bandyopadhyay A., ―Parametric optimization of EDM process parameters using grey relational analysis for multiple performance characteristic‖, International Journal for Manufacturing Science and Production, 8,.187-197, 2007.
[3]. P.J. Ross, Taguchi techniques for Quality Engineering, New York, Mc-Graw-Hill, 1988
[4]. Soni J.S., Chakraverti G, ―Effect of electrode material properties on surface roughness and dimensional accuracy in electro-discharge machining of high carbon high chromium die steel‖, J. Ind. Eng. 76, 46– 51, 1995.
[5]. Singh S., Maheshwari S., Pandey P.C., ―Some investigations into the electric discharge machining of hardened tool steel using different electrode materials‖, Journal of Material Processing Technology 149, 272–277, 2004.
of tungsten Carbide‖, Journal of. Material. Processing. Technology, 115, 344-358, 2001.
[7]. Soo Hiong Lee, Xiaoping Li, ―Study of the surface Integrity of the machined work piece in the EDM of tungsten Carbide‖, Journal of. Material. Processing. Technology, 139, 315-321, 2003.
[8]. C.H. Che Haron, B. Md. Deros, A. Ginting, M. Fauziah, ―Investigation on the influence of machining parameters when machining tool steel using EDM, Journal of. Material. Processing. Technology, 116, 84-87, 2001.
[9]. Kiyak M., Cakır O., ―Examination of machining parameters on surface roughness in EDM of tool steel‖ Journal of. Material. Processing. Technology, 191, 141–144, 2007.
[10]. W. S Lau, M. Wang, W.B. Lee, ―Electrical discharge machining of carbon fiber composite materials‖, Int J Mach Tools Manuf , 30(2); 297-308, 1990;
[11]. Taguchi G., Introduction to Quality Engineering, Tokyo; Asian Productivity Organization, 1990.
[12]. Soni J.S., Chakraverti G., ―Investigative study on metal removal rate and wear ratio in EDM of high carbon high chromium die steel‖, J. Ind. Eng. 71, 1991.
[13]. Tzu-Yao Tai & S. J. Lu & Y. H. Chen, ―Surface crack susceptibility of electro discharge-machined steel surfaces‖ International Journal of Advanced Manufacturing Technology, 57, 983–989, 2011.