Color Image Classification and Retrieval
using Image mining Techniques
1. Dr.V.Mohan,Professor & Head, Department of Mathematics, Thiagarajar College of Engineering,Tamil Nadu, India, Madurai-15
2. A.Kannan, Assistant professor, Department of MCA,
K.L.N.College of Engineering, Pottapalayam post, Tamil Nadu, India, Sivagangai District-630 611. Abstract
Mining Image data is one of the essential features in the present scenario. Image data is the major one which plays vital role in every aspect of the systems like business for marketing, hospital for surgery, engineering for construction, Web for publication and so on. The other area in the Image mining system is the Content-Based Image Retrieval (CBIR). CBIR systems perform retrieval based on the similarity defined in terms of extracted features with more objectiveness. But, the features of the query image alone will not be sufficient constraint for retrieving images. Hence, a new technique Color Image Classification and Retrieval using a Image Technique is proposed for improving user interaction with image retrieval systems by fully exploiting the similarity information.
Key words : Content Based Image Retrieval, Co-occurrence Matrix, RGB, Texture, Neighbouring Tarket Image 1.0 INTRODUCTION
Everyday, a vast amount of image data are being generated such as business images, satelitte images, medical images and so on. If we anlayze these image data, they reveal useful information. But, unfortunately there are certain difficulties in gathering these data in a correct way. Due to this gap, the data cannot be processed and to arrive at any conclusion. The web is considered the largest global image repositary. This will be taken up as a special case for deeper analysis.
Image retrieval is a fast growing and challenging research area with regard to both still and moving images. Many Content Based Image Retrieval (CBIR) system prototypes have been proposed but few are used as commercial systems. CBIR aims at searching image databases for specific images that are similar to a given query image. It also focuses at developing new techniques that support effective searching and browsing of large digital image libraries based on automatically derived imagery features. It is a rapidly expanding research area situated at the intersection of databases, information retrieval, and computer vision. Although CBIR is still immature, abundant prior work exists.
CBIR systems employ image contents called, ‘features’ to enable the query. This has been the recent focus of studies of image databases. Users can query example images based on some features such as texture, color, shape, region and others. By similarity comparison the target image from the image repository is retrieved. The next important phase is clustering. Clustering algorithms offer superior organization of multidimensional data for effective retrieval. Clustering algorithms allow a nearest-neighbor search to be efficiently performed. Hence, the image mining is rapidly gaining attention among the researchers in the field of data mining, information retrieval and multimedia databases. Spatial Databases is one of the concepts which plays a major role in Multimedia System. Researches extracting semantically meaningful information from image data is ever increasing.
1.1 Comparision of Image Mining with other Techniques
Figure 1.1 Image Mining System Process[1]
Figure 1 shows the image mining process. The images from an image database are first preprocessed to improve their quality. These images then undergo various transformations and feature extraction to generate the important features from the images. With the generated features, mining can be carried out using data mining techniques to discover significant patterns. The resulting patterns are evaluated and interpreted to obtain the final knowledge [1]
2.0 PROBLEM DEFINITION
The current CBIR techniques assume certain mutual information between the similarity measure and the semantics of the images. A typical CBIR system ranks target images according to the similarities with respect to the query and neglects the similarities between target images. The performance of a CBIR system is improved by including the similarity information between target images. To achieve this a new technique is proposed for improving user interaction with image retrieval systems by fully exploiting the similarity information. The technique, which is named cluster-based retrieval of images (CLBIR), retrieves image clusters instead of a set of ordered image. Image retrieval here is based on the integration of two prominent features called color and texture. Given a query, images in the database are firstly grouped using color features i.e., color based image retrieval. In the color based image retrieval the RGB model is used. Color images are in three dimensional, so RGB color components are taken from each and every image. Then the average value of R, G, and B values for both query image and target images are calculated. These three average values for each image are stored as features. By using this stored features the image from the repository is retrieved with respect to the query image.
Then the top ranked images are re-grouped according to their texture features. In the texture-based approach the parameters gathered are on the basis of statistical approach. Statistical features of grey levels were one of the efficient methods to classify texture. The Grey Level Co-occurrence Matrix (GLCM) is used to extract second order statistics from an image. GLCMs have been used very successfully for texture calculations. The different texture parameters like entropy, contrast, dissimilarity, homogeneity, standard deviation, mean, and variance of both query image and target images are calculated. From the calculated values the required image from the repository is extracted.
The preprocessed image (noise reduction and image enhancement) in the database is classified as low detail, medium detail and high detail images respectively on the basis of MLE(Maximum Liklyhood Estimation) estimation. The classified images are then subjected to color feature extraction. The retrieved result is pre-clustered by Fuzzy c means technique. This is followed by GLCM texture parameter extraction where the texture factors like contrast, correlation, mean, variance and standard variance are mined. The resulted values of both the query image and target images are compared by Euclidean distance method. The images similar to the query image are grouped together by means of Neighboring target image selection method. In this way, relations
Preprocessing Transformation & Feature
Extraction Mining
Interpretation & Evaluation
Images in the
among retrieved images are taken into consideration through clustering and may provide for the users semantic relevant clues as to where to navigate. This approach could be combined with many other image retrieval schemes including the relevance feedback approach with dynamically updated models of similarity measure.
The Search efficiency of image retrieval relies on an efficient classification scheme. Rather than searching an image over a huge collection of image database, if the images are classified into a finite number of groups, then the search time is reduced by an amount equal to the total number of groups. This plays a significant role when the present day application falls into real time.
2.1 Possible Solutions
Most current CBIR systems work on a completely different principle. Fixed-length real-valued multi-component feature vectors typically characterize stored images, each image having a value for every feature in the database. In this case, searching consists of calculating the similarity between feature vectors from query and stored images, a process of numerical computation.
Cluster-based retrieval of images by unsupervised learning (CLUE), was one such proposed method to tackle the semantic gap problem. The CLUE is built on a hypothesis that images of the same semantics tend to be clustered. It attempts to narrow the semantic gap by retrieving image clusters based on not only the feature similarity of images to the query, but also how images are similar to each other. But this is a general approach and implementations seemed to be complex.
2.2 Proposed Solution
In this work a new method for gross classification of content is developed that finds application prior to actual classification of content by descriptors. The gross content of image is grouped under three categories as:
(i) High Detail Image (ii) Medium Detail Image (iii) Low detail Image 2.3 Image Retrieval
Retrieving the images from the image collection involves the following steps Preprocessing
Color image classification l Preclustering
Texture feature extraction Similarity comparison
Neighboring target image selection
Block Diagram of Color Image Classification and Retrieval System Figure 2.1
Image Database Pre-processing
Segmenting Color
Images Applying Fuzzy’C Means Algm
Texture Analysis
Store the Result
Sort Results Select Neighboring
Images
2.4 Preprocessing
Pre-processing is done on images at the lowest level of abstraction. The aim of the pre-processing is to suppress unwilling distortions and enhance some image features, which is important for future processing of the images. This step focuses on image feature processing.
2.5 Contrast Enhancement
Three functions are particularly suitable for contrast enhancement: imadjust, histeq, and adapthisteq. Steps for contrast enhancement
Load image Resize image
Enhance grayscale image
2.6 Noise Reduction Filtering
Filtering is a technique for modifying or enhancing an image. The image is filtered to emphasize certain features or remove other features. The noise in the images is filtered using linear and non-linear filtering techniques. Median filtering is used here to reduce the noise.
2.7 Simplified Classification By MLE
To meet the objective of image classification, it is proposed to use texture descriptor. The following schematic represents the MLE approach.
The texture represents the energy content in the image. For a highly textured image the energy will be high as compared to that of medium and low texture images. So when combining the energy values defined for a local patch of an image the values will be high for highly textured areas and will be low for smooth areas. Also the local patches of same kind of textured areas will approximate same energy level. So it can be effectively called the “Texture Activity Index”. Based on the energy level associated with each classification of images, they can be termed High, Medium and Low level limages. In this work the Rayleigh distribution is considered in order to fit the energy levels of the given image. This is because Rayleigh distribution is a special case of the standard Gaussian distribution. It can be used to fit even the complex values since the magnitude of complex values seems to follow Rayleigh distribution.
The calculated MLE value varies for all the three kind of images. The boundaries for the three categories is fixed based on experimental values as,
(i) High Detail Image 0<MLE≤c (ii) Medium Detail Image c<MLE≤2 (iii) Low Detail Image MLE>2
Where ‘c’ is a fractional constant value. 2.8 Color Based Image Retrieval
As stated in the introduction, different categories of color spaces are present. The RGB model is followed in this system i.e., for color based image retrieval system. An RGB color images is an M*N*3 array of color pixels, where each color pixel is a triplet corresponding to the red, green, and blue components of an image at a spatial location. An RGB image can be viewed as the stack of three gray scale images that, when fed into the red, green, blue inputs of a color monitor, produce the color image on the screen. By convention the three images form an RGB images are called as red, green and blue components. The figure 2.2 shows the group of Red, Green, Blue dominant pictures.
The average values for the RGB components are calculated for the all images. R average= summation of all the RED pixels in the image R (P)
No. Of pixels in the image P
No. Of pixels in the image P
B average= summation of all the BLUE pixels in the image B (P) No. Of pixels in the image P
Figure 2.2
2.9 Texture:
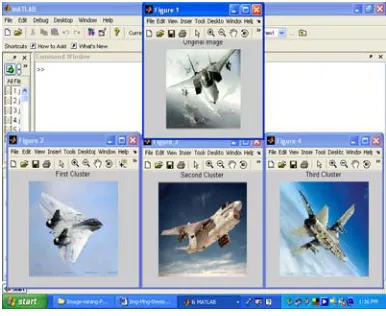
Texture feature extraction is the procedure of generating descriptions of a textured surface in terms of measurable parameters. The extracted features represent the relevant properties of the surface, and may be used with a classifier. It is commonly agreed that textural features play a fundamental role in classifying textured surface and texture segmentation. The figure 2.3 shows the clustering images.
Figure 2.3
2.10 Feature Extraction:
Feature extraction is the quantification of texture characteristics in terms of a collection of descriptors or quantitative feature measurements, often referred to as a feature vector. Texture features and texture analysis methods can be loosely divided into two categories - statistical and structural
2.11 Statistical approach:
relative displacement vector (d, è), which is computed and stored in a matrix, referred to as grey level co-occurrence matrix (GLCM) P. This matrix is used to extract second-order statistical texture features. Haralick suggests severalfeatures describing the two dimensional probability density function pij which is nothing but the normalization equation.
1 0 , N j i ij ij ijV
V
P
The features used are Entropy, Contrast, Dissimilarity, Homogenity. These are well handled with the previously formed normalization equation.
2.12 Similarity Comparison
The retrieval process starts with feature extraction for a query image. The features for target images (images in the database) are usually precomputed and stored as feature files. Using these features together with an image similarity measure, the resemblance between the query image and target images are evaluated and sorted. Similarity measure quantifies the resemblance in contents between a pair of images. Depending on the type of features, the formulation of the similarity measure varies greatly. The Mahalanobis distance and intersection distance are commonly used to compute the difference between two histograms with the same number of bins. When the number of bins is different, the Earthmover’s distance (EMD) is applied. Here the Euclidean distance is used for similarity comparison.
R= (C1-Ci) 2+(D1-Di) 2+(H1-Hi) 2+(E1-Ei) 2+(µ1-µi) 2
Where, R= the resultant distance.
2.13 Neighboring Target Image Selection
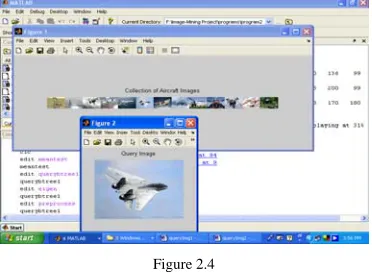
Collections of target images that are “close” to the query image are selected as the neighborhood of the query image. The figure 2.4 shows the retrieval of aircraft from the concerned group of cluster images from the database.
Figure 2.4
2.14 Performance Evaluation Of Proposed CBIR System
Evaluation of retrieval performance is a crucial problem in content-based image retrieval (CBIR). Many different methods for measuring the performance of a system have been created and used by researchers. We have used the most common evaluation methods namely, Precision and Recall usually presented as a Precision vs Recall graph.
3.0 CONCLUSION
Image mining is the advanced field of Data mining technique and it has a great challenge to solve the problems of various systems. The main objective of the image mining is to remove the data loss and extracting the meaningful information to the human expected needs. Here, we have furnished some of the techniques, which can be applied for any new proposal system in future.
In this system, the color based and texture based image retrieval yields high accuracy. That is, it retrieves the most matching images from the collection of the images, with respect to the query image.
In future, it is proposed to implement a voice recognition system to give our desired image as a keyword to find the related images from the database.
4.0 REFERENCES
[1] Image Mining: Trends and Developments, Ji Zhang Wynne Hsu Mong Li Lee
[2] U. M. Fayyad, S. G. Djorgovski, and N. Weir: Automating the Analysis and ataloging of Sky Surveys. Advances in Knowledge
Discovery and Data Mining, 471-493, 1996.
[3] W. Hsu, M. L. Lee and K. G. Goh. Image Mining in IRIS: Integrated Retinal Information System (Demo), in Proceedings of ACM
SIGMOD International Conference on theManagement of Data, Dallas, Texas, May 2000.
[4] A. Kitamoto. Data Mining for Typhoon Image Collection. In Proceedings of the SecondInternational Workshop on Multimedia Data Mining (MDM/KDD'2001), San Francisco, CA,USA, August, 2001.
[5] C. Ordonez and E. Omiecinski. Discovering Association Rules Based on Image Content. Proceedings of the IEEE Advances in Digital Libraries Conference (ADL'99), 1999.
[6] O. R. Zaiane, J. W. Han et al. Mining MultiMedia Data. CASCON'98: Meeting of Minds, pp 83-96, Toronto, Canada, November 1998.
[7] M. C. Burl et al. Mining for Image Content. In Systemics, Cybernetics, and Informatics / Information Systems: Analysis and Synthesis, (Orlando, FL), July 1999.
[8] M. Datcu and K. Seidel. Image Information Mining: Exploration of Image Content in LargeArchives. IEEE Conference on Aerospace, Vol.3, 2000.
[9] Yixin Chen, James Z.Wang, Robert Krovetz “Cluster Based Retrieval Of Images by Unsupervised Learning”, IEEE Transaction on Image Processing, Vol 14, pp.1187-1199, No.8, August 2005.
[10] D.S. Zhang and G.Lu, “Content Based Image Retrieval Using Texture Features”, In Proc. of First IEEE Pacific-Rim Conference on Multimedia (PCM’00) pp.392-395, Sydney, Australia, December2000.
![Figure 1.1 Image Mining System Process[1]](https://thumb-us.123doks.com/thumbv2/123dok_us/9599273.1488416/2.612.96.456.76.268/figure-image-mining-system-process.webp)