IJSRSET185308 | Published : 28 April 2018 | March-April-2018 [(5) 3 : 55-60 ]
Themed Section : Engineering and Technology © 2018 IJSRSET | Volume 5 | Issue 3 | Print ISSN: 2395-1990 | Online ISSN : 2394-4099
55
A Clustering Based Hyper Spectral Image (HSI) Classification
and Segmentation for Satellite Remote Sensing
C. Rajinikanth1, Dr. S. Abraham Lincon2
1Research Scholar, Department of Electronics & Instrumentation Engineering, Annamalai University, India
2Professor, Department of Electronics & Instrumentation Engineering, Annamalai University, India 1
ABSTRACT
In this paper, a new algorithm has been designated for classification of satellite remote sensing of hyperspectral image. The classification process is based on the three main categories: (1) image fusion, performed using morphological process of both spatial and spectral information available in the remote sensed images. (2) Clustering, which performed in supervised techniques using thresholding effect of image pixel intensity and (3) segmented and texture based image analysis, in this process to achieve a new textural based image clustering to overcome the problem of multi-label images in satellite remote processing. Finally, it gets clustered and result in segmented output. The proposed research contribution is validated by classification experiments using Airborne Visible/Infrared Imaging Spectrometer (AVIRIS) image sensors from the results the overall accuracy of single and multi-label of Salinas‟s dataset.
Keywords : Hyper Spectral Image, Satellite Remote Sensing, Clustering, Classification, Segmentation
I.
INTRODUCTIONDigital image processing supports strong research in the areas of image segmentation, enhancement and image based pattern recognition. Nowadays, these areas are widely applied in remote sensing, medical image processing, radar, sonar, acoustic image processing and robotics. Among these areas Image segmentation is used everywhere to simplify and to change the representation of image in to something that is more meaningful and easier to analyse. In traditional segmentation, a general pixel clustering process is presented based on thresholding effect of image pixel intensity. In this type of segmentation, cluster separation is extracted by using mean feature of image pixel. Modern segmentation process is performed based on individual features of image pixels. Min Wang et al [1]. Discussed the several appropriate model of region line association
object detection in multiscale segmentation. H.Gökhan Akçay et al [3]. Discuss the generic method for the modelling and detection of compound structures that involve arrangements of an unknown number of primitives in large scenes of remote sensing. The modelling process are investigates via Markov random field and the detection task has formulated as the selection of multiple subsets of candidate regions from a hierarchy segmentation. Where each set of selected regions has been constituted an instance of the compound structure. The combinatorial selection problem of hierarchy segmentation is solved by the joint sampling of groups of regions by maximizing the likelihood of their individual appearances and relative spatial arrangements of remote sensing images. Yanfei Zhong et al [4] have developed a new technique of highly efficient Multiscale and Multi feature Normalized (MMN) cut algorithm for HSR imagery segmentation. The MMN cut is much less sensitive to image boundaries and also preserves the multi scale information. Normalized Cuts (NC), as a commonly used for the method of natural image segmentation of remote sensing images. It can also acquire a globally optimized segmentation result equivalent to the optimized partitions of a super pixel graph. These graph which can provide powerful indication to guide the HSR imagery segmentation. Guiyun Zhou el al [5]. Suggested a appropriate method for terrestrial laser scanning in planner segmentation of satellite segmentation. The planner segmentation is parameterized by its normal vector and the distance from the origin. It is multiple standpoints can be used for such applications as plane-based registration and 3-D reconstruction of buildings has been presented. F. A. Ávila Rodrigues et al [6]. Investigated on Synthetic Aperture Radar (SAR) [6], [12] image roughness due to the presence of speckle noise in remote sensing problems. In this method is estimated roughness parameters of SAR images, instead of directly processing the speckled images. SAR image algorithms based on thresholding and level set applied to synthetic and real SAR images. Due to speckle the SAR image segmentation can be hard to achieve using
thresholding-based techniques and it can be suitable when applying these techniques to the estimated roughness parameters for single-look SAR images. Zhang Chunsen et al [7]. Stated that appropriate method for classification accuracy of hyper spectral image is improved by using a probabilistic weighted strategy for multi featured function. In this technique concentrate on weighted for different features and rewriting the SVM classification of P-fusion for makes full use of every single spectral–spatial feature. The probabilistic weighted strategy is compared with the VS-SVM and P-fusion, effectively improves the classification accuracy by giving feature weights based on the performance of different features. Junping Zhang et al [8]. Developed a method for object-based mid-level representation for semantic classification for high resolution remote sensing images. The mid-level representation method is how to boost the relatively low classification accuracy caused by using pixel-based image classification approaches and low-level visual structure. The method of low-low-level visual features and high-level semantics are not well define in semantics images. The object-oriented semantic classification algorithm that combines bag-of-visual-words (BOV) with the optimal segmentation scale intends to overcome the defect of conventional BOV in lacking of relationship between image patches and to give more thorough description. Ribana Rosche et al [9]. Presented a shapelet-based spatial–spectral classification of hyperspectral image data. The shapelet-based approach varies from earlier suggested sparse representation- based classifiers for hyperspectral image data. In this method that sophisticated prior knowledge about the spatial nature of an image is exploited by applying a constructed highly adapted patch-specific based classification procedures by means of the representation error. The shapelet-based spatial– spectral classification approach shows greater outcomes in comparison to sparse-representation-based classifiers that use only limited spatial information. Erlei Zhang et al [10].
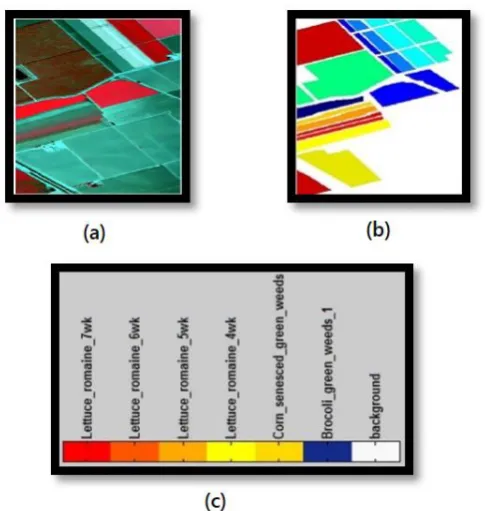
The Salinas hyperspectral datasets is selected for classification Experiments. The Salinas datasets captured by the Airborne Visible/Infrared Imaging Spectrometer (AVIRIS) sensor with 224 spectral band and the dataset has a pixel value of 512 × 217 and spatial resolution of 3.7m of Fig.1 shows the RGB colour composition and ground truth reference map and colour code of Salinas‟s dataset. Training Data: A training set is a set of data used to discover potentially predictive relationship. Test Data: A test set is a set of data used to assess the strength and utility of a predictive relationship. In our process, the images are Train Data for 77% of different Dataset and its corresponding Test Data for 23% of the different Dataset.
Figure 1. Dataset of Salinas (a) RGB image composite, (b) Ground- truth map, (c) Color code of different
classes
III.
RELATED WORKS
A. Cellular Automata
The Cellular Automata (CA) is simple method and synchronous transition technique. The remote sensed digital image like Salinas is considered as 3 3 bidirectional array. Thus, each pixel is characterized by the triplet variables as
i j k
, ,
.Where
i j
,
represent the position of the pixel and k is the associated colour. The, k is assumed as to be
2
8colour resolution. The CA follows two different rules for filtering depending on the location of the pixels in the images. The rule for the filtering pixel within the boundary involves the averaging neighbourhood pixels. The neighbour pixels are taken by using Moore or Neumann structure [13] format. The rule for the filtering boundary or contour pixels involves using the threshold value.
B. Histogram Equalization
The filtered image is enhanced using the histogram equalization. This histogram equalization involves in the assignment of the minimum value of the pixel intensity is considered as 0 and maximum value of the pixel intensity as 255, as the colour intensity is
2
8 bit resolution.IV.
PROPOSED METHOD
In this section has been elaborated the proposed system strategy of HSI classification of remote sensing image as shown in Fig.2.The proposed approach consist of three prevalent techniques, including image fusion, image clustering and segmentation. The image fusion has been performed based on pre-processing by using CA based image filtering. This provide smoothness to the image pixel and the image enhancement has been performed by using Histogram Equalization (HE). HE is provide clear depth information of the image. The image clustering is achieved through Spectral Spatial (SS) supervised HSI classification. Finally, it is clustered and result in segmented output.
Figure 2. Block diagram of Proposed System
In this section introduces the concepts of and strategy employed to Spectral Supervised Tree Baggar Algorithm (SSTBA) for remote sensing. Proposed a supervised SSTBA classification including a new construction approach for hyper spectral image classification applied to neural networks. The SSTBA algorithm efficiently handle to multi feature learning of HSI. The SS Supervised techniques consist of grouping of samples of recognized labels to assign unclassified pixels to one of several informational classes based on available labelled data. Supervised method implements the steps such as feature extraction, training and labelling. Finally, in section (A), we introduce the SSTBA algorithm, which is the SS, supervised hyperactive spectral classification algorithm and employed to the neural networks parameters. It is described for finding the labelled image “Lb” by which the input of image pattern “P” and “L” is the optimal selection of image cluster. Moreover the clustering technique has been considered the “ Lb ” of each cluster by the out labelled image in clustering. At the outset the proposed clustering algorithm can estimate max and min of the selected average value, expressed as
M max( )T (1)
After identifying the maximum ( M ) and minimum ( N ) of the average selected pattern in image cluster, the proposed clustering algorithms has estimated the difference between each feature of image pattern. Furthermore the difference of each feature “H” can be described as
2
( i j)
H PP (3)
Where “P” is the pattern of image. Then Pi and Pj
indicate the coordinates of the image pattern. The SS based proposed classifier has been estimated the number of class labels as well as the training of input image pattern. Finally the proposed clustering algorithms has estimated for labelled image in colour image format moreover labelled output represents segmentation result for the high resolution remote sensing data input.
B. Spectral Supervised Tree Baggar Algorithm (SSTBA):
Input: Pattern of image „P‟ and Optimal selection of clusterset „L‟, Output: Labeled Image, „Lb‟.
Step 1: Step 2: ;
Step 3: P‟ √
Step 4: { }//
Step 5: // image pattern // Step 6: end
V.
RESULTS AND DISCUSSION
and evaluates the each stage of the proposed SSTBA algorithm for the Salinas dataset.
1) Contingency Table Matrix Parameters Analysis. Determination of accuracy of HIS based on the proposed SSSTBA can be done by two method.
a) Contingency matrix or Error matrix b) Kappa coefficient
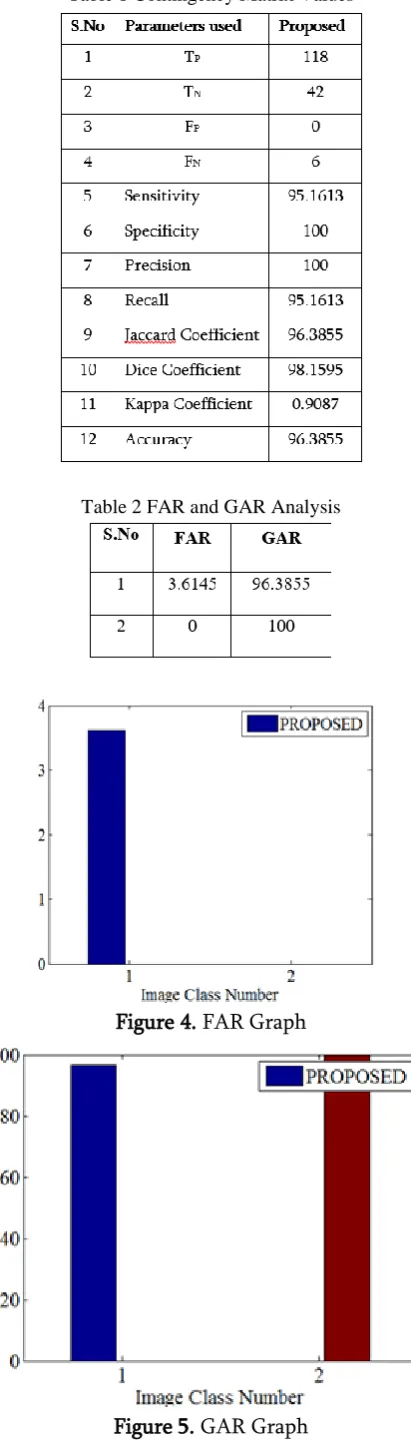
Contingency matrix and Kappa coefficient is techniques for calculation of Accuracy assessment with SSTBA based HSI classification. It is based on the data providing the assumption on the classes of reference datasets. The datasets are classified two-manner 1) reference data value and 2) ground truth data value. Moreover, The Salinas dataset confusion matrix parameters, True Positive (TP) value of 118, True Negative (TN) value of 42 and Kappa co-efficient of 0.9087 in Table 1. Moreover, the FAR value 3.6145, GAR value 96.3855 has been presented in Table 2 and depicted in Fig.4 and Fig.5. The proposed method of SSTBA performance using Contingency matrix values have been compared with statistical parameter of TP, TN and moreover for other parameters are listed in Table1. The proposed SSTBA systems has been provided for better Kappa coefficient for the given dataset is listed in Table1.
Figure 3. Output images of proposed SSTBA clustering. (a) Input image (b) Filtered image (c) Enhanced image(d) classified image (f) Segmented
image
Table 1 Contingency Matrix Values
Table 2 FAR and GAR Analysis
Figure 4. FAR Graph
VI.
CONCLUSIONPaper contribute, a novel dictionary learning method called SSTBA for HSI classification has been proposed. The SSTBA representation show the outstanding ability to give better description of the HSI classification, especially exploiting SSSTBA in NN as classifier. The experiments conducted for Salinas‟s datasets prove the better performance of the proposed method compared with multilabeling image extraction methods at different HSI classification procedure.
VII.
REFERENCES[1] Min Wang, Jiru Huang, and Dongping Ming. “Region-Line Association Constraints for High-Resolution Image Segmentation,” IEEE Journal of Selected Topics in Applied Earth Observations and Remote Sensing, 2016, 10 (2), pp. 628-637.
[2] Yongyue Hu, Jianyu Chen, Delu Pan, and Zengzhou Hao, “Edge-Guided Image Object Detection in Multiscale Segmentation for High-Resolution Remotely Sensed Imagery” IEEE Transactions on Geoscience and Remote Sensing, 2016 ,54( 8),pp. 4702-4711.
[3] H. Gökhan Akçay and Selim Aksoy, “Automatic Detection of Compound Structures by Joint Selection of Region Groups from a Hierarchical Segmentation” IEEE Transactions on Geoscience and Remote Sensing,2016, 54 (6),pp. 3485-3501.
[4] Yanfei Zhong, Rongrong Gao, and Liangpei Zhang,“Multiscale and Multifeature Normalized Cut Segmentation for High Spatial Resolution Remote Sensing Imagery” IEEE Transactions On Geoscience And Remote Sensing, 2016,54(10),pp.6061-6075.
[5] Guiyun Zhou, Shuai Cao, and Junjie Zhou, “Planar Segmentation Using Range Images From Terrestrial Laser Scanning”, IEEE Geoscience And Remote Sensing Letters, 2016,13(2),pp.257-261.
[6] F. A. Ávila Rodrigues, J. F. S. Rocha Neto, R. C. Pinheiro Marques, F. N. Sombra de Medeiros, and J. Santos Nobre. “SAR Image Segmentation Using the Roughness Information” IEEE Geoscience and Remote Sensing letters, 2016, 13( 2),pp.132-136.
[7] Zhang Chunsen, Zheng Yiwei, and Feng Chenyi, “Spectral–Spatial Classification of Hyperspectral Images Using Probabilistic Weighted Strategy for Multifeature Fusion” IEEE Geoscience and Remote Sensing letters,2016,13,pp.1562-1566.
[8] Junping Zhang, Tong Li, Xiaochen Lu, and Zhen Cheng, “Semantic Classification of High-Resolution Remote-Sensing Images Based on Mid-level Features” IEEE Journal Of Selected Topics in Applied Earth Observations and Remote Sensing, 2016, 9(6),pp.2343-2353. [9] Ribana Rosche, and Björn Waske,
“Shapelet-Based Sparse Representation for Landcover Classification of Hyperspectral Images” IEEE Transactions on Geoscience and Remote Sensing, 2016, 54(3),pp.1623-1634.