Original Research Article
Occupational hazards and health problems among
traffic personnel of Mangaluru city
Prakash Kumar Mishra, Jagannath Purushothama*
INTRODUCTION
Environmental air pollution is one of the global problems and is a common problem for both developing as well as developed countries, which attracts the attention of human beings for their severe long-term consequence.1,2 The occupational environment constitutes an important part of man's total environment. So to a large extent, their health is mostly affected by work surroundings. Though numerous types of environment exist, it is the physical environment, which plays an important bearing on health.3
Air quality crisis in cities of India is mainly due to emission from the vehicles. Increase in use of motor vehicles leading to the subsequent rise in the levels of air pollution. This has, especially affected the traffic personnel who have to spend long duty hours at busy traffic signals.4 The personnel has to undergo physical strain in an environment polluted with fumes, the exhaust of vehicles, use of blowing horns, blow off dust in the air by the speeding vehicles, etc..5 Traffic personnel are exposed to higher health risk, to ensure steady traffic among hundreds of noisy and polluting vehicles throughout their duty period. The duration of exposure increases the chance of health hazard and becomes more
ABSTRACT
Background: Occupational health risks and hazards due to the polluted environment have become a serious public
health concern. Thus, the duty-bound personnel like traffic police who are continuously exposed, may be at high risk and badly suffer from related health problems. This study was conducted to determine the prevalence of occupational hazards and related health problems among traffic personnel in Mangaluru city. It also aimed to determine the association between occupational hazards and health problems.
Methods: This cross-sectional study was conducted among traffic personnel of Mangaluru city. A semi-structured questionnaire with established reliability and validity was used to measure occupational hazards, protective measures, and health problems.
Results: The prevalence of respiratory morbidity, eye symptoms, and auditory symptoms was found to be 51.2%, 61.6%, and 47.5% respectively. Respiratory morbidity and duration of use of protective measures against air pollution are found to be significantly associated. The duration of exposure to noise pollution was also significantly associated with the auditory symptoms.
Conclusions: Police personnel suffer from significant occupational health problems, due to hazards like air pollution
and noise. Necessary protective measures should be taken to ensure the safety of traffic personnel. This study showed an association between occupational hazards and related health problems.
Keywords: Traffic police, Mangaluru city, Occupational hazards, Health problems, Protective measures
Department of Public Health, K.S. Hegde Medical Academy, Nitte (Deemed to be university), Mangaluru, Karnataka, India
Received: 15 June 2019
Accepted: 18 July 2019
*Correspondence:
Dr. Jagannath Purushothama, E-mail: [email protected]
Copyright: © the author(s), publisher and licensee Medip Academy. This is an open-access article distributed under
the terms of the Creative Commons Attribution Non-Commercial License, which permits unrestricted non-commercial use, distribution, and reproduction in any medium, provided the original work is properly cited.
severe.6 Environmental pollution escalates occupational
hazards in this group. In urban areas, industrial or vehicular pollution is predominant and significantly contributes to air quality problems.
METHODS
This study is a cross-sectional study. The study was conducted in the four traffic police stations in Mangaluru city, Karnataka, India. The study period for this study was from January - April 2019. The study population comprised of all operational traffic personnel of Mangaluru city, Karnataka. In this study the traffic personnel willing to participate with a written consent are included. The traffic personnel with less than one-year work experience and traffic personnel posted in police station/non-traffic duty were excluded from the study. Sample size was taken as 80% of total 297 traffic personnel.
Study instrument
In this study, self-administered (semi-structured) questionnaires were used to collect the information. The questionnaire includes socio-demographic details, American Thoracic Society-Division of Lung (ATS-DLD) respiratory morbidity assessment, eye problems and safety measures, noise pollution and its related health problem and protective measures. Descriptive data were analyzed using frequency, percentage, mean, median and standard deviation (S.D). For the association between variables, appropriate bivariate was done. For the association between variables, chi-square was used p value less than 0.05 was considered as statistically significant.
RESULTS
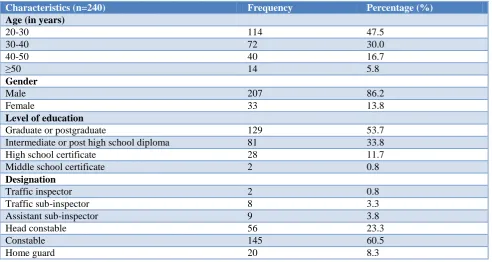
In this study the minimum age was 20 years, and the maximum age was 60 years with a mean of 33.42±8.98 years. In this study, most (86.2%) of the respondents were males. The work experience of the respondents ranged between 1 to 34 years with mean 9.20±7.944 years. Other demographic details are described in (Table 1). In the study, the prevalence of respiratory symptoms was 51.2%, eye symptoms (61.6%) and auditory symptoms (47.5%). The majority (49.6%) of the respondents had cough while on outdoor traffic duty or after that. Among them, the majority (68.1%) had frequent cough while 31.9% of the respondents reported chronic cough. From the total respondents of 240, 45% of the respondents reported they bring up phlegm. Of these 108 respondents, 63% and 37% reported frequent phlegm and chronic phlegm respectively (for details go to Table 2 and Table 3). In the study, 34.2% of the respondents reported that people often indicate they talk loudly. Similarly, 28.8% of the respondents reported they would ask others to talk loudly (Table 4). The prevalence of respiratory morbidity and duration of use of protective measures were compared. An association with statistical significance was found (p=0.027) between the prevalence of respiratory morbidity and duration of use of protective measures against air pollution. Similarly, an association with statistical significance (p=0.05) was found between the duration of exposure to air pollution and eye symptoms. Significant association (p=0.028) was found between the duration of exposure to noise with the prevalence of auditory symptoms (Table 5).
Table 1: Socio-demographic details.
Characteristics (n=240) Frequency Percentage (%)
Age (in years)
20-30 114 47.5
30-40 72 30.0
40-50 40 16.7
≥50 14 5.8
Gender
Male 207 86.2
Female 33 13.8
Level of education
Graduate or postgraduate 129 53.7
Intermediate or post high school diploma 81 33.8
High school certificate 28 11.7
Middle school certificate 2 0.8
Designation
Traffic inspector 2 0.8
Traffic sub-inspector 8 3.3
Assistant sub-inspector 9 3.8
Head constable 56 23.3
Constable 145 60.5
Table 2: Sources of air pollution and respiratory morbidity.
Characteristics (n=240) Frequency Percentage (%)
Sources of traffic air pollution*
Vehicle smoke 190 79.2
Dust raised from vehicular movement 189 78.8
Others 12 5.0
Hours of exposure
Less than 2 hrs/day 4 1.7
2-4 hrs/day 31 12.9
Over 4 hrs/day 205 85.4
Respiratory morbidity
Wheezing (n=240)
Yes 81 33.8
No 159 66.2
Cough (n=240)
Yes 119 49.6
No 121 50.4
Phlegm (n=240)
Yes 108 45.0
No 132 55.0
Protect from air pollution
Yes 174 72.5
No 66 27.5
Protective measures* (n=174)
Facemask 148 85.1
Handkerchief 43 24.7
Others 9 5.1
Duration of use
Less than 2 hrs/day 28 16.1
2-4 hrs/day 75 43.1
Over 4 hrs/day 71 40.8
Reasons for nonuse of protective measures* (n=66)
Unavailable 6 9.1
Uncomfortable 33 50.0
Unnecessary 46 69.7
Unaffordable 13 19.7
Other reasons 2 3.0
* Multiple response.
Table 3: Distribution of respondents according to eye symptoms.
Characteristics Frequency Percentage (%)
Symptom of eye (n=240)
Yes 148 61.7
No 92 38.3
Type of eye symptoms* (n=148)
Dry eyes 30 20.2
Watering of eyes 44 29.7
Redness 73 49.3
Burning or itching 41 27.7
Protective eyewear (n=240)
Yes 79 32.9
No 161 67.1
Duration (n=79)
Less than 2 hrs/day 5 6.3
2-4 hrs/day 41 51.9
Characteristics Frequency Percentage (%) Reasons for nonuse of protective eyewear* (n=161)
Unavailable 16 9.9
Uncomfortable 73 45.3
Unnecessary 99 61.5
Unaffordable 9 5.6
* Multiple response.
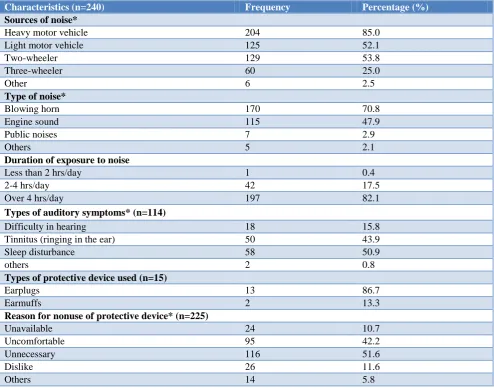
Table 4: Distribution of respondents according to exposure to noise and related health problem.
Characteristics (n=240) Frequency Percentage (%)
Sources of noise*
Heavy motor vehicle 204 85.0
Light motor vehicle 125 52.1
Two-wheeler 129 53.8
Three-wheeler 60 25.0
Other 6 2.5
Type of noise*
Blowing horn 170 70.8
Engine sound 115 47.9
Public noises 7 2.9
Others 5 2.1
Duration of exposure to noise
Less than 2 hrs/day 1 0.4
2-4 hrs/day 42 17.5
Over 4 hrs/day 197 82.1
Types of auditory symptoms* (n=114)
Difficulty in hearing 18 15.8
Tinnitus (ringing in the ear) 50 43.9
Sleep disturbance 58 50.9
others 2 0.8
Types of protective device used (n=15)
Earplugs 13 86.7
Earmuffs 2 13.3
Reason for nonuse of protective device* (n=225)
Unavailable 24 10.7
Uncomfortable 95 42.2
Unnecessary 116 51.6
Dislike 26 11.6
Others 14 5.8
* Multiple response.
Table 5: Association between duration of exposure to air pollution with prevalence of respiratory symptoms and duration of exposure to noise with auditory symptoms.
Characteristics (n=240) Present (%) Absent (%) P value
Duration of exposure air pollution (n=240) Respiratory symptoms
<2 hrs/day 3 (1.2) 1 (0.4)
0.591
2-4 hrs/day 15 (6.2) 16 (6.7)
>4 hrs/day 105 (43.8) 100 (41.7)
Duration of use of protective measures (n=174)
<2 hrs/day 19 (10.9) 9 (5.2)
0.027*
2-4 hrs/day 30 (17.2) 45 (25.9)
>4 hrs/day 39 (22.4) 32 (18.4)
Characteristics (n=240) Present (%) Absent (%) P value
Duration of exposure to air pollution (n=240) Eye symptoms
<2 hrs/day 3 (1.3) 1 (0.4)
0.05*
2-4 hrs/day 13 (5.4) 18 (7.5)
>4 hrs/day 132 (55.0) 73 (30.4)
Duration of exposure to noise (n=240) Auditory symptoms
<2 hrs/day 0 (0) 1 (0.4) 0.028*
2-4 hrs/day 13(5.4) 29 (12.1)
>4 hrs/day 101(42.1) 96 (40.0)
* p≤0.05, **p<0.001.
DISCUSSION
The present study was conducted to determine the prevalence of occupational hazards and related health problems, using a self-administered questionnaire, among traffic personnel of Mangaluru city, Karnataka, India. In the present study, respondents belonged to the age group of 20 to 60 years with the mean age of 33.42±8.98 years. A study conducted in Kolkata by Ganthi et al showed that the mean age of traffic personnel was 39.2±7.8 years.7 This variation in the mean age of the respondents in both the groups may be due to the recruitment of senior personnel in metro cities when compared to non-metro cities.
In this study, the prevalence of respiratory morbidity was found to be 51.2%. In a study conducted by Saravana Ganthi et al., in 2012, to assess the exposure to vehicular pollution and its impact on traffic policemen, the prevalence of respiratory symptoms was found to be 57.69%.7 Similarly, a study conducted by Sharat et al., on respiratory effects of air pollutants among traffic policemen in Patiala showed the prevalence of respiratory symptoms for frequent coughing as 68% and shortness of breath as 22%.9 This shows the prevalence of respiratory morbidity is a common phenomenon among traffic police personnel, across various geographic locations in India, owing to similar occupational characteristics and prolonged exposure to vehicular air pollution.
In the present study, the prevalence of eye symptoms was 61.7%. A study conducted by Prajapati et al, in Ahmedabad City, stated the prevalence of eye problems as 44.81%.10 In the present study, prevalence of eye symptoms was higher when compared to the Ahmedabad contemporaries. Cleanliness of streets and density of traffic are also important factors, apart from long term exposure to vehicular air pollution.
In the present study, the prevalence of ear problems was found to be 47.5%. In addition, a study conducted by Tripathi et al on hearing quality of traffic policemen in Ahmedabad, in 2006, showed that 11.6% complained of regular tinnitus and 62.8% reported work-related tinnitus.8 The reported ear problems in the present study is higher in comparison to the study conducted by Tripathi et al.8 The possible reason could be the use of
shrill horns and inadvertent honking behavior among motorists in Mangaluru. Lack of awareness about noise pollution and its effect on health, lack of information about protective measures may be the cause of low prevalence of auditory protective measures among the traffic personnel. However, the reasons for non-usage of protective measures were found similar in both studies. These reasons are mostly attitude-driven than knowledge factors.
CONCLUSION
The study found that the prevalence of respiratory morbidity, eye symptoms, and ear problems were 51.2%, 61.6%, and 47.5% respectively. The observed result is due to the prolonged exposure to vehicular pollution and not using personal protective measures. Health problems can become the barriers for performing their duties efficiently.
ACKNOWLEDGEMENTS
The authors thank the Deputy Commissioner of Police of the Mangaluru for giving permission to carry out the study and to the traffic personnel for giving their consent to participate in the study.
Funding: No funding sources Conflict of interest: None declared
Ethical approval: The study was approved by the Institutional Ethics Committee of K.S. Hegde Medical Academy (KSHEMA), Nitte (Deemed to be University)
REFERENCES
1. Bhandari A, Gautam R, Bhandari S. Knowledge and practice on prevention of respiratory health problems among traffic police in Kathmandu, Nepal. Int Sch Res Not. 2015;1-6.
2. Muralikrishna IV, Manickam V. Environmental Pollution Management. J Environ Pollut. 2017;1–4. 3. Satapathy D, Behera T, Tripathy R. Health status of traffic police personnel in Brahmapur city. Indian J Community Med Off Publ Indian Assoc Prev Soc Med. 2009;34(1):71–2.
police mene at Tirupati, AP, India. Int J Physiother Res. 2013;1(5):279–82.
5. Sridher S, Thulasiram S, Rishwanth R, Sakthivel G, Rahul V, Uma Maheswari R. Health status of traffic police personnel in Chennai city. Public Health Rev Int J Public Health Res. 2017;4(04).
6. Al-Alawi R. Web-Based Intelligent Traffic Management System. Proc World Congr Eng Comput Sci. 2009;1-4.
7. Ganthi S, Subramanian MPS, Rajabudeen E. Exposure to vehicular pollution and its impact on traffic policemen in Tirunelveli City, India. Nat Environ Pollut Technol. 2012;11:515–7.
8. Tripathi SR, Tiwari RR. Self-reported hearing quality of traffic policemen: A questionnaire-based study. Indian J Occup Environ Med. 2006;10(2):82-4.
9. Ingle ST, Pachpande BG, Wagh ND, Attarde SB. Noise exposure and hearing loss among the traffic policemen working at busy streets of Jalgaon urban centre. Transp Res Part Transp Environ. 2005;10(1):69–75.
10. Prajapati P, Modi K, Rahul K, Shah A. A Study related to effects of job experience on health of traffic police personnel of Ahmedabad City, Gujarat, India. Int J Interdisciplinary Multidisiciplinary Studies. 2015;2(6):127-33.
Cite this article as: Mishra PK, Purushothama J.