Original Research Article
Patients’ satisfaction regarding facilities and services provided at
AYUSH clinics of primary health centres in rural Puducherry
Chithra Boovaragasamy, Seetharaman Narayanan*
INTRODUCTION
India‟s steps towards universal health coverage began in the early years after independence but they wavered because of various factors, including resource constraints. The context has vastly changed since then but the need remains as urgent as it always was.1,2 Inadequate health workforce is one such problem the country faces. To tackle this and owing to the increasing acceptance of the Indian Systems of Medicine (ISM), National Health Mission has introduced various strategies to mainstream AYUSH in health care system.3 AYUSH systems have been widely used for treating various ailments over centuries, even before the establishment of modern
Factors like local availability of drugs, perceived lack of side effects, cost effectiveness and the trust on traditional systems seem to have a role in the increasing acceptance of alternate systems of medicine.4 The country has also been witnessing inclusive policies related to AYUSH related to alternate systems of medicine in health care.5 Further, the gaps in manpower and infrastructure are being bridged, and this has resulted in an improvement in the continuum of care.
Patient satisfaction related to healthcare services closely determines their compliance with the treatment and thus contributes to the positive influence on health. Improving patients' satisfaction could also pave way for improving
ABSTRACT
Background: Patient satisfaction is a crucial component of the health care system in today‟s competitive modern era.
There is a limited literature describing the patient satisfaction on AYUSH care and therefore this study was undertaken to assess the satisfaction about facilities, healthcare providers and treatment among the patients attending selected AYUSH-attached PHCs in rural Puducherry.
Methods: A facility based cross-sectional study was conducted among the patients who attended AYUSH clinics at 4
selected PHCs of Puducherry over a period of one year. Personal Interviews using semi-structured pretested proforma was conducted for capturing information on socio-demographic variables, satisfaction regarding the facilities and health care providers. Telephonic interviews were conducted two weeks after the centre-based personal interviews, to assess the patients‟ treatment satisfaction levels.
Results: Out of the 584 patients interviewed, 71.23% rated as very good/excellent their interaction with the healthcare
providers, with regards to satisfaction about the infrastructure facilities, the proportion rating very good/excellent ranged from 64.47% to 93.93% across the different AYUSH PHCs.
Conclusions: Overall satisfaction about the quality of services and treatment was good among the patients.
Keywords: AYUSH, Patients satisfaction, Primary health center
Department ofCommunity Medicine, Mahatma Gandhi Medical College and Research Institute, Puducherry, India
Received: 15 March 2019
Revised: 09 May 2019
Accepted: 10 May 2019
*Correspondence:
Dr. Seetharaman Narayanan, E-mail: [email protected]
Copyright: © the author(s), publisher and licensee Medip Academy. This is an open-access article distributed under
the terms of the Creative Commons Attribution Non-Commercial License, which permits unrestricted non-commercial use, distribution, and reproduction in any medium, provided the original work is properly cited.
satisfaction leads to major drift in both new and old patients, which is related to the sustainability of any healthcare facility, in the long run. While satisfaction needs to be included in the routine performance appraisal of any health system, this becomes even more crucial when the system is newly introduced or transformed.5 Although we have plenty of research studies on patient satisfaction related to Allopathic services, there is limited literature describing the patient satisfaction on AYUSH care. Hence this study was undertaken to assess the satisfaction about facilities, healthcare providers and treatment among the patients attending selected AYUSH-attached PHCs in rural Puducherry.
METHODS
Study design
A cross-sectional descriptive study was conducted among the patients attending AYUSH clinics of selected primary health centres in rural Puducherry. This study is a part of postgraduate dissertation exploring the morbidity profiles, health-seeking behaviours and perception of patients‟ satisfaction about the facilities and health care providers.
Study period
The data collection was carried over a period of one year from January 2017 to December 2017.
Study place
The study was conducted in 4 rural AYUSH-attached PHCs of Puducherry.
Study population
All patients who had attended the AYUSH clinics at the 4 selected rural PHCs of Puducherry for a period of a year.
Ethical approval
The study was approved by the Institutional Human Ethics Committee, Mahatma Gandhi Medical College & Research Institute, Puducherry. Prior to initiation of the study, necessary permissions were obtained from the Directorate of Indian Systems of Medicine, Puducherry.
Data variables and study tools
Data variables
Independent variables were the socio-demographic variables which include age, sex, education, socio-economic status, occupation, marital status and religion.
Dependent variables pertain to patient's satisfaction levels regarding health care providers, health centre's infrastructure and treatment received.
Study tools
A pre-tested, semi-structured questionnaire was used for capturing information on socio-demographic variables, health centre's infrastructure and treatment received from selected study participants. A standard PSQ (Patient Satisfaction Questionnaire) was adapted to collect information regarding satisfaction levels of healthcare providers.
Data collection procedure
About 10 interviews per visit for each of the 4 PHCs were conducted. 20 such visits to each PHC, spread throughout the year were made to cover a sample of 600 patients. 200 patients were interviewed in the Abishegapakkam PHC (Ayurveda), 200 patients in the Bahour PHC (Homeopathy) and 100 patients each in the Kirumampakkam and Thavalakuppam PHCs (Siddha). Simple random sampling using automated computer generated numbers was employed to determine the visit days for interview. Personal interviews using semi-structured pretested proforma were conducted for capturing information on socio-demographic variables, satisfaction regarding the facilities and health care providers. Telephonic interviews were conducted two weeks after the centre-based personal interviews, to assess the patients' satisfaction levels. Contact numbers and willingness to participate in the second interview were obtained during the earlier personal interview.
Data entry and data analysis
Data was single entered using EpiData Entry v3.1 and all the analyses were carried out using EpiData Analysis v2.2.2.182.44. Proportions were used to summarize categorical variables. Chi square test was used to compare proportions and p<0.05 was considered as statistically significant.
RESULTS
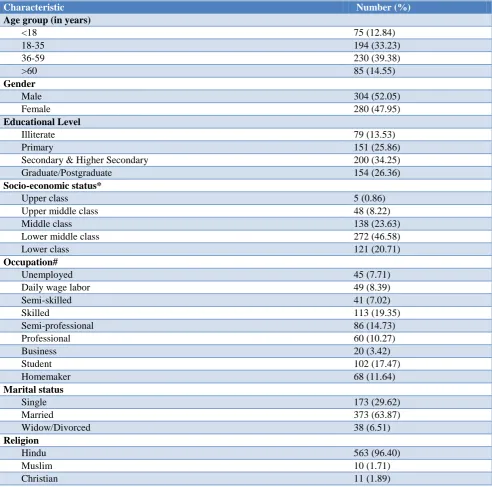
After data cleaning, 584 out of the 600 entries were considered for final analysis. Of the 584 patient-interviews analyzed, majority (39.39%) belonged to the age group of 36-59 years and more than half (52.05%) of them were males (Table 1).
Table 1: Age-sex distribution of the study population (n=584).
Age groups (years) Males Females Total
N (%) N (%) N (%)
<18 29 (9.54) 46 (16.43) 75 (12.84)
18-35 103 (33.88) 91 (32.50) 194 (33.22)
36-59 123 (40.46) 107 (38.21) 230 (39.39)
>60 49 (16.12) 36 (12.86) 85 (14.55)
Total 304 (52.05) 280 (47.95) 584 (100)
*The “Total” row depicts row percentages, others are column percentages.
Table 2: Socio-demographic characteristics of the study population (n=584).
Characteristic Number (%)
Age group (in years)
<18 75 (12.84)
18-35 194 (33.23)
36-59 230 (39.38)
>60 85 (14.55)
Gender
Male 304 (52.05)
Female 280 (47.95)
Educational Level
Illiterate 79 (13.53)
Primary 151 (25.86)
Secondary & Higher Secondary 200 (34.25)
Graduate/Postgraduate 154 (26.36)
Socio-economic status*
Upper class 5 (0.86)
Upper middle class 48 (8.22)
Middle class 138 (23.63)
Lower middle class 272 (46.58)
Lower class 121 (20.71)
Occupation#
Unemployed 45 (7.71)
Daily wage labor 49 (8.39)
Semi-skilled 41 (7.02)
Skilled 113 (19.35)
Semi-professional 86 (14.73)
Professional 60 (10.27)
Business 20 (3.42)
Student 102 (17.47)
Homemaker 68 (11.64)
Marital status
Single 173 (29.62)
Married 373 (63.87)
Widow/Divorced 38 (6.51)
Religion
Hindu 563 (96.40)
Muslim 10 (1.71)
Christian 11 (1.89)
Table 3: Satisfaction levels regarding healthcare providers (n=584).
Satisfaction regarding health care providers
Ayurveda N (%)
Siddha N (%)
Homeopathy N (%)
Total N (%)
Making you feel at ease…
(Being friendly & warm towards you, treating you with respect; not cold or abrupt)
Poor to fair 1 (0.57) 2 (1) 0 3 (0.51) Fair 3 (1.63) 0 8 (3.98) 11 (1.88) Good 64 (34.97) 55 (27.5) 36 (17.92) 155 (26.54) Very good 105 (57.37) 140 (70) 143 (71.14) 388 (66.44) Excellent 10 (5.46) 3 (1.5) 14 (6.96) 27 (4.63) Really listening…
(Paying close attention to what you were saying; not looking at the notes or computer as you were talking)
Poor to fair 0 2 (1) 0 2 (0.34) Fair 1 (0.54) 0 9 (4.47) 10 (1.71) Good 61 (33.33) 56 (28) 31 (15.42) 148 (25.34) Very good 109 (59.56) 139 (69.5) 147 (73.15) 395 (67.64) Excellent 12 (6.57) 3 (1.5) 14 (6.96) 29 (4.97) Being interested in you as a whole
person…
(Asking/knowing relevant details about your life, your situation; not treating you as “just a number”)
Poor to fair 0 2 (1) 0 2 (0.34) Fair 1 (0.54) 0 11 (5.47) 12 (2.05) Good 55 (30.05) 56 (28) 28 (13.94) 139 (23.80) Very good 116 (63.38) 139 (69.5) 148 (73.63) 403 (69.02) Excellent 11 (6.03) 3 (1.5) 14 (6.96) 28 (4.79) Fully understanding your
concerns…
(Communicating that he/she had accurately understood your concerns; not overlooking or dismissing anything)
Poor to fair 0 2 (1) 0 2 (0.34)
Fair 0 0 10 (4.97) 10 (1.71)
Good 57 (31.16) 56 (28) 32 (15.94) 145 (24.83) Very good 94 (51.36) 139 (69.5) 145 (72.13) 378 (64.73) Excellent 32 (17.48) 3 (1.5) 14 (6.96) 49 (8.39) Showing care and compassion…
(Seeming genuinely concerned, connecting with you on a human level; not being indifferent or „detached”)
Poor to fair 0 2 (1) 0 2 (0.34) Fair 1 (0.54) 0 9 (4.47) 10 (1.71) Good 58 (31.69) 56 (28) 34 (16.93) 148 (25.34) Very good 100 (54.64) 139 (69.5) 144 (71.64) 383 (65.59) Excellent 24 (13.13) 3 (1.5) 14 (6.96) 41 (7.02) Being positive…
(Having a positive approach and a positive attitude; being honest but not negative about your problems)
Poor to fair 0 2 (1) 0 2 (0.34) Fair 8 (4.37) 0 9 (4.47) 17 (2.91) Good 56 (30.60) 56 (28) 32 (15.94) 144 (24.66) Very good 93 (50.81) 139 (69.5) 146 (72.63) 378 (64.73) Excellent 26 (14.22) 3 (1.5) 14 (6.96) 43 (7.36) Explaining things clearly…
(Fully answering your questions, explaining clearly, giving you adequate information; not being vague)
Poor to fair 0 2 (1) 0 2 (0.34) Fair 1 (0.54) 0 11 (5.47) 12 (2.05) Good 72 (39.34) 56 (28) 30 (14.94) 158 (27.05) Very good 95 (51.93) 138 (69) 146 (72.63) 379 (64.89) Excellent 15 (8.19) 4 (2) 14 (6.96) 33 (5.67) Helping you to take control…
(Exploring with you what you can do to improve your health yourself; encouraging rather than
“lecturing” you)
Poor to fair 0 2 (1) 0 2 (0.34) Fair 1 (0.54) 0 11 (5.47) 12 (2.05) Good 74 (40.40) 56 (28) 33 (16.43) 163 (27.93) Very good 97 (53.05) 139 (69.5) 143 (71.14) 379 (64.89) Excellent 11 (6.01) 3 (1.5) 14 (6.96) 28 (4.79) Making a plan-of-action with
you…
(Discussing the options, involving you in decisions as much as you want to be involved; not ignoring your views)
Poor to fair 0 2 (1) 0 2 (0.34)
Fair 0 0 11 (5.47) 11 (1.88)
Good 72 (39.34) 56 (28) 34 (16.93) 162 (27.74) Very good 99 (54.09) 139 (69.5) 142 (70.64) 380 (65.07) Excellent 12 (6.57) 3 (1.5) 14 (6.96) 29 (4.97)
Overall, how would you rate your consultation with this doctor today?
Poor to fair 0 0 0 0 ()
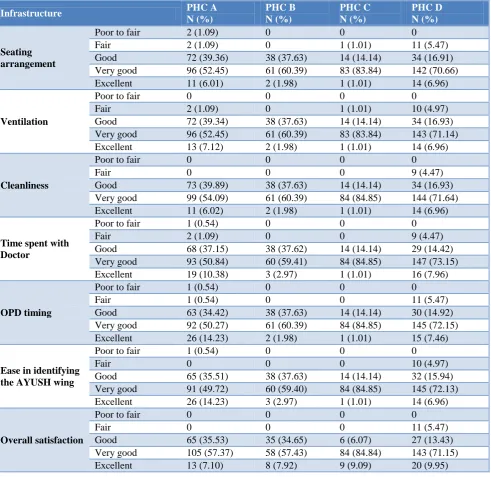
Table 4: Satisfaction regarding health centre’s infrastructure (n=584).
Infrastructure PHC A
N (%)
PHC B N (%)
PHC C N (%)
PHC D N (%)
Seating arrangement
Poor to fair 2 (1.09) 0 0 0
Fair 2 (1.09) 0 1 (1.01) 11 (5.47)
Good 72 (39.36) 38 (37.63) 14 (14.14) 34 (16.91) Very good 96 (52.45) 61 (60.39) 83 (83.84) 142 (70.66) Excellent 11 (6.01) 2 (1.98) 1 (1.01) 14 (6.96)
Ventilation
Poor to fair 0 0 0 0
Fair 2 (1.09) 0 1 (1.01) 10 (4.97)
Good 72 (39.34) 38 (37.63) 14 (14.14) 34 (16.93) Very good 96 (52.45) 61 (60.39) 83 (83.84) 143 (71.14) Excellent 13 (7.12) 2 (1.98) 1 (1.01) 14 (6.96)
Cleanliness
Poor to fair 0 0 0 0
Fair 0 0 0 9 (4.47)
Good 73 (39.89) 38 (37.63) 14 (14.14) 34 (16.93) Very good 99 (54.09) 61 (60.39) 84 (84.85) 144 (71.64) Excellent 11 (6.02) 2 (1.98) 1 (1.01) 14 (6.96)
Time spent with Doctor
Poor to fair 1 (0.54) 0 0 0
Fair 2 (1.09) 0 0 9 (4.47)
Good 68 (37.15) 38 (37.62) 14 (14.14) 29 (14.42) Very good 93 (50.84) 60 (59.41) 84 (84.85) 147 (73.15) Excellent 19 (10.38) 3 (2.97) 1 (1.01) 16 (7.96)
OPD timing
Poor to fair 1 (0.54) 0 0 0
Fair 1 (0.54) 0 0 11 (5.47)
Good 63 (34.42) 38 (37.63) 14 (14.14) 30 (14.92) Very good 92 (50.27) 61 (60.39) 84 (84.85) 145 (72.15) Excellent 26 (14.23) 2 (1.98) 1 (1.01) 15 (7.46)
Ease in identifying the AYUSH wing
Poor to fair 1 (0.54) 0 0 0
Fair 0 0 0 10 (4.97)
Good 65 (35.51) 38 (37.63) 14 (14.14) 32 (15.94) Very good 91 (49.72) 60 (59.40) 84 (84.85) 145 (72.13) Excellent 26 (14.23) 3 (2.97) 1 (1.01) 14 (6.96)
Overall satisfaction
Poor to fair 0 0 0 0
Fair 0 0 0 11 (5.47)
Good 65 (35.53) 35 (34.65) 6 (6.07) 27 (13.43) Very good 105 (57.37) 58 (57.43) 84 (84.84) 143 (71.15) Excellent 13 (7.10) 8 (7.92) 9 (9.09) 20 (9.95)
Table 5: Satisfaction regarding treatment received (n=584).
Satisfaction regarding treatment received
Ayurveda N (%)
Siddha N (%)
Homeopathy N (%)
Total N (%)
Improvement of illness
Poor to fair 2 (1.09) 6 (3) 4 (1.99) 12 (2.05)
Fair 0 19 (9.5) 9 (4.47) 28 (4.79)
Good 109 (59.56) 71 (35.5) 42 (20.89) 222 (38.01) Very good 66 (36.08) 90 (45) 132 (65.67) 288 (49.33) Excellent 6 (3.27) 14 (7) 14 (6.98) 34 (5.82)
Effectiveness in improvement
Satisfaction regarding treatment received
Ayurveda N (%)
Siddha N (%)
Homeopathy N (%)
Total N (%)
Ease of use of medication
Poor to fair 0 1 (0.5) 0 1 (0.17)
Fair 8 (4.37) 13 (6.5) 9 (4.47) 30 (5.14) Good 100 (54.64) 80 (40) 41 (20.39) 221 (37.84) Very good 65 (35.53) 94 (47) 133 (66.19) 292 (50) Excellent 10 (5.46) 12 (6) 18 (8.95) 40 (6.85)
Duration of treatment
Poor to fair 0 1 (0.5) 1 (0.49) 2 (0.34)
Fair 0 18 (9) 9 (4.47) 27 (4.62)
Good 104 (56.83) 93 (46.5) 42 (20.89) 239 (40.93) Very good 74 (40.44) 83 (41.5) 132 (65.67) 289 (49.49) Excellent 5 (2.73) 5 (2.5) 17 (8.48) 27 (4.62)
When asked to rate their satisfaction levels of various aspects of their interaction with doctors on a five-point Likert scale, the following proportion of patients rated as 'Very Good' - 66.44% for "approach by the doctor"; 67.64 for "listening and understanding the concerns"; 65.59% for "showing care and compassion"; 64.89% for "explaining clearly about diet and medications" (Table 3). With regards to the “Overall satisfaction” about the infrastructure facilities in these AYUSH clinics, the proportion of patients reporting "Very Good" ranged from 57.37% to 84.84% across the four different PHCs. The satisfaction levels for specific questions such as seating facilities, OPD timings are depicted in Table 4. More than three-fourth of the participants (93.16%) had reported improvement from "Good" to "Excellent" in their sufferings, across all the systems (Table 5). Patients' satisfaction on “ease of use of medication” and “duration of treatment” is also depicted in Table 5.
DISCUSSION
The current study attempted to measure the patients‟ satisfaction levels relating to the healthcare providers, the treatment received and Infrastructure facilities, using a five-point Likert scale (Tables 3-5). It must be remembered here that, for most of the questions regarding infrastructure facilities, the responses pertain to the whole PHC, not just the AYUSH wing in the PHCs. When attempting to compare with available literature, we find that although patient satisfaction have been studied in much at allopathic OPDs, literature on AYUSH centres is scant. Hence, we compared the patient satisfaction of the present study with that of allopathic facilities.
In the present study, majority of patients had “Ease in identifying the AYUSH wing” inside the PHCs (varying from 64% to 81% among the four PHCs studied). 94.7% of the patients had no difficulty in identifying the Siddha wing reported by Venkatachalam D et al, while the study conducted by Ranjeetakumari et al found that the satisfaction with the presence of signboards (46.6%) was found to be low.5,8
With regards to the “Facilities available at the hospital” (seating arrangements, ventilation facility and cleanliness), majority had felt that they were „very good‟ across the three systems - Homeopathy PHC (71.14%), Ayurveda PHC (57.37%) and Siddha PHCs (84.84% and 57.42%). Other studies in hospitals with in-patient facilities have reported that, 90% patients were dissatisfied with the seating arrangement and around 84% reported inadequacy of facilities like toilet, drinking water, seating arrangement in the dispensaries respectively.9,10
In the present study, most of the patients in the PHCs across the systems, had reported „very good‟ for the “Timings of OPD” and the “Time spent by the doctor”. In contrast to this, the study conducted by Bilkish et al reported that 20.9% had adequate time and detailed explanation given by the doctor.11
With regards to “Perceived Improvement of suffering”, overwhelming majority (97.95%) of the patients reported improvement in their illness. It must be stressed here that this reported "improvement" does not imply "cure" from the disease - but rather, merely a subjective feeling of improvement. Overall perception regarding the services was also very good. In the study done by Raghunath et al, it had been reported that 76% patients were satisfied with the treatment offered in the PHCs and the mean satisfaction was found to be 73.5%.7
The study has few strengths. First, the study which had comprehensive coverage of all three systems – Ayurveda, Siddha & Homeopathy clinics in rural PHCs. Second, the satisfaction-assessing part of the interviews were conducted two weeks later, over phone after their visit to health facility, which we hope, gave them the time and freedom to express their opinions freely - assessment about quality of services within the health centre premises would have created reporting bias. As, Use of convenient sampling for selecting the PHCS may limit the generalizability of the results.
specialized studies focusing on specific disease conditions or a specific aspect of the treatment. In conclusion, it may be said that if such high numbers of people are attending these AYUSH clinics, and seem to be satisfied with the services they are receiving, then AYUSH systems/ treatment are, at the least, worth researching further, if not worth respecting and promoting.
Funding: No funding sources Conflict of interest: None declared
Ethical approval: The study was approved by the Institutional Ethics Committee
REFERENCES
1. Sen G. Universal Health Coverage in India: A Long and Winding Road. Economic and Political Weekly. 2012;47(8).
2. Samal J. Role of AYUSH doctors in filling the gap of health workforce inequality in rural India with special reference to National Rural Health Mission: A situational analysis. Int J Adv Ayurveda Yoga Unani Siddha Homeopathy. 2013;2(1):83.
3. Mainstreaming AYUSH under NRHM. Available at: http://203.193.146.66/hfw/PDF/ayus.pdf. Accessed on 14 March 2019.
4. Homeopathic Anusandhan Parishad. Available at:
http://delhi.gov.in/wps/wcm/connect/doit-homeopathy/Homeopathy/Home/Clinical+Studies+ And+Publications/Cost+Effectiveness+in+P.H.C+U nit. Accessed on 14 March 2019.
5. Venkatachalam D, Selvaraj K, Ramaswamy G, Veerakumar A, Chinnakali P, Saya GK. Are patients satisfied with accessibility and services provided at siddha hospitals? Findings of patient satisfaction
survey from a district of South India. Int J Community Med Public Health 2018;5:2596-9. 6. Andaleeb SS. Service quality perceptions and
patient satisfaction: a study of hospitals in developing countries. Soc Sci Med. 2001;52(9):1359-70.
7. Raghunath E, Vijayalakshmi S, Sathagurunath PA. A study of outpatient satisfaction at primary health centres in Puducherry. The Health Agenda, 2013;1(4):118-121.
8. Kumari R, Idris M, Bhushan V, Khanna A, Agarwal M, Singh S. Study on patient satisfaction in the government allopathic health facilities of Lucknow district, India. Indian J Community Med. 2009;34(1):35.
9. Singh R. Patients‟ Perception towards Government Hospitals in Haryana. VSRD Technical Non technical J. 2010;1(4):198-206.
10. Chattopadhyay A, Saha T, Karmakar P, Sengupta P, Boral K, Yasmin S. Patient Satisfaction Evaluation in CGHS Dispensaries in Kolkata, India. IOSR J Dent Med Sci. 2013;6(4):13-9.
11. Patavegar Bilkish N, Shelke Sangita C, Prakash A, Kamble Manjunath S. A cross-sectional study of patient‟s satisfaction towards services received at tertiary care hospital on OPD basis. Natl J Community Med. 2012;3(2):232-7.
Cite this article as: Boovaragasamy C, Narayanan S.