_____________________________________________________________________________________________________
*Corresponding author: Email: [email protected];
4(2): 1-9, 2019; Article no.SAJSSE.50311 ISSN: 2581-821X
Performance of Mutual Funds and Mutual Fund
Manager in Pakistan
Syed Feroz Aziz
1*1Sui Southern Gas Company Limited (SSGCL), Pakistan.
Author’s contribution
The sole author designed, analysed, interpreted and prepared the manuscript.
Article Information
DOI: 10.9734/SAJSSE/2019/v4i230122
Editor(s):
(1) Dr. Alexandru Trifu, Professor, Faculty of Economics, “Petre Andrei” University of Iasi, Romania.
Reviewers:
(1) Olumide Adesina, Olabisi Onabanjo University, Nigeria. (2) Zimeras Stelios, University of the Aegean, Greece. Complete Peer review History:http://www.sdiarticle3.com/review-history/50311
Received 20 May 2019 Accepted 02 August 2019 Published 07 August 2019
ABSTRACT
Purpose: This study examined the performance of mutual fund and mutual fund manager in Pakistan during the period of Jul, 2006 to Jun, 2016. The objective is to found the funds’ performance through risk and return and ability to forecast the funds return by mutual fund manager.
Methodology/Design: The data will be used from the authentic source of SBP publication (State Bank of Pakistan) and MUFAP (Mutual fund association of Pakistan) of 54 mutual funds working in Pakistan. The data will be analyzed by using Statistical tests of Sharpe ratio, Sortino ratio, Treynor measure and Information ratio.
Results: Results indicated that fund returns are found positive and significant against risk free securities but funds return against the market return and fund manager ability to forecast fund returns is found negative and insignificant the rate of return of an investment made in mutual funds.
Originality/Value: Islamic funds and Sortino and Information ratio based on our knowledge have not been studied by the previous researchers.
1. INTRODUCTION
Mutual funds were introduced and established in Europe, according to a researcher this credit goes to a Dutch merchant, who had created the first mutual fund in 1774. Massachusetts Investors Trust was the first opened mutual fund with redeemable shares which established on 21st of March, 1924. It was the period of 80s and 90s when Mutual funds became familiar and successfully captured attention of Public and targeted very high investments and investors enjoyed maximum returns. Though that was the oldest idea, to pool the funds and invest in a managed manner. Progress of this investment vehicle can be seen from its beginning in 18th century in Netherlands and we can also observe the current growing status as international industry with holding funds of more than trillions only in USA. Regulatory authorities started to
regularize the inexperienced mutual fund
industry. The SECP (Stock Exchange
Commission of Pakistan) creation and the passage of Act 1933 and 1934 of the Securities Exchange Commission safely cautioned the investors.
1.1 Empirical Evidence of Mutual Funds
Bilawal [1] he has considered mutual funds as the greatest tool for mobilizing savings and investments in any economy. Fund managers have to choose diversified portfolios and must focus on less risky avenues, which of course
proceed the mutual funds to healthier
performance. Study found no uniformity in the performance of funds and mixed results were observed like Pakistan Industrial. Julio et al. [2] they examined the relation amongst performance of fund and attributes of fund in the Portuguese marketplace. One hundred and twenty bond funds, money market funds and equity funds were taken as sample population for the study for the period of 2004 to 2011. In the model panel data in which the independent variables were the fund attributes. Result of the study revealed that generally the Portuguese funds were unable to defeat the standards which were constant with
the existence of well-organized financial
marketplaces. Performance of fixed income mutual funds can be said excellent. Hussain [3], studied primary and secondary mutual fund marketplaces and find a complete difference behavior of both funds, one was that an IPO mutual fund investor earns more than 250% returns and on number two it was observed that secondary market investors are unable to
manage the opportunity cost of their investments. That market possessed some other abnor-malities as well which were different from all over the world, 99 % of the mutual funds. For the analysis various variables has been considered such as mutual funds return, turnover and Dhaka stock exchange general index return. Stationarity were examined by ADF-unit root test which resulted that variables were different in calculus.
1.2 Problem Statement
Mutual fund management is a domain of great concern. Although there were various studies conducted on this particular subject but there are still different aspects of the subject are need to be uncovered for awareness purpose of effective investments. Improper management of funds can discourage investments in different avenues of the economy, which no doubt may impact negatively on the financial, economic and human development growth of the country. A developing nation like Pakistan, where already facing so many problems cannot afford the situation like that. So it is very important to provide a strong corridor to Pakistan in the shape of mutual fund investment.
1.3 Objective of Study
To examine the risk and return of mutual funds in Pakistan.
To analyzed the ability of fund mangers’ for forecasting the mutual funds in Pakistan.
1.4 Significance of Study
There are numerous studies had been conducted in Pakistan for specific time period and analysed very smaller area of mutual funds include; equity funds, income funds, asset allocation and balanced funds. This study will be an addition in academia and will contribute in the literature in a way that some other avenues will also be statistically analyzed like; Aggressive Fixed Income, Index Tracker, funds of funds, Shariah
Compliant Equity and Shariah Compliant
Balanced Funds. It is observed that limited number of studies regarding Sortino and
Information ratios conducted in Pakistan.
2. LITERATURE REVIEW AND HYPOTHESIS DEVELOPMENT
2.1 Risk Free Securities & Mutual Funds
Ali and Qudous [4], studies the performance evaluation of funds mutual with perspective to Pakistan for the period of 2005 – 2009 in which researcher selected 15 mutual funds to evaluated Sharpe and Treynor ratio. Data is congregated from the different sources of KSE 100 index included official websites and yahoo finance, semiannual T-Bills risk free rate data collected from state bank of Pakistan and monthly closing prices were gathered from electronic data base of the Business Recorder. The standard deviation tool was employed and study resulted that overall performance of mutual funds is not acceptable in the context of Pakistan. Mahreen Mahmud et al. (2011), explored that the performance of mutual fund industries in case of Pakistan during the interval of 2006 to 2010. In which researcher categorized the market into; bullish and bearish market, which helps to examined Islamic funds were showed firm growth in spite of their bland comparison to conventional funds. Income funds as a result to underdeveloped bond market seem to be wretched and in the course higher t-bill rates have exhibited in antexcess returns Based on this literature review following alternative hypothesis has been developed.
H1: Mutual funds has better performance than risk free securities (T-bills)
2.2 Stock Return & Mutual Funds
Dahlguist et al. [5] they conducted study in the Swedish financial market between two funds the fund attribute and fund performance. For the analysis a linear regression was performed on number of benchmark assets on various time period. The various variables in funds attribute were considered such as turnover, flows, size, past performance, expense and trading activity. The results indicated that positive and good performance on small equity funds such as low fee funds, small equity fund and trading activity was high in other funds based on past performance. That was an exploratory research and was conducted for the first time. Raheel Gohar et al. [6] this review was directed to break down and look at the execution of mutual funds in various sorts in Pakistan, and reasoned that stock funds outflank income funds. These assets were further grouped keen representation
supporting and formal sponsored mutual funds for detail examination. Discoveries demonstrated the inside equity funds, representative supported
class indicates preferred execution over
institutional assets. Then again, the income funds, formal funds are outflanking intermediary supported funds. Facilitate, it was discovered experimentally that funds administrators can time their speculations in the market conditions, and has critical planning capacity. This review additionally reasons that mutual fund managers
have huge market timing capacity and
organizations funds directors can time their ventures, however specialists fund operated did not demonstrate advertise timing capacity. Alptekin [7] the performance of mutual funds in Turkey was conducted between two important variables mutual funds and pension stock. For the analysis TOPSIS tool was applied for concluding this study. Due to nature of both funds is same so, they can be comparing to each other. Both funds were evaluated with respect to return and risk associated with funds. There is significant impact had been found by using TOPSIS tool and due to this method results are reliable as compare to past. Based on this literature review following alternative hypothesis has been developed.
H2: Mutual funds has better performance than market return (Stock).
2.3 Mutual Fund Manager’s Ability & Mutual Funds
Keswani [8] he has conducted study which revealed that previously performed mutual funds was not a guarantee for upcoming earnings beside that investment aims can frequently be influenced by investors decisions. In this study researcher further explained that there are some
additional aspects that might affect the
performance of Balanced Mutual Fund. For example, Managers’ investment style, size of the
fund and possession nature of Asset
Management firms.
Clare et al. [9] Distinctive dataset of UK fund manager vary from 1997 to 2011, we inspected the effect of different variations on fund performance. Utilizing an exceptional database
from claiming UK reserve administrator
transforms again the period starting with 1997 with 2011, we inspected those effect about such progressions once fund execution. Authors can think that controllers if thusly attempt to
committed by funds manager organizations would illuminate every last bit from claiming their investors around a change for management.
Jagric et al. [10] they studied mutual fund industry and for the analysis various tests have been applied for evaluating performance capacity of mutual funds. The result of this study revealed that the performing capacity by both test Treynor and Sharpe are found same on diversified funds. Furthermore, studied funds outperformed are risk adjusted. Based on this literature review following alternative hypothesis has been developed.
H3: Fund manager has ability to forecast the fund return in Pakistan.
3. MATERIALS AND METHODS
3.1 Data
Secondary data of Stock price of PSX 100 index, Net Asset Value of Fifty-Four Mutual Funds and Rate of T-Bills from PSX Official website, MUFAP (Mutual funds association of Pakistan) and SBP Publications respectively. This study is based on monthly financial data for the period of July 2006 – June 2016 and gather data analysed through MS-Excel (2013) in this study.
3.2 Variables
3.2.1 Independent variables
Funds Return and Treasury Bills are considered the independent variables of the study. In which funds return are calculated in a form of net asset value the value of NAV’s that is taken from MUFAP website and the data is on monthly basis. And T-Bills is taken on quarterly basis the last reported value.
3.2.2 Dependent variables
Stock returns of PSX 100 Index is taken from Pakistan Stock Exchange, and fund performance variables depending upon the fund returns. They both taken as a dependent variable in the study.
3.3 Tools for Data Analysis
3.3.1 Sharpe ratio
This Sharpe ratio was developed by Nobel Laureate William Sharpe. This ratio is given for the earlier 36-month time frame by distributing a funds return on yearly basis excess returns over the risk-free rate by its annualized standard deviation. It is recalculated on a monthly basis.
Sharpe Ratio =
σ
Rp = the average fund return Rf = the average risk free return
σp = the standard deviation of fund return
This model is used to measure the performance of a managed portfolio in respect of return per unit of risk. The study computes of the ratio of the historical returns, (ex-post returns) in excess of the risk-free rate to the standard deviation of the portfolio returns of the funds for the period from 2006 to 2016.
This ratio will help out test the following alternative Hypotheses.
H1: Mutual funds has better performance than risk free securities (T-bills)
3.3.2 Sortino ratio
Downside deviation is a measure of downside risk that focuses on returns that fall below a minimum threshold or minimum acceptable return. It is used in the calculation of a risk measure known as the Sortino Ratio.
Sortino Ratio =Ř
Ř = the expected Return Rf = the average risk free return
σp = the standard deviation of negative funds return
Sortino ratio is best use of negative asset values risk and the higher Sortino ratio is better. The Sortino ratio is the asset’s excess rate of return (i.e., the difference between the asset's return and the risk-free rate), divided by the asset's downside deviation/risk.
This ratio will help out test the following alternative Hypotheses.
H1: Mutual funds has better performance than risk free securities (T-bills)
3.3.3 Treynor ratio
Treynor Measure =
β
Rp = the average fund return Rm = the average market return βp = Beta of the portfolio
Treynor introduced two types of risks. One risk is called Systematic risk which is associated with market and cannot be diversified away. However, this type of risk can by calculated through “beta”. Treynor says that portfolio expected return depend on its beta. The other type of risk which
he separated from systematic risk is
unsystematic risk. Unsystematic risk is specific to a company. The uncertainty attached with the specific company can be diversified away.
This ratio will help out test the following alternative Hypotheses.
H2: Mutual funds has better performance than market return (Stock)
3.3.4 Information test
This measure is a performance figure which puts the obtained α in perspective to its volatility. Thus, the IR corrects for the risk level and leverage chosen by a mutual fund manager, making it a performance measure which is better suited for a comparison of different mutual funds.
Information Measure =
σ
Rp = the average fund return
Ri = the average return of Index or Benchmark σ = standard deviation of return
This ratio is the average excess return per unit of volatility in excess return. It is simple puts the standard statistical formula for the mean and standard deviation. If Rp is the return on an active portfolio in given period and Ri is the benchmark portfolio or security.
This ratio will help out test the following alternative Hypotheses.
H3: Fund manager has ability to forecast the fund return in Pakistan
4. RESULTS AND DISCUSSION
4.1 Sharpe Ratio
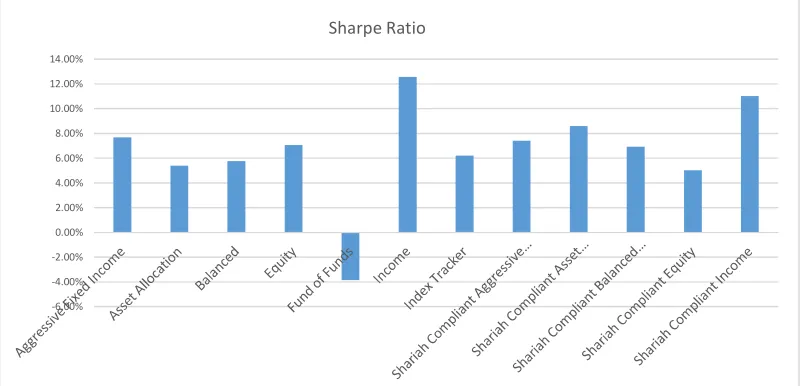
This Table 4.1 elaborates the Sharpe ratio of different mutual funds in percentage from Jul-2006 to Jun-2016. Overall it can be seen in Table 4.1 all mutual fund categories showed positive behavior in investment sector except fund of funds – 3.85%. Based on results the aggregate performance of all eleven categories are found positive and significant behavior for performing better against the risk free securities.
4.2 Sortino Ratio
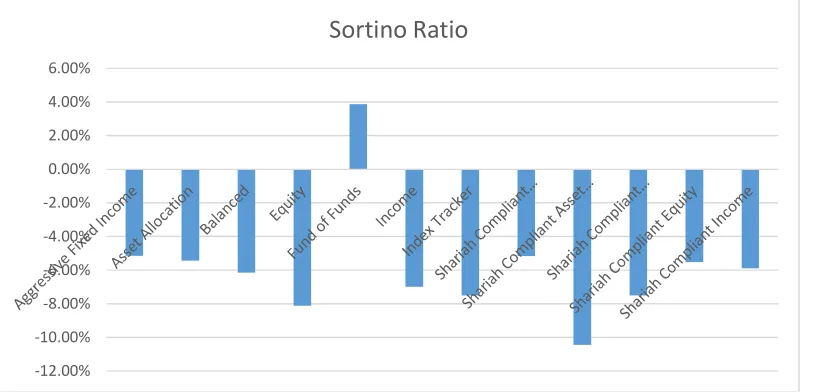
The Table 4.2 illustrated the Sortino ratio of twelve categories of mutual funds in proportions in percentages for 10 years’ data. Generally, Sortino ratio is negative asset return or downside deviation of all the funds deviation. It can be analyzed in Table 4.2 that overall deviation of mutual funds is adverse in which Shariah compliant Asset Allocation has highest value of -10.44% and lowest value is 3.86%.
Fig. 1. Sharpe ratio
-6.00% -4.00% -2.00% 0.00% 2.00% 4.00% 6.00% 8.00% 10.00% 12.00% 14.00%
Table 4.1. Sharpe ratio S #. Name of fund Sharpe
ratio
Rate of return
Hypotheses testing decision Rule (+ve = significant/ -ve = insignificant)
1 Aggressive Fixed Income 7.69% Positive Significant
2 Asset Allocation 5.41% Positive Significant
3 Balanced 5.76% Positive Significant
4 Equity 7.07% Positive Significant
5 Fund of Funds -3.85% Negative Insignificant
6 Income 12.56% Positive Significant
7 Index Tracker 6.21% Positive Significant
8 Shariah Compliant
Aggressive Fixed Income
7.42% Positive Significant
9 Shariah Compliant Asset
Allocation
8.61% Positive Significant
10 Shariah Compliant Balanced Fund 6.91% Positive Significant
11 Shariah Compliant Equity 5.02% Positive Significant
12 Shariah Compliant Income 11.03% Positive Significant
Source: Author’s Estimation
4.3 Treynor Ratio
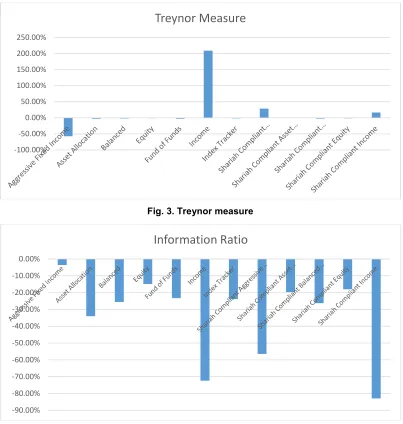
This Table 4.3 demonstrated the Treynor Measure of above categories of funds in form of percentages for recent 10 years. Treynor measure is the comparison between fund return with stock market returns. It evaluated in Table 4.3 in which Income fund category perform the highest percentage rate of 208.75% comparison with market returns but Aggressive Fixed Income, Asset Allocation, Balanced, Income, Fund of Funds and Shariah Complaint balance fund performance are not significant that showed in the Table 4.3.
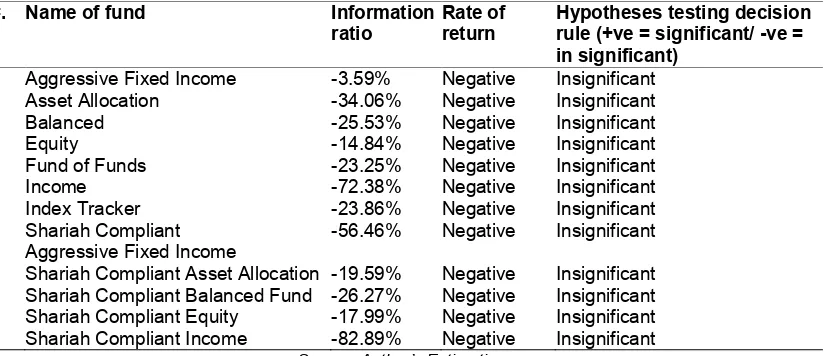
4.4 Information Ratio
This Table 4.4 shows the Information ratio of mutual funds in measurements in percentage for 10 years. Information ratio is to find the returns with the ability of fund managers to
forecast the fund returns. In the given chart above overall performance of forecasting is
not appropriate and that demonstrate due to rapid fluctuating positions of the market. The Shariah Compliant Aggressive Fixed Income got highest decreasing value of -56.46% and Aggressive Fixed Income has lowest value of -3.59%.
Fig. 2 Sortino ratio
-12.00% -10.00% -8.00% -6.00% -4.00% -2.00% 0.00% 2.00% 4.00% 6.00%
Table 4.2. Sortino ratio S #. Name of fund Sortino
ratio
Rate of return
Hypotheses testing decision rule (+ve = significant/ -ve = insignificant)
1 Aggressive Fixed Income -5.15% Negative Insignificant
2 Asset Allocation -5.43% Negative Insignificant
3 Balanced -6.14% Negative Insignificant
4 Equity -8.13% Negative Insignificant
5 Fund of Funds 3.86% Positive Significant
6 Income -6.99% Negative Insignificant
7 Index Tracker -7.50% Negative Insignificant
8 Shariah Compliant
Aggressive Fixed Income
-5.17% Negative Insignificant
9 Shariah Compliant Asset Allocation -10.44% Negative Insignificant
10 Shariah Compliant Balanced Fund -7.50% Negative Insignificant
11 Shariah Compliant Equity -5.51% Negative Insignificant
12 Shariah Compliant Income -5.89% Negative Insignificant
Source: Author’s Estimation
Table 4.3. Treynor ratio S #. Name of fund Treynor
measure
Rate of return
Hypotheses testing decision Rule (+ve = significant/ -ve = insignificant)
1 Aggressive Fixed Income -57.43% Negative Insignificant
2 Asset Allocation -2.75% Negative Insignificant
3 Balanced -2.04% Negative Insignificant
4 Equity -1.05% Negative Insignificant
5 Fund of Funds -2.98% Negative Insignificant
6 Income 208.75% Positive Significant
7 Index Tracker -1.64% Negative Insignificant
8 Shariah Compliant
Aggressive Fixed Income
28.52% Positive Significant
9 Shariah Compliant Asset Allocation -0.48% Negative Insignificant
10 Shariah Compliant Balanced Fund -2.34% Negative Insignificant
11 Shariah Compliant Equity -1.36% Negative Insignificant
12 Shariah Compliant Income 16.37% Positive Significant
Source: Author’s Estimation
Table 4.4. Information ratio S#. Name of fund Information
ratio
Rate of return
Hypotheses testing decision rule (+ve = significant/ -ve = in significant)
1 Aggressive Fixed Income -3.59% Negative Insignificant
2 Asset Allocation -34.06% Negative Insignificant
3 Balanced -25.53% Negative Insignificant
4 Equity -14.84% Negative Insignificant
5 Fund of Funds -23.25% Negative Insignificant
6 Income -72.38% Negative Insignificant
7 Index Tracker -23.86% Negative Insignificant
8 Shariah Compliant
Aggressive Fixed Income
-56.46% Negative Insignificant
9 Shariah Compliant Asset Allocation -19.59% Negative Insignificant
10 Shariah Compliant Balanced Fund -26.27% Negative Insignificant
11 Shariah Compliant Equity -17.99% Negative Insignificant
12 Shariah Compliant Income -82.89% Negative Insignificant
Fig. 3. Treynor measure
Fig. 4. Information ratio
5. CONCLUSION AND RECOMMENDA-TION
Main purpose of this study was to find the performance of mutual funds and mutual fund manager in Pakistan. Secondary data has been analyzed from July 2006 to June 2016 and for conclusion of this study the data has been used from official website of MUFAP (Mutual Fund Association of Pakistan), PSX (100 Index) and SBP (Publications).
Result of this study revealed that funds return against risk free security has shown positive behavior of eleven mutual fund categories except one Fund of Funds. This negative behavior
towards rate of return can be less or no investment made by financial institutes in the studied time frame from July 2006 to June 2016. Funds return is given better returns against the market returns has indicated nine funds have negative behavior except Income fund, Shariah Compliant Aggressive Fixed Income and Shariah Compliant Income Funds are found to have positive behavior against the market returns. Those nine funds whose negative behavior may be due to rapidly fluctuating stock market conditions and political instability in Pakistan. The last result of this study examined that Fund Manager able to forecast the funds return, a unique finding has been observed that fund managers are unable to forecast the funds return
-100.00% -50.00% 0.00% 50.00% 100.00% 150.00% 200.00% 250.00%
Treynor Measure
-90.00% -80.00% -70.00% -60.00% -50.00% -40.00% -30.00% -20.00% -10.00% 0.00%
in Pakistan for number of reasons such as: Qualifications, experience, age: According to study conducted by Basharat Hameed.
5.1 Recommendation
Financial institutes should be encouraged by policy makers for making investment in Funds of Fund category.
Effecting forecasting should be made by
stock exchange authorities for reducing risk of market shares for positive behaviour towards rate of return in future.
Qualified and experience fund manager
should be hired and trained for analysing and predicting acceptable fund returns.
5.2 Future Recommendations
This study can be extended in a
comparative analysis between a specific time period with respect to investment in mutual funds.
This study can be performed more than 10
years for better understanding mutual funds behaviour.
This study can be extended in a
comparative analysis between
neighbouring and south Asian countries for conforming the revealed results.
ACKNOWLEDGEMENTS
The author appreciate Dr. Prof. Hameedullah Kazi, Pro Vice-Chancellor, ISRA University for
his technical support regarding research
approach. And Ms. Humaira Jabeen, Senior Lecturer, ISRA University guide me and motivate me for completing my research. I acknowledged and appreciated them.
COMPETING INTERESTS
Author has declared that no competing interests exist.
REFERENCES
1. Bilawal M. Performance evaluation of
closed ended mutual funds in Pakistan. Int. J. Manag. Bus. Res. 2016;65-71.
2. Júlio Lobãob, Sofia Cruz Gomes.
Performance and characteristics of mutual funds: evidence from the Portuguese market; 2015.
3. Md. Shahadath Hossain AM. Dynamics of
mutual funds in relation to stock market: A vector autoregressive causality analysis. International; 2013.
4. Rida Ali, Rana Abdul Qudous.
Performance evaluation of mutual funds in
Pakistan. Interdisciplinary Journal of
Contemporary Research in Business; 2012.
5. Magnus Dahlguist, Stefan Engstrom, Paul
Soderlind. Performance and characteristics of swedish mutual funds. Journal of
Financial and Quantitative Analysis.
2000;409-423.
6. Raheel Gohar, Sohail Ahmed, Urfa Niazi.
Performance comparison of mutual funds in Pakistan. Performance comparison of mutual funds in Pakistan. 2011;5583-5593.
7. Alptekin N. Performance evaluation of
Turkish types a mutual funds and pension stock funds by using topic method. International journal of economics and finance; 2009.
8. MS. Sarika Keswani MS. Effect of fund
size on the performance of balanced mutual funds an empirical study in Indian context. ZENITH International Journal of Multidisciplinary Research; 2011.
9. Andrew Clare, Nick Motson, Svetlana
Sapuric, Natasa Todorovic. What impact does a change of fund manager have on mutual fund performance? The Centre for Asset Management Research; 2014. 10. Timotej Jagric, Boris Podobnik, Sebastjan
Strasek VJ. Risk-adjusted performance of
mutual funds. South-Eastern Europe
Journal of Economics. 2007;233-244.
© 2019 Aziz; This is an Open Access article distributed under the terms of the Creative Commons Attribution License (http://creativecommons.org/licenses/by/4.0), which permits unrestricted use, distribution, and reproduction in any medium, provided the original work is properly cited.
Peer-review history: