185 Volume 21, 2010
ANALYSIS OF THE RELATIONSHIP
BETWEEN DEMOCRACY AND
EDUCATION USING SELECTED
STATISTICAL METHODS
Ľubomír Zelenický
Constantine the Philosopher University, Nitra, Slovakia E-mail: [email protected]
Beáta Stehlíková
The Bratislava School of Law, Bratislava, Slovakia E-mail: [email protected]
Anna Tirpáková
Constantine the Philosopher University, Nitra, Slovakia E-mail: [email protected]
Abstract
Across the world, higher education leads to more democratic politics. The correlation between education and democracy is extremely. This idea has received a good deal of empirical support. Index of education in the newly associated states is due to compulsory schooling in the past higher than in the EU15.
To analyse the relationship between the Index of Democracy and the Index of Education we used the Pearson Correlation Coefficient. The Pearson Correlation Coefficient was calculated not only between the Education Index and the Democracy Index but also between the Education Index and particular sub-indices of the Democracy Index: Electoral Process and Pluralism, Civil Lib-erties, Functioning of Government, Political Participation and Political Culture. Moreover we calculated the Pearson Coefficient of Correlation for newly associated EU countries and for all EU countries. Later we analysed the relationship between Democracy Index and Education Index via new methods: The Moran Scatters Plots and Moran’s Coefficient of Spatial Autocorrelations were calculated. The geographic location and history are significant. Finally, the temporal spatial econometric model is constructed.
Key words: democracy index, education index, correlation coefficient, Moran Scatter Plot, mo-ran’s coefficient,spatial error model.
Introduction
Pa-Volume 21, 2010
186 paioannou and Siourounis, 2005, Zelenický, 2009). However, the theoretical reasons for this
relationship remain unexplored. In this paper, we investigate theoretically and explore em-pirically why list of stable democracies usually corresponds with countries with high levels of education and introduce Glaeser, Giacomo Ponzetto and Andrei Shleifer´s (2005) connec-tion between educaconnec-tion and political participaconnec-tion. This connecconnec-tion has been emphasized by Almond and Verba (1989, 1st ed. 1963) who see education as a crucial determinant of “civic culture” and participation in democratic politics. “The uneducated man or the man with lim
-ited education is a different political actor than the man who has achieved a higher level of education.“ (Verba, 1989).
The standard of living and the quality of life reach the highest levels in the most free and most democratic countries (Gola, 2009). The Economist regularly evaluates democratic conditions in 167 states on the basis of Democracy Index (Kekic, 2007).
Democracy Index is constructed as a combination of partial evaluations of following criteria:
1. Electoral process and pluralism 2. Civil liberties
3. Functioning of government 4. Political participation 5. Political culture.
Resultant Index can have values from 0 to 1. Countries with the highest level of de-mocracy reach values more than 0.9 of the Dede-mocracy Index range. According to reached values of the Democracy Index the countries are divided into following categories:
• Full democracies (scores of 8-10)
• Flawed democracies (scores of 6 to 7.9)
• Hybrid regimes (scores of 4 to 5.9)
• Authoritarian regimes (scores below 4)
The Human Development Index (HDI) is an index used to rank countries (nearly 200) by level of “human development” which usually also implies whether a country is developed, developing or underdeveloped. The United Nations publishes a Human Development Index every year which consists of the
• Education Index
• GDP Index
• Life Expectancy Index.
These three components measure the educational attainment, GDP per capita and life expectancy respectively. The Education Index is measured by the adult literacy rate (with two-thirds weighting) and the combined primary, secondary, and tertiary gross enrolment ra-tio (with one-third weighting). Resulting Educara-tion Index can reach values between 0 and 1. 1 is the highest possible theoretical score, indicating perfect education attainment. All coun-tries considered to be developed councoun-tries possess a minimum score of 0.8 or above, although the great majority has a score of 0.9 or above. World map indicating Education Index (2007) can be found at Wikipedia2.
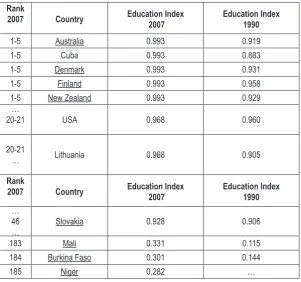
Table 1 lists countries with the highest and the lowest value of Education Index in 2007 (Human Development Report 20093), including Slovakia.
2 http://en.wikipedia.org/wiki/Education_Index
187 Volume 21, 2010 Table 1. Values of Education Index of selected countries in 2007.
Rank
2007 Country Education Index 2007 Education Index 1990
1-5 Australia 0.993 0.919
1-5 Cuba 0.993 0.883
1-5 Denmark 0.993 0.931
1-5 Finland 0.993 0.958
1-5 New Zealand 0.993 0.929
…
20-21 USA 0.968 0.960
20-21
… Lithuania 0.968 0.905
Rank
2007 Country Education Index 2007 Education Index 1990
… 46
… Slovakia 0.928 0.906
183 Mali 0.331 0.115
184 Burkina Faso 0.301 0.144
185 Niger 0.282 …
Source: http://hdr.undp.org/en/media/HDI_trends_components_2009_rev.xls.
Methodology of Research
To calculate the dependency rate between Democracy Index and Education Index in the EU member countries, we used the Pearson – Bravais Coefficient of Correlation which is defined as follows (Anděl, 2003):
r = ,
where
x
1,
x
2,...,
x
n are values of X andy
1,
y
2,...,
y
n are values of Y.Correlation Coefficient can reach values in the interval
-
1
,
1
. The Pearson Correla-tion is +1 in the case of a perfect positive (increasing) linear relaCorrela-tionship, −1 in the case of a perfect decreasing (negative) linear relationship, and any value between −1 and 1 in all other cases indicating the degree of linear dependence between the variables.Spatial autocorrelation means the degree to which a set of features tends to be clus-tered together (positive spatial autocorrelation) or be evenly dispersed (negative spatial auto-correlation) over the earth’s surface. Moran’s coefficient is a measure of the degree of spatial autocorrelation presented by the data.
(
)(
)
(
)
∑
(
)
∑
∑
= =
=
n
i i
n
i i
n
i i i
y
y
x
x
y
y
x
x
1 1
1
2
2
-Volume 21, 2010 188
Its formula is: ,
where
w
ij is the weight between observation i and j, andS
0 is the sum of allw
ij ´s. Quite not so intuitively, the expected value of I under the null hypothesis of no autocorrelation isnot equal to zero but given by 0
−
1
1
−
=
n
I
. The expected variance ofI
0 is also known, so wecan make a test of the null hypothesis. If the observed value of I (denoted
I
ˆ
) is significantly greater thanI
0, then values of x are positively autocorrelated, whereas ifI
ˆ
<I
0, this will indicate negative autocorrelation. This allows us to design one- or two-tailed.The significance of the Moran coefficient is tested using Monte Carlo Method (the number of permutations is 9999).
The Moran scatter plot provides a tool for visual exploration of spatial autocorrelation. Anselin (2002) describes Moran scatter plot as “the spatial lag of the variable on the vertical axis and the original variable on the horizontal axis” - the spatial lag refers to the values of a neighbours´ location. Spatial weights matrices are necessary elements in most regression models where a representation of spatial structure is needed. A traditional way to represent neighbour relationships is as a spatial weights matrix. It is an n x n matrix, with n being the number of states. There is a row and column for each country. The value in each cell repre-sents whether the location in the column header is a neighbour of the row location, termed “ego”. Cells with nonzero weights are considered the neighbours of that ego.
When data are spatially autocorrelated, the assumption that they are independently random is invalid; so many statistical techniques are also invalidated. Therefore, we used spatial error model (Ward, Gleditsch, 2008).
In the calculations we used the program Geoda4.
Results of Research
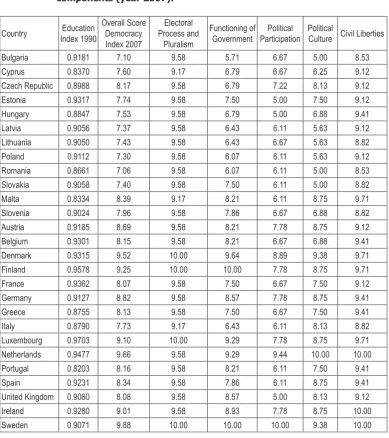
Following table (Table 2.) shows values of Education Index (1990) and Democracy Index (2007) and its individual sub-indices. Last available data of Democracy Index is from the year 2007. For our purposes we chose the Education Index measured in 1990, so as the level of education had enough time to “manifest“in the real life.
4 GeoDa is the collection of software tools designed to implement techniques for exploratory spatial data analysis (ESDA) on lattice data. It is intended to provide a user friendly and graphical interface to methods of descriptive spatial data analysis, such as autocorrelation statistics and indicators of spatial outliers. http://geodacenter.asu. edu/
∑
∑∑
= = =
−
−
−
=
ni i
n
i n
j ij i j
x
x
x
x
x
x
w
S
n
I
1
2
1 1
0
(
)
)
)(
189 Volume 21, 2010 Table 2. Education Index (year 1990) and Democracy Index and its
components (year 2007).
Country Index 1990Education Overall Score Democracy Index 2007
Electoral Process and
Pluralism
Functioning of
Government ParticipationPolitical Political Culture Civil Liberties
Bulgaria 0.9181 7.10 9.58 5.71 6.67 5.00 8.53
Cyprus 0.8370 7.60 9.17 6.79 6.67 6.25 9.12
Czech Republic 0.8988 8.17 9.58 6.79 7.22 8.13 9.12
Estonia 0.9317 7.74 9.58 7.50 5.00 7.50 9.12
Hungary 0.8847 7.53 9.58 6.79 5.00 6.88 9.41
Latvia 0.9056 7.37 9.58 6.43 6.11 5.63 9.12
Lithuania 0.9050 7.43 9.58 6.43 6.67 5.63 8.82
Poland 0.9112 7.30 9.58 6.07 6.11 5.63 9.12
Romania 0.8661 7.06 9.58 6.07 6.11 5.00 8.53
Slovakia 0.9058 7.40 9.58 7.50 6.11 5.00 8.82
Malta 0.8334 8.39 9.17 8.21 6.11 8.75 9.71
Slovenia 0.9024 7.96 9.58 7.86 6.67 6.88 8.82
Austria 0.9185 8.69 9.58 8.21 7.78 8.75 9.12
Belgium 0.9301 8.15 9.58 8.21 6.67 6.88 9.41
Denmark 0.9315 9.52 10.00 9.64 8.89 9.38 9.71
Finland 0.9578 9.25 10.00 10.00 7.78 8.75 9.71
France 0.9362 8.07 9.58 7.50 6.67 7.50 9.12
Germany 0.9127 8.82 9.58 8.57 7.78 8.75 9.41
Greece 0.8755 8.13 9.58 7.50 6.67 7.50 9.41
Italy 0.8790 7.73 9.17 6.43 6.11 8.13 8.82
Luxembourg 0.9703 9.10 10.00 9.29 7.78 8.75 9.71 Netherlands 0.9477 9.66 9.58 9.29 9.44 10.00 10.00
Portugal 0.8203 8.16 9.58 8.21 6.11 7.50 9.41
Spain 0.9231 8.34 9.58 7.86 6.11 8.75 9.41
United Kingdom 0.9080 8.08 9.58 8.57 5.00 8.13 9.12
Ireland 0.9280 9.01 9.58 8.93 7.78 8.75 10.00
Sweden 0.9071 9.88 10.00 10.00 10.00 9.38 10.00
Source: www.socrata.com/views/czuq-28j2/rows.xls?accessType=DOWNLOAd
Most of the Eastern Europe illustrates the difference between formal and substantive democracy. The new EU members from the region have relatively equal level of political freedom and civil liberties as the old developed EU but lag significantly in political participa-tion and political culture and reflecparticipa-tion of widespread anomaly and weaknesses of democratic development. Only two countries from the region - the Czech Republic and Slovenia - are in the full democracy category. Hybrid and authoritarian regimes dominate heavily in the coun-tries of the former Soviet Union, as the momentum towards «colour revolutions» has petered out, as it is noted in The Economist Intelligence Unit’s Index of Democracy 2007.
Volume 21, 2010 190
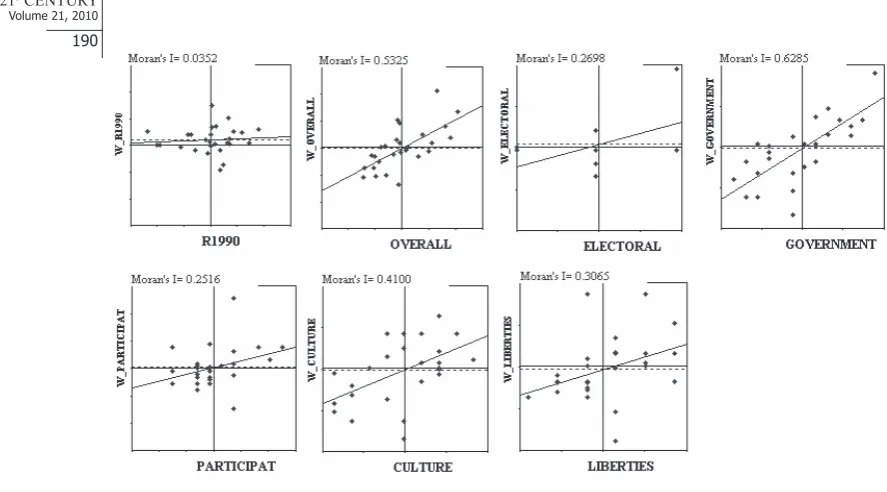
Source: Own drawings
Figure 1. The Moran scatters plots for Education index (1990), Overall Score In dex of Democracy (2007), Electoral Process and Pluralism, Functioning of Government, Political Participation, Political Culture and Civil Liber ties (2007).
Following table (Table 3.) lists values of Moran Coefficient and particular p values (9999 simulations).
Table 3. Results of testing of spatial autocorrelations.
Educa-tion Index 1990
Overall Score Democracy
Index 2007
Electoral Process and
Plural-ism
Functioning of
Govern-ment
Political
Participation Political Culture LibertiesCivil
Moran
Coef-ficient I 0.0352 0.5325 0.2698 0.6285 0.2516 0.4100 0.3065
p value 0.344 0.001 0.045 0.001 0.065 0.012 0.029
Source: Own calculations
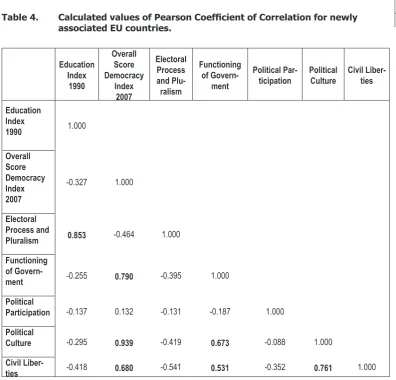
191 Volume 21, 2010 Table 4. Calculated values of Pearson Coefficient of Correlation for newly
associated EU countries.
Education Index
1990 Overall Score Democracy Index 2007 Electoral Process and Plu-ralism Functioning of Govern-ment Political
Par-ticipation Political Culture Civil Liber-ties
Education Index 1990 1.000 Overall Score Democracy Index 2007 -0.327 1.000 Electoral Process and
Pluralism 0.853 -0.464 1.000
Functioning of
Govern-ment -0.255 0.790 -0.395 1.000
Political
Participation -0.137 0.132 -0.131 -0.187 1.000
Political
Culture -0.295 0.939 -0.419 0.673 -0.088 1.000
Civil
Liber-ties -0.418 0.680 -0.541 0.531 -0.352 0.761 1.000
Note. Critical value of Pearson Coefficient of Correlation (with 10 degree freedom) for newly associated countries is 0.576 and for the whole EU (25 degree of freedom) it is 0.381.
Source: Own calculations
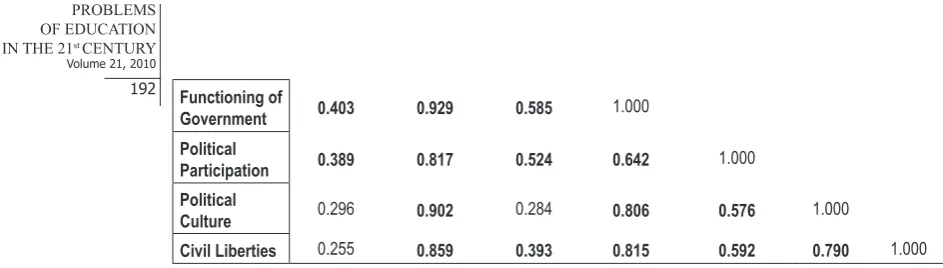
Table 5. Calculated values of Pearson Coefficient of Correlation for all EU countries.
Education Index
1990 Overall Score Democracy Index 2007 Electoral Process and Plural-ism Functioning of Govern-ment Political
Par-ticipation Political Culture LibertiesCivil
Education Index 1990 1.000 Overall Score Democracy Index 2007 0.418 1.000 Electoral Process and
Volume 21, 2010
192 Functioning of
Government 0.403 0.929 0.585 1.000
Political
Participation 0.389 0.817 0.524 0.642 1.000
Political
Culture 0.296 0.902 0.284 0.806 0.576 1.000
Civil Liberties 0.255 0.859 0.393 0.815 0.592 0.790 1.000
Note. Critical value of Pearson Coefficient of Correlation (with 10 degree freedom) for newly associated countries is 0.576 and for the whole EU (25 degree of freedom) it is 0.381.
Source: Own calculations
The assumption that the variables in regression model are independently random is invalid. For that reason we chose the spatial error model (Figure 2). EU 15 affiliation was chosen as a dummy variable because of the fact that in newly associated states there was a compulsory school attendance. Democracy Index (y) depends on the affiliation to EU 15 (x1) and on the Education Index in1990 (x2) as follows:
y = 0,8532729x1+ 9,157863x2 + u . (0.3050239) (0.3474758) u = 0,7748838Wu + ε. (0.08100591)
By using the spatial error model we can see that all coefficients are statistically signifi-cant (column Probability – Figure 2.). Coefficient of Determination is 53.76 percent. Value of Akaike Criterion equals to 46.5115. Parameter of spatial error
l
is 0.77488 and is statistically significant (P = 0.0016995). Model does not show any heteroskedasticity (P = 0.5387119).193 Volume 21, 2010 Discussion
On the basis of p values of Moran Coefficient we can say that for the Education Index 1990 there is no spatial autocorrelation. On the confidence level of 0, 1 there exists spatial autocorrelations for the Democracy Index and all its sub-indices. On the confidence level of 0, 05 there exists a spatial autocorrelation for Democracy Index and all its sub-indices except Political Participation
From results of Pearson Coefficient of Correlation we can conclude that in newly associated countries the Education Index is statistic-evidently dependent on the Electoral Process and Pluralism. No other correlation coefficients with the Education Index are statisti-cally significant. Democracy Index is statistic-evidently linear dependent on Functioning of Government, Political Culture and Civil Liberties. Democracy Index and Electoral Process and Pluralism do not show any statistical dependency.
In all EU countries as a whole all correlations coefficients are statistically significant except correlation coefficient between Education Index a Political Culture, eventually Civil Liberties and correlation coefficient between Political Culture and Electoral Process and Plu-ralism. That is the result of unstable political environment in newly associated states and compulsory school attendance of former socialist states. Moreover, the spatial autocorrela-tion between Democracy Index and its sub-indices exists. That means that for evaluaautocorrela-tion of dependency between Education Index and Index of Democracy it would be wise to choose more sophisticated statistical methods.
Conclusions
A common view clearly articulated by the modernization theory claims that high lev-els of schooling are both a prerequisite for democracy and a major cause of democratization. The evidence in favour of this view is largely based on cross-sectional or pooled cross-sec-tional regressions. This paper documents that this evidence is not robust to include fixed ef-fects and exploit the within-country variation. This strongly suggests that the cross-sectional relationship between education and democracy is driven by omitted factors influencing both: education and democracy rather than a causal relationship. This evidence asks some impor-tant questions about relationship between education and democracy.
We presented some old and some new facts about education and democracy. We showed that more educated democracies are more stable than the less educated ones; that higher education levels predict transition from dictatorship to democracy but not the other way around; and that the relationship between education and democracy holds within as well as across countries. The available evidence suggests that, consistent with Lipset (1959), edu-cation causes democracy.
Education leads to higher participation in a whole range of social activities, includ-ing politics. Accordinclud-ing to Edward L. Glaeser, Giacomo Ponzetto and Andrei Shleifer (2005) higher levels of education make democracy more stable because educated people face higher benefits of political participation and are consequently more likely to support democracy even when it offers few personal rewards. Conversely, in countries with low levels of educa-tion, dictatorship is more stable than democracy because only dictatorships offer the strong incentives needed to induce people to defend them.
Volume 21, 2010
194 References
Almond, G., Verba, S. (1989. 1st ed. 1963). The civic culture: Political attitudes and democracy in five na
-tions. London: Sage Publications.
Anselin, L. (1999). The future of spatial analysis in the social sciences. Geographic Information Sciences, 5, 67–76.
Anselin, L. (2002). Exploring Spatial Data with DynESDA2, CSISS and Spatial Analysis. Laboratory Uni
-versity of Illinois, Urbana-Champaign.
Baltagi. B., Song, S.H., Koh, W. (2000). Testing Panel Data Regression Models with Spatial Error
Autocor-relation. Working Paper. Dept. of Economics. Texas A&M University
Barro, R. J. (1999). The Determinants of Democracy. Journal of Political Economy, 107, 158–183
Coppedge, M. (April 2005). Defining and measuring democracy. Working paper. International Political Sci
-ence Association.
Dahl, R. A. (1970). Polyarchy. New Haven, Yale University Press.
Daron, A., Johnson, S., Robinson, J.A., Yared, P. (March 2005). Income and democracy. NBER Working Paper No. 11205.
Glaeser, E., LaPorta, R., Lopez-de-Silanes, F., Shleifer, A. (2004). Do institutions cause growth? Journal of Economic Growth, 9, 271-303.
Glaeser, E.L., Ponzetto, G., Shleifer, P. (2005). Why Does Democracy Need Education? Harvard University and NBER, Harvard University and Harvard University and NBER.
Gola, P. (10.6.2009). Najslobodnejšie krajiny sú najvyspelejšie.
http://www.finance.sk/spravy/finance/25143-najslobodnejsie-krajiny-su-najvyspelejsie/[cit: 2010-31-5]
Horowitz, I.L. (2006). The struggle for democracy. National Interest, spring.
Kekic, L. (2007). The Economist Intelligence Unit’s index of democracy. The World in 2007, Economist, http://www.economist.com/media/pdf/democracy_index_2007_v3.pdf[cit: 2010-31-5]
LeSage, J.P., Pace, R.K. (2005). Spatial and Spatiotemporal Econometrics. Volume 18 (Advances in Econo
-metrics)[Hardcover] JAI Press; 1 edition. ISBN-10: 0762311487
Lipset, S. M. (1959). Some Social Requisites for Democracy: Economic Development and Political Legiti-macy. American Political Science Review53: 69-105.
Papaioannou, E., Siourounis, G. (2005) Economic and social factors driving the third wave of democratiza
-tion. Mimeo, London Business School.
Przeworski, A., Alvarez, M., Cheibub, J.A., Limongi, F. (2000). Democracy and Development: Political
Institutions and material well-being in the world, 1950-1990. Cambridge University Press. New York NY.
Ribon, R., Dani. R. (2005). Rule of law democracy, openness, and income: estimating the interrelationships.
Economics of Transition, Vol. 13 (3).
The Economist Intelligence Unit’s Index of Democracy 2008 http://graphics.eiu.com/PDF/ Democracy%20Index%202008.pdf
195 Volume 21, 2010 Ward, M.D., Gleditsch, K.S. (2008). Spatial Regression Models (Quantitative Applications in the Social
Sci-ence. HA30.6.W37.
Zelenický, Ľ., Stehlíková, B., Tirpáková, A. (2009). The significance of human capital and its evaluation in
the EU countries. Materialy četvjortoj naučno-praktičeskoj konferencii. Tom 2. Filologija i drugije nauki.
113-118, Povolžskaja gosudarstvennaja sociaľno-gumanitarnaja akademija, Samara.
Zelenický, Ľ., Stehlíková, B., Tirpáková, A. (2009). Undergraduate education as a factor of the EU member states competitiveness. Problems of Education in the 21st Century, Vol. 12, 133–143.
The GeoDa Center for Geospatial Analysis and Computation. <http://geodacenter.asu.edu/> [cit:
2010-31-5].
Human Development Report 2009<http://hdr.undp.org/en/media/HDI_trends_components_2009_rev.xls.>
[cit: 2010-31-5]
Microsoft Excel- Democracy_Index [1]
<www.socrata.com/views/czuq-28j2/rows.xls?accessType=DOWNLOAd> [cit: 2010-21-5]
Education IndexAD-Wikipedia, the free encyclopedia
<http://en.wikipedia.org/wiki/Education_Index> [cit: 2010-24-5] HDI_trends_components_2009_rev
<http://hdr.undp.org/en/media/HDI_trends_components_2009_rev.xls>
[cit: 2010-21-5]
Adviced by Ondrej Šedivý, Constantine the Philosopher University, Nitra, Slovakia
Ľubomír Zelenicky
Prof. RNDr., CSc., Faculty of Natural Science, Constantine the Philosopher University, Trieda A. Hlinku 1, 949 74 Nitra, Slovakia. E-mail: [email protected]
Website: http://www.en.ukf.sk/
Beáta Stehlíkova Prof. RNDr., CSc., Faculty of economy and business, Bratislava School of Law, Tematínska 10, 851 05 Bratislava, Slovakia.
E-mail: [email protected]
Website: http://www.uninova.sk/pf_bvsp/src_angl/
Anna Tirpákova Prof. RNDr., CSc. Faculty of Natural Science, Constantine the Philosopher University, Trieda A. Hlinku 1, 949 74 Nitra, Slovakia.