Demand normally means the desire or willingness for a good but in economics simple desire or willingness for a good alone may not represent demand. Apart from the desire or willingness, consumer should be able to buy the good. Demand is therefore an effective desire thus desire and ability to buy are the key components of demand more specifically demand is defined us a schedule that shows the amount of product or service the consumer are willing and able to purchase at each price in a set of possible price during some specified time in a specified market. Consumers like to possess a particular commodity but without ability to pay, in which cases it is not demand. Apart from these, two more
Estimations of Catch Fish Demand Function of Consumers in Uttar
Pradesh
Anil Kumar Singh
1, S.P. Singh
2and D.V. Singh
31&3Department of Agricultural Economics and Management, SVPUA & T, Meerut, U.P. India 2Division of Agriculture Economics and Statistics, SKUASTJ, Jammu (J&K), India
Corresponding author: [email protected]
Abstract
This paper dealt with estimation of catch fish demand function in Uttar Pradesh. Demand functions desirable the relationship between the quantity demanded and the various factors affecting the demand. Demand is determined by many factors simultaneously yet in traditional demand curve, the quantity demanded of a product is assumed to depend solely on price of product. Consumer survey was conducted for estimation of demand function of fish species. The total amount of fish consumed per day in kg. price of different fish species, income of the consumer house hold were collected from the market. When the preference for fish will increase by 1 unit the quantity demanded for fish was increased by 0.16 units. The result justifies that when price of substitute good increase the demand for main commodity increases. The result was also in accordance to when price of fish will increase, the demand for fish will go down. Similarly the preference pattern for fish also follows the economic logic. The similar pattern as the linear demand function, the explanatory variable like income, price of mutton, price of fish and preference for fish were found significant. Interestingly, the estimated co-efficient of price of fish was estimated to be -0.39, indicating there by when price of fish was increased by 1% he quantity demanded for fish was decreased by 0.39 percent. For this reason the estimated co-efficient of C-D demand function with respect to prices of fish will be used in computation of economic surplus.
Keywords:Demand function, Household, Linear and Cob-Daglous function
requisites are essential, viz. time and market, for demand is likely to vary over time and also among the markets. The conditions hence imposed are a specific time and a specific market to measure the demand. The law of demand explains the functional relationship between the quantity demanded of a commodity and its unit price that is arise in the price of a commodity or service is followed by a reduction in the quantity demanded and a fall in the price is followed by an extension of demand, with other conditions remaining the same. Demand functions desirable the relationship between the quantity demanded and the various factors affecting the demand. Demand is determined by many factors
Paper No.: 274 Received: 14 January 2015 Accepted: 17 November 2015
Economic Affairs
simultaneously yet in traditional curve, the quantity demanded of a product is assumed to depend solely on price of product. In this limited sense, demand function is a down ward sloping curve in two dimensional price quantity spaces. Such a simplified depiction of demand function is interesting, informative and convenient. It can also be misleading. However, if one forgets, as said above, that host of other factors and prices influence the consumers demand for a particulars commodity. Some of the most important factors that affect the consumers income, consumer test, income distribution, total population, consumer wealth, credit availability etc. All these except the price of product in the two dimensional depiction are assumed to stay for the convenience of exposition. Specific objectives of the study are (i) to estimate linear fish demand function, (ii) to estimate non linear fish demand function and (iii) to estimate the effect of substitute commodity on fish demand function.
Akhter U. Ahmed, Yawar Shams (1992) worked on complete demand system for rural Bangladesh, applying the Almost Ideal Demand System (AIDS) model. The estimates of demand parameters are based on the primary data from the rural household survey. The sample may over represents the rural poor. The estimates of income elasticity of demand suggest that the rural household in general are highly responsive to change in the income in adjusting in their consumption patterns. Demand for commodities are also quite responsive to change in their own prices, with exception of salt. The estimates of cross price elasticities indicates the substitutes effects are strong and therefore, have important implication for price policies. Disaggregated by income group, the estimates of demand parameters of rice and wheat suggest that low income households are more price and income responsive high income household. Differences in elasticities in absolute values between two groups are quite striking. The estimates confirm with the finding of other studies that wheat is an inferior commodity in rural Bangladesh.This attributes makes wheat a self targeting commodity for targeted food intervention programmes. The study contains that government price interventions may lead to serious price repercussions in the economy. It contrast, income consumption for all normal commodities and thus a steady growth in the production by enhancing effective demand.
Richard Blundell, Panos Pashardes and Guglielmo Webert (1993) assessed the importance of using micro level data in the econometric analysis of consumer demand. Consumer demand pattern typically found in the micro- data sets vary considerably across household
with different house characteristics and with different level of income. We model this variability by making intercept and slope parameters in the budget share equation of our demand system depend on household characteristics and by allowing for non- linear total expenditure terms.
Shrivastavaet al. (1994) estimated the eagle function for fishing and non-fishing households separately for food items and non food items. In overall income elasticity of expenditure for fishing household was 0.4 and non-fishing households 0.3. It is mainly because of the fish farmers are belonging to lower income class characterized by a high population in family compare to non- fish farmers. This is absolutely according to theory consumption. It was also noted that elasticity for food items were of lower magnitude compare to non-food items.
Nayak, D. (1995) using discriminate function showed that marketing margins and the price paid by the consumers are the two important variables which discriminate significantly the price received by the fisherman at the land point.
Day Madan Mohan (2000) studied on analysis of fish consumption patterns and how they are likely to change as income and relative price changes is required to assess welfare impact of technological and policy change in the fisheries and aquaculture sectors. This analysis is based on the matrix of price and income elasticity of demand for fish by type as fish is a heterogeneous product and consumption pattern may differ by the type of product.
Database and Methodology
The total number of consumer 100 were identified for survey from different fish markets according to probability proportion to the size of sample population. The different fish markets were Daraganj, Teliarganj, Karolbag, Jushi, Salori and Katra. Mainly the consumer survey was conducted for estimation of demand function of fish. The total amount of fish consumed per day in Kg., price of different fish species, time of using (daily, weekly, monthly and other) and income of the consumer household were collected from the market. The price of substitute commodity as well as for different fish species, egg, mutton, chicken were also collected.
chicken, mutton and egg alone with preference pattern of consumer for substitute commodity as well as for different fish species was also collected. The estimation and specification of empirical model developed during course of study.
The fish demand function for consumer household was estimated using linear and Cob-Daglous type of function forms. The specification of model is given below:
Y = A = b1XI + b2X2 + b4x4 + B5x5 + B6D1 +
b7D2M + b8D3C + b9D4E + U
Y = AX
1b1X
2b2
X
3b3X
4b4X
5b5F
b6D1M
b7D2C
b8D3E
b9D4E
U Where,Y = Quantity of fish consumed per year (kg) X1 = Annual income of consumer house hold (`) X2 = Price of mutton (`/kg)
X3 = Price of chicken (`/kg) X4 = Price of egg (`/kg)
X5 = Average Price of fish (`/kg)
bis = co-efficient of variable
F, M, C and E are score relating to preference for fish, preference for mutton, preference for chicken and preference egg respectively. D1, D2, D3 and D4 are dummy variable for values for fish, mutton, chicken and egg respectively. Dummy variable values were 1 for present otherwise 0. The estimated co-efficient of the fish demand function will speak off about responsiveness of explanatory factor considered into model.
Results and Discussions
The linear and C-D type of demand function for the fish were specified as quantity of fish per month as regressed and the explanatory variables like income of the consumer, price of mutton, price of chicken, price of egg (substitute commodity), price of fish, preference for mutton, preference for chicken and preference for egg as regressor. The descriptive statistics of fish demand function is given in table 1.
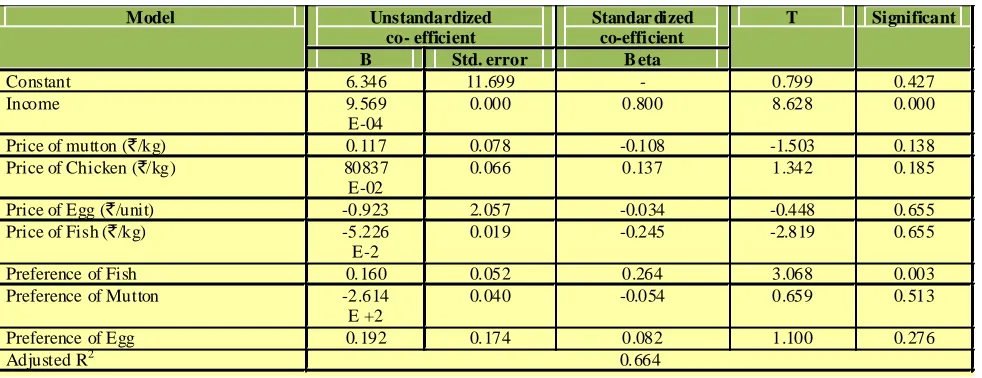
The magnitude of the quantity of fish consumed per month was 09.30 kg. The magnitude of explanatory variables were noted as income 8440 rupees, price of mutton rupees 114.70 per kg. price of chicken rupees 58.50 per kg, price of egg rupees 1.99 per unit, price of fish rupees 68.00 per kg. Preference for fish 24, preference for mutton 33, preference for chicken 29 and preference for egg 13. The estimated co-efficient of linear demand function are given in Table 2. The explanatory variable found significant were income, price of mutton, price of fish and preference for fish.
The value of co-efficient of income 9.57 E-04, price of mutton 0.12, price of fish -5.22 E-02 and preference for fish 0.16. The result obtained is absolutely in accordance with economic theory and logic. The co-efficient of income speaks that when quantity of income will be increased by 1 unit, the quantity demanded for fish will increase by 9.57 E-04. Further when price of mutton will increase by 1 unit the quantity demanded for fish will increase by 0.12.
Model Unstandardized
co- efficient
Standar dized co-efficient
T Significant
B Std. error B eta
Constant 6.346 11.699 - 0.799 0.427
Income 9.569
E-04
0.000 0.800 8.628 0.000
Price of mutton (`/kg) 0.117 0.078 -0.108 -1.503 0.138
Price of Chicken (`/kg) 80837
E-02
0.066 0.137 1.342 0.185
Price of Egg (`/unit) -0.923 2.057 -0.034 -0.448 0.655
Price of Fish (`/kg) -5.226
E-2
0.019 -0.245 -2.819 0.655
Preference of Fish 0.160 0.052 0.264 3.068 0.003
Preference of Mutton -2.614
E +2
0.040 -0.054 0.659 0.513
Preference of Egg 0.192 0.174 0.082 1.100 0.276
Adjusted R2 0.664
type of demand function was 0.74 which is higher than adjusted R2 in linear demand function (0.664). For this
reason the estimated co-efficient of C-D demand function with respect to prices of fish will be used in computation of economic surplus.
Fig. 1. Graphical representation of disruptive statistics of fish demand function
Conclusion
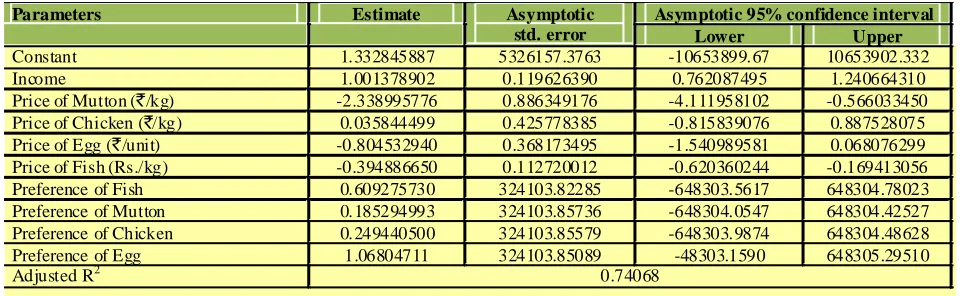
It is concluded that when the preference for fish will increase by 1 unit the quantity demanded for fish will increase by 0.16 units. The result justifies that when price of substitute good increase the demand for main commodity increases. The result is also in accordance to when price of fish will increase, the demand for fish will go down. Similarly the preference pattern for fish also follows the economic logic. The similar pattern as the linear demand function, the explanatory variable like income, price of mutton, price of fish and preference for fish were found significant. Interestingly, the estimated co efficient of price of fish was estimated to be -0.39 indicating there by when price of fish will increase by 1 percent the quantity demanded for fish will decrease by 0.39 percent. The adjusted R2 for C-D type of demand
Table 3: Estimated co-efficient of C-D type of demand function
Parameters Estimate Asymptotic
std. error
Asymptotic 95% confidence interval
Lower Upper
Constant 1.332845887 5326157.3763 -10653899.67 10653902.332
Income 1.001378902 0.119626390 0.762087495 1.240664310
Price of Mutton (`/kg) -2.338995776 0.886349176 -4.111958102 -0.566033450
Price of Chicken (`/kg) 0.035844499 0.425778385 -0.815839076 0.887528075
Price of Egg (`/unit) -0.804532940 0.368173495 -1.540989581 0.068076299
Price of Fish (Rs./kg) -0.394886650 0.112720012 -0.620360244 -0.169413056
Preference of Fish 0.609275730 324103.82285 -648303.5617 648304.78023
Preference of Mutton 0.185294993 324103.85736 -648304.0547 648304.42527
Preference of Chicken 0.249440500 324103.85579 -648303.9874 648304.48628
Preference of Egg 1.06804711 324103.85089 -48303.1590 648305.29510
Adjusted R2 0.74068
Table 1: Disruptive statistics of fish demand function
Particular Mean Std . Deviation
Quantity of fish per month (quintal) 9.30 6.79
Income 8440.00 5676.10
Price o Mutton (`/kg) 114.71 6026
Price of Chicken (`/kg) 58.50 10.50
Price of Egg (`/unit) 1.99 0.25
Price of Fish (`/kg) 68.19 31.78
Preference of fish 24.69 11.21
Preference of Mutton 33.14 13.94
Preference of Chicken 29.14 14.98
Preference of Egg 13.03 2.92
function was higher than adjusted R2 in linear demand
function. For this reason the estimated co-efficient of C-D demand function with respect to prices of fish will be used in computation of economic surplus.
References
Akhter, U. Ahmed and Yawar Shams, 1992. Demand elasticities in rural Bangladesh : An application of the AIDS Model.The Bangladesh Development Studies22(1).
Day Madan Mohan 2000. Analysis of demand for fish in Bangladesh. Acquoculture economics and Management. 41/
2,International Centre for living
Aquatic Resources Management (ICLARM).
Mohanty, B.P. and Vass, K.K. 1998. Biological markets in acquatic environmental monitoring programme. In changing proceeding national seminar on prospective of Inland fishers, pp. 99-100.
Srivastava, R.S. and Randhir 1995. Efficiency of fish marketing at Bhubaneshawr city of Orissa (India).
Bangladesh Journal of Agriculture Economics
28(1): 89-97.