bDepartment of Statistics, Rice University, Houston, TX, USA
cDepartment of Gynecology, The University of Texas M.D. Anderson Cancer Center, Houston, TX, USA
dBiomedical Engineering Center, The University of Texas M.D. Anderson Cancer Center, Houston, TX, USA
eThe Department of Gynecology, Obstetrics and Reproductive Sciences, The University of Texas Health Science
Center at Houston, Houston, TX, USA
fPerceptronix Medical Inc., Vancouver, BC, Canada
Received 13 October 2003 Accepted 4 March 2004
Abstract.Aims:Optical technologies have shown some promise for improving the care of cervical neoplasia. We are currently
evaluating fluorescence and reflectance spectroscopy and quantitative cyto-histopathology for cervical neoplasia screening and diagnosis. Here we describe the establishment and application of a quality assurance (QA) system for detecting system malfunc-tions and assessing the comparability of four image cytometers used in a multicenter clinical trial.
Methods:Our QA system involves three levels of evaluation based on the periodicity and complexity of the measurements. We implemented our QA system at three image cytometers at the British Columbia Cancer Agency and one at M.D. Anderson Cancer Center. The measurements or tasks were performed daily, monthly, and semi-annually. The current and voltage of the lamp, the calibration image characteristics, and the room temperature were checked daily. Long-term stability over time, short-term variability over time, and spatial response field uniformity were evaluated monthly. Camera linearity was measured semi-annually. Control charts based on statistical process control techniques were used to detect when the system did not perform optimally.
Results:Daily measurements have shown good consistency in room temperature, lamp and calibration behaviour. Monthly measurements have shown small coefficients of variation between and within the four devices. There have been greater differences between sessions than within sessions. Comparability among the four systems is reasonably good. Semi-annual measurements have shown stable camera linearity. QA events were detected using the QA system. Multiple examples of event detection leading to correction of system malfunction are described in this report.
Conclusions:QA programs are critical for ensuring data integrity and therefore for the conduct of multicenter clinical trials. Keywords: Image cytometry, quality assurance, quality control, statistical process control, histopathology, quantitative, cytology, quantitative, technology assessment, cervical intraepithelial neoplasia, lesions, squamous intraepithelial
1Contract grant sponsor: National Cancer Institute, Program
Project Grant 3PO1-CA82710-04.
*Corresponding author: Dr Michele Follen, M.D. Anderson
Can-cer Center, 1515 Holcombe Blvd., Unit 193, Houston, TX 77030, USA. Tel.: +1 713 745 2564; Fax: +1 713 792 4856; E-mail: mfollen @mdanderson.org.
1. Introduction
The term “technology assessment” refers to the sys-tematic evaluation of established or emerging tech-nologies. Among the models of technology assessment that have been described, the Littenberg model [8,9]
102 D. Chiu et al. / Quality assurance of image cytometry
is well suited for the evaluation of emerging medical technologies. The model evaluates biologic plausibil-ity, technical feasibilplausibil-ity, clinical effectiveness or inter-mediate outcomes, patient outcomes, and societal out-comes. Biologic plausibility asks questions whether our current understanding of biology and pathology of the disease support the technology. Technical feasibil-ity questions whether, at the present level of assess-ment, we can safely deliver the target technology to the patient. Clinical effectiveness or intermediate ef-fect assess the efef-fectiveness of the technology in a rel-evant population. Patient outcomes assess whether the technology improves the patient’s health. Societal out-comes assess the cost and ethical implications of the technology.
Our current effort is to evaluate several optical technologies following the paradigm of Littenberg, including fluorescence and reflectance spectroscopy and quantitative cyto-histopathology as emerging tech-nologies for the diagnosis of cervical neoplasia. In the current phase of our program project, quantitative cyto-histopathology is being evaluated for technical feasi-bility. One aspect of technical feasibility is showing that several image cytometers can perform consistently and reliably in different clinical settings for prolonged periods of time. A separate publication describes the comparability of the trained personnel who operate the equipment [4].
In this study, we test the hypothesis that measure-ments from the image cytometers made for quality assurance with three devices in the British Columbia Cancer Agency (BCCA) and one device at The Uni-versity of Texas M.D. Anderson Cancer Center are comparable and reliable. These devices collect data from both cytological and histological cervical spec-imens collected in the program project. We have de-signed clinical trials for 800 diagnostic patients and 1000 screening patients; thus far, 1200 Papanicolaou smears and 2300 cervical biopsies have been reviewed by study pathologists. As part of the ongoing effort to further understand the biology of cervical neoplasia, 1200 histological and 1000 cytological specimens have undergone quantitative assessment. It is essential that a Quality Assurance (QA) system is in place to ensure a high level of reliability of the data collected. In this manuscript, we describe the establishment and appli-cation of our QA system, the comparability of the four image cytometers used in the trial, and how our QA system made possible adverse event detection, prob-lem identification, and probprob-lem solving.
2. Materials and methods
Our project is utilizes three image cytometry devices at British Columbia Cancer Agency and one at M.D. Anderson Cancer Center. A critical part of such a mul-ticenter clinical trial is the establishment and applica-tion of a QA system to ensure proper system perfor-mance and comparability across systems and sites.
Drawing on statistical process control (SPC), a tech-nique used in industry [2,13], we identified the criti-cal system parameters and determined the frequency with which they needed to be measured. Following, in part, the 1997 European Society for Analytical Cellu-lar Pathology (ESACP) Consensus Report Part II [7], we measured lamp performance, long-term repeatabil-ity, short-term repeatabilrepeatabil-ity, field uniformrepeatabil-ity, and sys-tem linearity. Our QA syssys-tem involves three levels of evaluation based on the periodicity and complexity of the measurements. The measurements or tasks were performed daily, monthly, and semi-annually. Daily, the current and voltage of the lamp, the calibration image characteristics, and the room temperature were checked; monthly, the long-term stability over time, short-term variability over time, and spatial response field uniformity were evaluated; and semi-annually, camera linearity was measured. Control charts based on SPC techniques were used to detect when the sys-tem did not perform correctly.
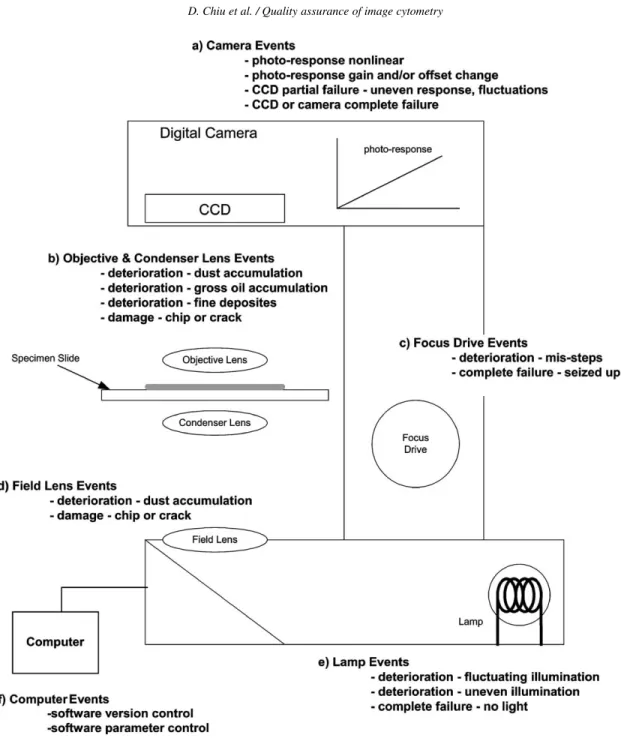
We identified the possible failure modes of the crit-ical device functions and components and developed procedures to make measurements that could detect the failure modes, as suggested by our group and oth-ers [1,5–7,11,14,15]. Table 1 shows how the various measurements are related to specific failure modes. Figure 1 shows a simplified diagram of the image cytometer, its critical components and functions, and their possible failure modes.
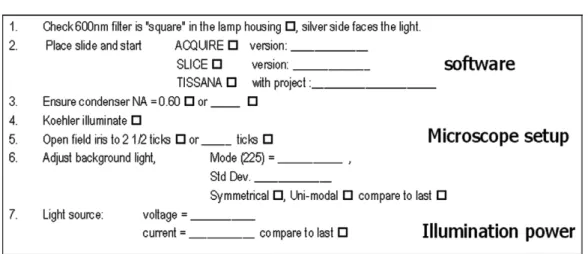
Daily, the operating parameters of the cytometer are recorded and compared as part of system set-up. The parameters included: (1) visual check of the in-terference filter, numerical aperture of the condenser, and setting of the field iris; (2) software version con-trol; (3) calibration image characteristics (mean, stan-dard deviation, intensity histogram symmetry, and uni-modality); and (4) illumination power (voltage and cur-rent). Figure 2 shows the daily QA checklist used. The Fig. 2 checklist is used to monitor whether the de-vice is configured correctly. The results are recorded by the cytotechnicians and compared to their historical records. The daily comparisons are based on “rules of
Measurements of the 20% transmissions vs. 60% transmission • Shift of the camera response offset • Shift of the camera response gain
• Camera photo-response change, nonlinearity Semi-annual Photo-response curve • CCD partial failure
• Camera photo-response change • Camera photo-response non-linearity
thumb” rather than formal statistics to permit the user to quickly detect gross changes in the system.
The monthly QA session involves measuring the in-tegrated optical density (IOD) and area of the fields of circles on a standardized PRESS-PRO21 slide, which is described in detail below and illustrated in Appendix. We selected optical transmissions of 20% and 60% to cover the range of the photometric re-sponse of the cytometers. Three repeated measure-ments of 42 circles from each of the two transmissions are made. In the QA session, first, the daily procedure is performed to ensure the cytometer is correctly con-figured. If problems are discovered during the daily procedure, the system is adjusted before proceeding to the monthly measurements. Then, the set of fields of circles of 20% transmission are positioned under the optical path of the cytometer. The scene is manually focused. A thresholding algorithm is used to separate the fields from the background based on pixel inten-sity; 42 fields are manually selected for analysis. Auto-focusing and edge relocation algorithms are applied to each field to precisely and automatically place the edge of the object along the contour of highest local gray-level gradient [13]. The digital gray-gray-level images of these fields are stored in the gallery. This process is repeated three times. To eliminate sampling variation, the same 42 fields at the two transmissions are imaged all three times. After the three repeated acquisitions of the 20% targets are complete, the process is repeated for the 60% targets. The monthly QA session is sum-marized in Fig. 3.
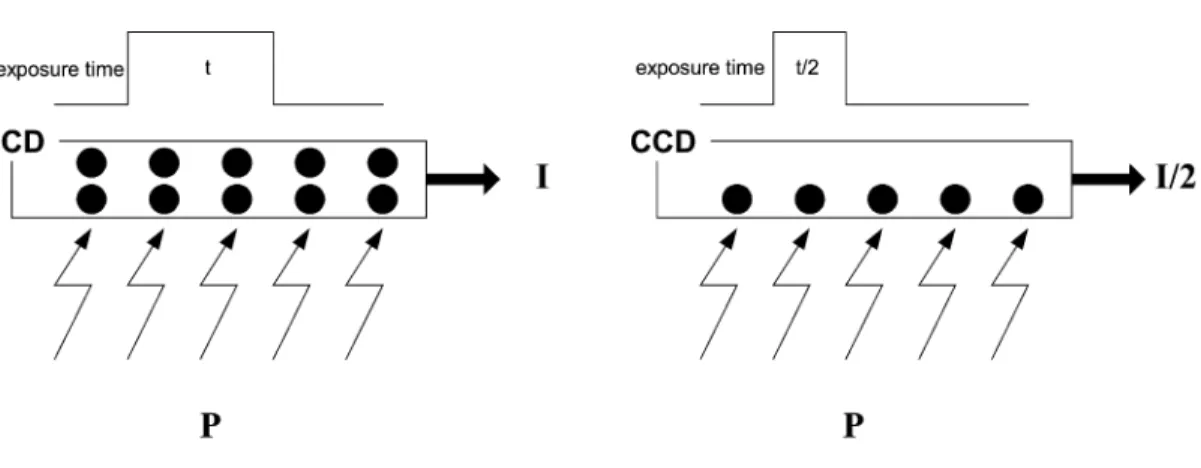
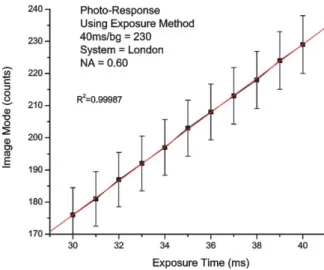
Semi-annually, a full linearity assessment of the sys-tem is performed by measuring the photo-response (see Fig. 4 for details of how this is performed and Fig. 6 for results). This is implemented by measur-ing the camera response at different exposure times. A highly accurate digital clock controls the exposure time in the digital cameras. If the camera is linear, the measured intensity should be proportional to the expo-sure time. The expoexpo-sure feature of the Xillix MicroIm-ager 1400 was used to measure its linearity.
A presentation was given to the staff to inform them of the general ideas and goals of the QA system. They were then trained to perform the QA system tasks. In total, 10 people were trained.
2.1. Slide description
Following the results of the PRESS Project [11,12], the ESACP created a standardized reference slide for quantitative evaluation and calibration of image cy-tometers. This reference slide (the PRESS-PRO21slide) contains three main patterned strips: (1) dark circles and squares on a bright background, (2) bright circles and squares on a dark background, and (3) large trans-mission windows. Within all three strips, there are 11 transmission steps (100%, 90%, 80%, 70%, 60%, 50%, 40%, 30%, 20%, 10%, and 5%). Refer to Appendix for a detailed description. In our quality assurance system, we use only the dark circles on a bright background as they mimic quantitatively absorption stained cell nuclei.
104 D. Chiu et al. / Quality assurance of image cytometry
Fig. 1. The possible failure mode of the image cytometer. Listed are the most probable failures that can occur to the image cytometer.
To minimize the monthly workload, we decided to use only two transmissions (20% and 60%), which are relatively far apart and provide IOD’s similar to those measured in nuclei of cells. The IOD of the 20% circles are similar to abnormal nuclei. The IOD of the 60% circles are close to the normal nuclei.
Based on previous experience with charged cou-pled device cameras and linearity measurements, we have determined that the cameras maintain linearity,
but their gain and offset can vary with time. Therefore, by measuring two transmissions, it is also possible to differentiate between offset and gain failure. This min-imizes the workload by not requiring measurements over the entire photo-response.
Because the four cytometers are located in two different cities (Vancouver and Houston), two differ-ent PRESS-PRO21 slides, one at each site, are used. A third slide was also used at BCCA after the
origi-Fig. 2. Daily QA: sample daily system set-up checklist. This checklist is used to ensure that the software, microscope, and illumination power are set-up correctly.
nal was damaged. There are important issues related to slide reproducibility that will be discussed in the Re-sults section.
2.2. Image analysis
Image analysis is performed using a modified ver-sion of the CytoSavant automated quantitative sys-tem (Oncometrics Imaging Corp., Richmond, British Columbia, Canada). This system uses a 12-bit double-correlated sampling MicroImager 1400 digital camera (pixels 6.8 µm2) placed in the primary image plane of the microscope. This software was designed for semiautomatic cellular analysis. The system was de-signed to measure thionin–Feulgen-stained nuclei with a monochromatic light at a wavelength of 600 nm (±5 nm) using a×20 0.75-NA Plan Apo objective lens (Omega Optical; Brattleboro, VT) [4,3,10].
2.3. Feature calculation
One hundred and three features are computed from the digitized images of each selected circle [3,13,14]. The IOD and area, which are two of these features, are used for the QA system.
2.4. Statistical analyses
The following description will focus on the analy-sis of the monthly data because it contains the most interesting information. At each transmission (20% and 60%) from each of the three acquisitions, fea-tures computed on a circle-by-circle basis are summa-rized by means and standard deviations to create the
measurement-level features. M_OD42 = 1 42× 42 1 IOD, S_OD42= 1 41× 42 1 (M_OD42−IOD)2, CV_OD42= S_OD42 M_OD42 × 100%, M_Area42= 1 42× 42 1 AREA, S_Area42= 1 41 × 42 1 (M_Area42−AREA)2, CV_Area42 = S_Area42 M_Area42 × 100%.
From these measurement-level features, means and standard deviations across the three repeat acquisitions are calculated to give session-level features.
M_ODR3= 1 3× 3 1 M_OD42, S_ODR3= 1 2 × 3 1 (M_ODR3−M_OD42)2, M_AreaR3= 1 3× 3 1 M_Area42,
106 D. Chiu et al. / Quality assurance of image cytometry
Fig. 3. Monthly QA: organization of the measurements for the monthly QA process. This illustration shows the three-tiered arrangement of the collected data. Each acquisition collects 42 circles that span the entire imaging area of the cytometer (a), which provides a measure of the (spatial) field uniformity. The acquisitions are repeated three times to provide a measure of the short-term (temporal) repeatability (b). The entire process is repeated every month to monitor the long-term (temporal) repeatability of the systems (c). Acquisitions are also made at two transmissions to provide some monitoring of the device’s photo-response.
Fig. 4. Semi-annual QA: procedure for measuring the photo-response of an image cytometry system with these steps, the linearity of the photo-response system is confirmed. The diagram shows how, with the same illumination power, the amount of light detected by the CCD can be controlled by the exposure time. There should be a linear relation between the detected light power and exposure time.
S_AreaR3= 1 2 × 3 1 (M_AreaR3−M_Area42)2, M_CVODR3= 1 3× 3 1 CV_OD42, S_CVODR3 = 1 2× 3 1 (M_CVODR3−CV_OD42)2, M_CVAreaR3= 1 3 × 3 1 CV_Area42, S_CVAreaR3 = 1/2×3 1 (M_CVAreaR3−CV_Area42)2.
The above calculations are performed on both the 20% and 60% transmission data and represent a set of monthly QA session data for one system.
In this paper, two approaches to the analysis of the monthly QA data are presented: control charts that have been used for in-process monitoring and post-process analysis that has been conducted on the entire data set to provide further insight into system perfor-mance.
In-process monitoring relies on control charts to identify “events”. Eight control charts are plotted for the monthly data for each system at each transmission:
X-bar charts of the means: M_ODR3, M_AreaR3,
M_CVODR3, M_CVAreaR3; and s-charts of the
standard deviation: S_ODR3,S_AreaR3,S_CVODR3,
S_CVAreaR3. This produces 64 charts for the four
sys-tems. The control line (CL), lower control limit (LCL), and upper control limit (UCL) are defined by a run-ning average. There are two reasons for using this ap-proach rather than the standard control chart method-ology [9,12]. First, there was no prior reference data to calculate the boundaries. Since these were monthly measurements, it would take too long to collect a re-liable reference data set of 10 to 25 months. Second, it became apparent after a few months that the within-session variance (based on three repeated scans) was not related to the between-session variance (based on
108 D. Chiu et al. / Quality assurance of image cytometry
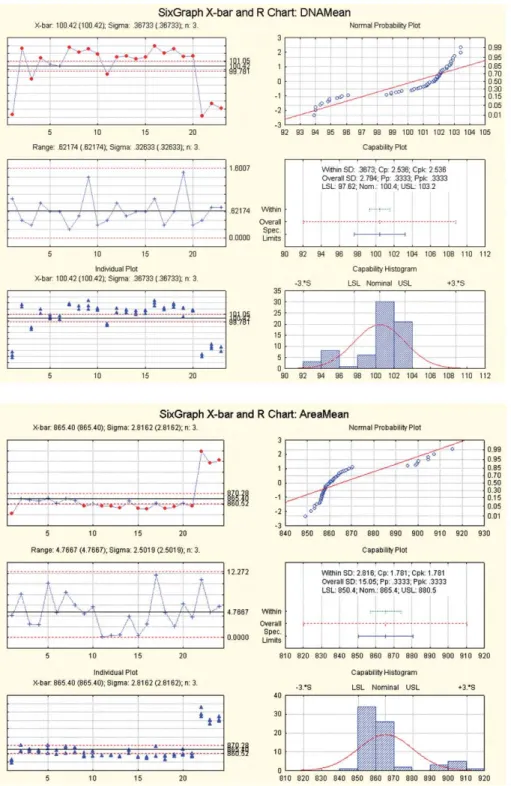
Fig. 5. Samples of the DNAMean and AREAMean data of 288 STATISTICA control charts created from the results of the monthly procedure for the OD and the AREA at the 20% and the 60% transmission of all four systems. These figures contain theX-bar chart,R-chart, individual plot, normal probability plot, capability plot, and the capability histograms.
Fig. 6. Semi-annual measurement of camera linearity using the photo-response exposure method. This figure shows the photo-response of one cytometer. The x-axis is the integration time in milliseconds. The y-axis is the statistical mode of the clear scene imaged by the camera. The curve shows a definite linear behavior as noted by the correlation coefficient.
monthly average measurements) in the assumed man-ner. That is, the standard formulas that relate these two variances did not apply. A prototype program based on the running average approach was written to plot and analyze these charts.
The post-process analysis of the monthly session data set presented here was implemented with the SPC component of the STATISTICA software package (StatSoft, Inc. Tulsa, OK). We plotted “mean”X-bar charts and “range” (R)-charts instead of the “standard deviation”s-charts used in the in-process analysis. The upper and lower control limits were based on statis-tics calculated from the overall sample. Additionally, S-PLUS (Insightful Corporation, Seattle, WA) was used to perform univariate and multivariate analyses. S-PLUS is used to perform a one-way Analysis of Vari-ance (ANOVA) to determine whether there was signifi-cantly more between-session variability than would be expected from the within session variability.
We also considered the use of a multivariate control chart, which incorporates four quantities (M_ODR3,
S_ODR3,M_AreaR3,S_AreaR3) in a single plot. The
rationale for this approach has been described [15]. A Mahalanobis distance is computed for each four-dimensional vector of observations from a session that measures the deviation from the mean across sessions “weighted” by the inverse of the covariance:
Mk=(xk−xbar)V−1(xk−xbar),
dexkruns from 1 ton. Here,x1kis thekth value of M_ODR3,x2k is thekth value ofS_ODR3, etc. The
usual multivariate control charts plot T2, which is a multiple of Mahalanobis distance.
3. Results
3.1. Establishment and application of the QA system
The QA system has been successfully implemented for all image cytometry systems at the BCCA and M.D. Anderson Cancer Center. Standard operating procedures have been specified, and the operators have been trained on their use. The QA system has been in use for over 22 months and continues to operate.
A checklist for the daily QA was created and re-sults are recorded and assessed by the users continu-ously (Fig. 2). The user records the calibration image coefficient of variation (CV) and the microscope lamp power and compares them to the previous days val-ues. To minimize time and effort, the data are recorded on paper and assessed manually. Data from the daily procedure of one system are summarized in Table 2. Little variation is seen in room temperature, calibration image coefficient of variation, lamp voltage, and lamp current in over 100 consecutive usage days. On three occasions, the results from daily procedure prompted the cytotechnician to seek assistance, which led to the discovery of “failures in progress” or events. These failures are explained in a later section.
For the monthly procedure (Fig. 3), the in-process analysis using control charts was helpful in detecting when a cytometer might not be working optimally. Events were flagged by the charts, which prompted the technician to look for possible faults. In some cases, the events were false alarms; in other cases, a failure mode was identified. Four true failures were detected. Further discussion is provided in a later section.
110 D. Chiu et al. / Quality assurance of image cytometry
Table 2
Summary statistics of the daily QA data of the M. D. Anderson system
Room temp. Calibration Calibration Lamp Lamp image std. dev. image CV voltage current
Mean 25.277 5.037 2.2654 4.3544 4.6465 N 101 102 101 102 102 Std. dev. 0.7708 0.2225 0.10036 0.03531 0.02428 Min 23.4 4.5 2.03 4.30 4.59 Max 27.4 5.6 2.50 4.46 4.69 Range 4.0 1.1 0.47 0.16 0.10 Variance 0.594 0.049 0.010 0.001 0.001 Table 3
Sample sizes (N), mean, CV within QC runs, and CV between QC runs forIODandAREAat 20% optical transmission targets
Machine N Monthly QA measurement (20% transmission)
IOD AREA
Mean CV- CV- p-value Mean CV- CV- p-value
within between within between
Gaz 54 411.1 0.32 1.08 0.0000 863.8 0.34 0.51 0.0000 London 48 394.4 0.18 1.13 0.0000 862.0 0.23 0.47 0.0000 Xtapa 57 391.0 0.16 0.82 0.0000 860.7 0.35 0.38 0.0005 MDA 51 388.1 0.22 0.80 0.0000 911.8 0.42 0.30 0.1571
Table 4
Sample sizes (N), mean, CV within QC runs, and CV between QC runs forIODandAREAat 60% optical transmission targets
Machine N Monthly QA measurement (60% transmission)
IOD AREA
Mean CV- CV- p-value Mean CV- CV- p-value
within between within between
Gaz 54 101.6 0.37 1.13 0.0000 822.7 0.37 0.49 0.0000 London 48 97.6 0.36 0.85 0.0000 822.1 0.43 0.53 0.0001 Xtapa 57 97.1 0.45 0.92 0.0000 816.6 0.64 0.58 0.0102
MDA 51 80.8 3.09 1.75 0.5189 839.0 0.37 0.38 0.0026
In the post-process analysis of the monthly data, which spans 16 to 19 months, STATISTICA was used to create 288 control charts of the IOD and AREA
at the 20% and 60% transmissions of the four sys-tems. Two samples of these charts are shown in Fig. 5. The sizes of the monthly data set vary because the QA system was implemented in a staggered fashion. We reviewed theX-bar chart,R-chart, individual plot, normal probability plot, capability plot, and capabil-ity histograms of the 288 charts. The majorcapabil-ity of the charts showed that the data are normally distributed, suggesting that the long-term behavior may be caused
by a gaussian distribution. In most cases, the within-session process variance is smaller than the between-session process variance. This difference is illustrated in Tables 3 and 4.
On a semiannual basis, the photo-response of the cy-tometer was measured (Fig. 6). The data was plotted, and the linearity was confirmed. These plots were com-pared to original plots made prior to the start of the QA system. The measurements showed that the systems’ linearity did not change over the measurement period. See Fig. 6 for the photo-response of one of the cytome-ters. All cytometers exhibited similar linear behavior.
calculated in the same manner. Note that most coeffi-cients of variation are all small – less than 2%.
The null hypotheses of the ANOVAs presented in Table 3 are that all the means within sessions are equal for a given device. Thepvalues show that in general there is statistically more variation between sessions than would be expected if the mean level were con-stant between sessions. Only two of the 16 p-values are greater than 0.05. Applying the multiple correc-tions procedure of Hochberg [12] shows that the 14
p-values below 0.05 remain significant even when we consider that there are 16 null hypotheses tested. We
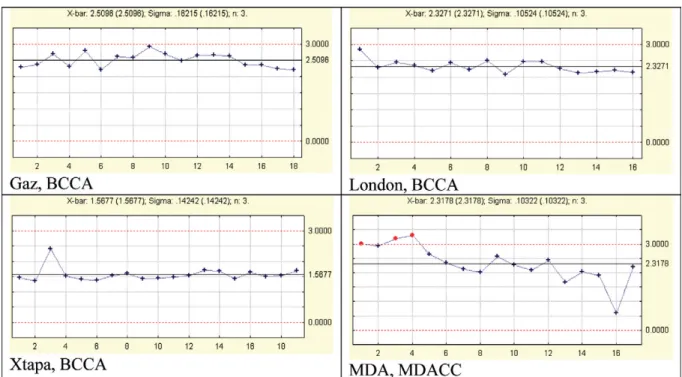
but it is within the error bars. The centerlines of two of the three BCCA systems, Xtapa and London, are very close, most likely because they have the same model of camera, optics, and microscope. On the other hand, Gaz uses a different microscope, which may ex-plain why its centerline is different from the other two BCCA systems. The component models of the M.D. Anderson Cancer Center system are the same as the BCCA Gaz system. M.D. Anderson Cancer Center does not appear to be very different. This may due to the fact that it was tested with a different refer-ence slide. The issue of slide reproducibility is
dis-Fig. 7. Means of the three repeated means of the IOD of the 42 circles (M_ODR3). This illustration shows theX-bar charts of theM_ODR3for
the 20% transmission areas for the four systems. These charts show the long-term stability and the equivalency of the systems. The centerline of each chart represents the mean of theM_ODR3values of the respective system.
112 D. Chiu et al. / Quality assurance of image cytometry
Fig. 8. Ranges of the three repeated means of theIODof the 42 circles at 20% transmission. This illustration shows theR-charts of the range of the three repeated means of theIODof the 42 circles for the 20% transmission areas for the four systems. TheR-charts for this feature show the short-term acquisition repeatability. A small range indicates that the three repeated measures differ little; therefore, measurements can be made reliably over a short period of time. These charts reveal some events that required investigation.
cussed below. These graphs indicate that the devices are stable, consistent, and reliable over a long period of time.
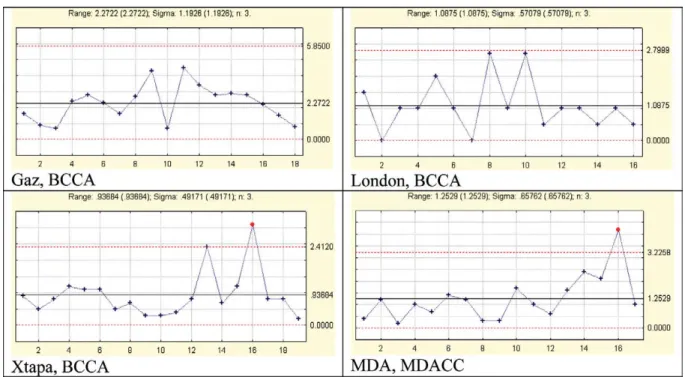
Figure 8 shows the R-charts of the M_ODR3 for
the 20% transmission areas of the four systems. The
R-charts provide an indication of the short-term peatability. A small range indicates that the three re-peated measures differ little. These charts reveal some events that required investigation: one on Xtapa and one on M.D. Anderson Cancer Center. The resolution of these events is discussed below. Comparing the four centerlines shows that the mean range of the Gaz sys-tem is considerably larger than the other three. This may indicate a greater degree of mechanical wear in the focus mechanism of Gaz than the other three sys-tems.
Figure 9 shows X-bar charts of the M_CVODR3
for the 20% transmission targets for the four systems. This is a measurement of field uniformity, a small value indicating that the field uniformity is good and measurements can be made reliably across a given slide. According to the 1997 ESACP consensus report on diagnostic DNA image cytometry, Part II Specific Recommendations for Quality Assurance [6], maxi-mum CV’s of 3% forIODand 2% forAREAare
rec-ommended. Therefore, the upper control limit of the charts in Fig. 9 has been set at 3%. For the M.D. Ander-son Cancer Center system, there were three occasions where the CV was higher than 3%. Small deposits on the objective and or condenser lens were the causes.
Tables 5 and 6 show the mean coefficient of vari-ation, the maximum coefficient of varivari-ation, and the number of times the acquisition was above accepted limits (an event occurred) at the 20% and 60% trans-mission, respectively. The mean IOD CV’s vary be-tween 1 and 3.5%, which is good. The CV’s forAREA
were all less that 2% at both 20% and 60% transmis-sion. Recall that this measurement involves imaging 42 different circles arranged in a grid pattern spanning the camera field. The reproducibility of the 42 circles will affect the value ofM_CVODR3. Another method
of measuringM_CVODR3is to image the same cell in
40 different locations across the camera field of view by manually moving the cell to these locations thereby eliminating target reproducibility error. This test has been conducted on the three systems at BCCA and producedIODCV’s less than 3% and Area CV’s less that 1%. Therefore, the discrepancy between the refer-ence slide method and the single-cell method may in-dicate a slide reproducibility issue.
Fig. 9. Mean of the three repeated CVs of the IOD of the 42 circles (M_CVODR3) at 20% transmission. This illustration shows theX-bar charts
of theM_CVODR3for the 20% transmission areas for the four systems. Because theM_CVODR3is a measure of the acquisition repeatability across the area imaged by the camera, a small value indicates that the field uniformity is good and measurements can be made reliably in space. An upper limit is set at 3% as recommended by the ESACP.
Table 5
Mean CV, max CV, and number of CV values above the accepted limits forIODandAREAat 20% optical transmission targets Machine Monthly QA measurement (20% transmission)
IOD AREA
Mean Max No. Mean Max No.
CV CV >3 CV CV >2
Gaz 2.51 3.42 1 0.70 1.09 0
London 2.33 2.91 0 0.78 0.97 0
Xtapa 1.57 2.50 0 0.82 1.53 0
MDA 2.32 3.48 9 0.91 1.15 0
Multivariate/Quality control considers all measure-ments simultaneously to provide greater power to de-tect anomalies that are not apparent in any single vari-able. The multivariate analog of theX-bar chart is the
T2 chart, which plots squared Mahalanobis distance from the overall mean. Control charts forX-bar and
T2are traditionally based on within-session variance and covariance. Because there is a greater between-session variability than would be indicated by the within-session variability, we cannot use the traditional approach for theT2chart, just as it was unusable for theX-bar charts. ForX-bar charts, our control limits were established at±3σ, whereσwas estimated by the standard deviation across sessions, and the centerline
Table 6
Mean CV, max CV, and number of CV values above the accepted limits forIODandAREAat 60% optical transmission targets Machine Monthly QA measurement (60% transmission)
IOD AREA
Mean Max No. Mean Max No.
CV CV >3 CV CV >2 Gaz 2.02 3.24 2 0.87 1.59 0 London 2.24 2.47 0 0.92 1.42 0 Xtapa 1.90 2.60 0 0.87 1.52 0 MDA 2.67 3.31 10 0.86 1.17 0 Table 7
CV values of the IOD and AREA of one HL60 cell measured at 40 locations spanning the entire camera field of view
Machine IOD AREA
Gaz 1.7% 0.4%
London 2.4% 0.5%
Xtapa 1.5% 0.4%
of the charts was established at the long-term mean of the per session results, excluding those sessions where it was determined that an event had occurred. For the multivariateT2charts, we used the fact that the Maha-lanobis distance computed from the population mean
114 D. Chiu et al. / Quality assurance of image cytometry
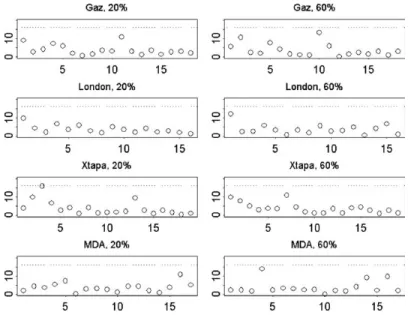
Fig. 10. Multivariate quality control charts. The vertical axis is the Mahalanobis distance from the mean computed for (M_ODR3,S_ODR3,
M_AreaR3,S_AreaR3), which is dimensionless. The horizontal axis is the observation or session number. The UCL of 16.25 appears as a
horizontal line in each plot. The plots are labeled by machine name and percentage transmission for the test circles.
and covariance has a chi-squared distribution with de-grees of freedom equal to the dimensionality of the vector of observations (4 degrees of freedom for our case). We chose a quantile of this chi-squared distri-bution to match the false alarm rate corresponding to
±3σfrom the population mean. This false alarm rate is 0.0027.
The T2 charts for each machine are shown in Fig. 10. Although we did not see any points in the mul-tivariate control chart that were out of control (recall that we have removed points that were found to be out of control from the univariate analyses), there was one point very close to the UCL: the third observation for Xtapa. Examination of the values for this day showed that the meanM_ODR3 of 381.7 for that session was
2.91 standard deviations below the long-term mean
M_ODR3 of 391.05, and the meanS_ODR3 of 9.24
was 3.6 standard deviations above the long-term mean ofS_ODR3, which was 6.13. Thus, although the point
was not determined to be out of control, its large value of Mahalanobis distance suggests that there could be a problem, and by examining the particular values of the four measurements, we find that the optical density measurements are of concern.
3.3. Event detection, problem identification, and false alarms
One of the principle goals of the QA system is to detect major problems in the image cytometers before
they impact data collection. Similarly, the impact of minor problems to data collection is minimized. Once an event is discovered, data acquisition is suspended until the event has been determined to be either a false alarm or a failure has been identified and rectified. The following are some examples of the events that were detected by the daily and monthly QA process.
There were three instances in which the daily process triggered events that were traced to real fail-ures. In two cases, the lamp power (voltage and cur-rent) had changed considerably from the previous days. In the third case, the CV of the calibration im-age was considerably higher than the historical value, which indicated a worsening of the illumination uni-formity. All three situations were traced to the degra-dation in the physical and electrical characteristics of the lamp filament. In these circumstances, it was desir-able to replace the lamps before they failed completely, thereby avoiding a possible systematic error caused by a slow degradation in lamp performance.
Comparing the daily lamp voltage and current val-ues also have indicated a situation where dust was oc-cluding the optics of the cytometer. The dust adher-ing to the optics blocked the transmission of the light; therefore, more lamp power was required to establish the initial imaging light level. This has provided a sign of when to clean the systems.
The monthly QA process has helped to detect more subtle events. A few particles of dust or very small
contrasted to the background. Any deposits will affect their IOD and edge segmentation thereby producing more drastic change inIODandAREAvalues.
A limitation of using an external reference was evi-dent when we had false alarms caused by improper and inadequate cleaning of the reference slide before mea-surements. If deposits such as watermarks were left over the targets, an event occurred in the control charts. Greater care in cleaning and handling the slide was im-plemented.
3.4. System re-qualification
At M.D. Anderson Cancer Center we were able to use the data collected from the daily and monthly pro-cedures to re-qualify the system after it was transferred between facilities.
3.5. Reference slide reproducibility
At BCCA, a second reference slide was employed, at which time we were able to measure the repro-ducibility between two slides. Using the same monthly procedure conducted on all three cytometers, the data from the second slide had a difference of approxi-mate 3% in the area at 20%T and 6% in the IOD at 60%T from the first slide. The last three points shown in bothX-bar charts of Fig. 5 are the measurements from the second slide. This difference between the two slides is clearly illustrated in DNA &AREA measure-ments in Fig. 5. The difference is consistent across all three systems indicating that it is an issue of slide re-producibility. Even though slide reproducibility affects the utility of the QA system, there are methods that can be employed to mitigate this shortcoming. Cross measurements of all reference slides by all cytometers would provide the data required to do a proper
cross-Quantitative cyto-histopathology is a valuable tool for use in the medical field because it can replace qualitative assessment with quantitative measurement. In the developed world, this technological improve-ment also represents a cost savings; for the develop-ing world, it may alleviate the problems stemmdevelop-ing from a shortage of trained personnel and a lack of resources. Like all emerging technologies, quantita-tive cyto-histopathology should be subjected to rig-orous technology assessment. Our successful imple-mentation of the QA process described here shows that multiple systems can function comparably and reliably at multiple sites, which is a prerequisite for establishing the technical feasibility of quantitative cyto-histopathology. The methodology proposed here is practical, and it requires only a little extra time and resources to provide significant assurance that the sys-tems are functioning at a high level.
Only 5 minutes per day of a cyto-histotechnician’s time is required to perform the daily QA session, 30 minutes of a cyto-histotechnician’s time for the data collection in the monthly QA session with an addi-tional 10 minutes to run the analysis software, and 30 minutes of an optical engineer’s time for the bian-nual QA session. Our QA process has resulted in sev-eral events that have led to the detection of problems but these problems have been corrected. This is a very small price to pay for the assurance that the systems are performing reliably and consistently for the success of a project involving multisite clinical trials.
There are two principle limitations with our pro-posed method. First, there are sources of variation that could indicate system malfunction that we are not mea-suring. The CytoSavant measures approximately 120 nuclear features of which only a few are directly cap-tured by our QA measurements on the standardized slide. Furthermore, there is clearly a variation between
116 D. Chiu et al. / Quality assurance of image cytometry
monthly QA sessions that exceed what would be pre-dicted from the variation within monthly QA sessions, which leaves open questions about the sources of that variation and its possible effect on the clinical func-tioning of the CytoSavant. The issue of variation be-tween operators has been discussed in a previous man-uscript [4].
The second limitation is that with our primary QA sessions being performed on a monthly basis, there is the possibility that a system can be malfunctioning for an entire month before being discovered, requiring the remeasurement of numerous specimens and possible delays or reversals in patient diagnoses. The monthly frequency was chosen for practical considerations, es-pecially of its application to a research project, but the frequency of major QA sessions should be reviewed if any routine clinical application is made of quantitative cyto-histopathology.
Some future work that can further improve the QA process, by providing greater efficiency and more de-tection power is under consideration. Incorporating au-tomatic collection and analysis of daily quality control data in the acquisition software is being considered, so that the system can issue an automatic warning if it is not working correctly. Plans are underway to develop more sophisticated hardware to automatically perform the monthly check. Automation of the monthly
proce-dure would permit it to be performed on a daily basis. We are considering using the EUROQUANT system developed by the EASCP, which provides “on line” ac-cess to QA on a daily basis [16].
Presently, the test slide provides reliable measure-ments of IOD and AREA. We and others are explor-ing the use of a more sophisticated slide that includes patterns mimicking nuclear texture. The assessment of the measurement of texture features would provide an-other level of quality assurance.
Acknowledgements
Special thanks go to the following individuals for their assistance and attention to detail in making the quality assurance system a success: Deanna Hask-ins, Jagoda Korbelik, Anita Carraro, Mark Cardeno, Tatiana Alexeenko, Maria-Teresa Arbelaez, Maria Valdizan-Garcia, Iouri Boiko, Nan Earle, and Trey Kell.
Appendix: The PRESS-PRO21 reference slide For quantitative evaluation and calibration of your image analyzer, see Fig. 11.
[5] G. Haroske, J.P.A. Baak, H. Danielsen, F. Giroud, A. Gschwendtner, M. Oberholzer, A. Reith, P. Spieler and A. Bocking, Fourth updated ESACP consensus report on diag-nostic DNA image cytometry,Analytical Image Cytometry23
(2001),Analytical Image Cytology89–95.
[6] G. Haroske, F. Giroud, A. Reith and A. Bocking, Part I. Basic considerations and recommendations for preparation, measure-ment, and interpretation. The 1997 ESCAP consensus report on diagnostic DNA image cytometry,Anal. Cell. Pathol.(1998). [7] G. Haroske, F. Giroud, A. Reith and A. Bocking, Part II.
Spe-cific recommendations for quality assurance. The 1997 ESCAP consensus report on diagnostic DNA image cytometry,Anal.
Cell. Pathol.17(1998), 201–208.
[14] M. Puech and F. Giroud, Standardization of DNA Quantifica-tion by Image Analysis,Cytometry27(1997), 21–25. [15] F.B.J.M. Thunnissent, I.r G. Ellis and U. Jutting,
Interlabora-toy comparison of DNA image analysis,Analytical Cellular
Pathology12(1996), 13–24.
[16] K. Kayser, S. Blum, M. Beyer, G. Haroske, D. Kunze and W. Meyer, Routine DNA cytometry of benign and malignant pleural effusions by means of the remote quantitation server Euroquant: a prospective study,J. Clin. Pathology53(2000), 760–764.
Submit your manuscripts at
http://www.hindawi.com
Stem Cells
International
Hindawi Publishing Corporation
http://www.hindawi.com Volume 2014
Hindawi Publishing Corporation
http://www.hindawi.com Volume 2014
MEDIATORS
INFLAMMATIONof
Hindawi Publishing Corporation
http://www.hindawi.com Volume 2014
Behavioural
Neurology
Endocrinology
International Journal ofHindawi Publishing Corporation
http://www.hindawi.com Volume 2014 Hindawi Publishing Corporation
http://www.hindawi.com Volume 2014
Disease Markers
Hindawi Publishing Corporation
http://www.hindawi.com Volume 2014 BioMed
Research International
Oncology
Journal ofHindawi Publishing Corporation
http://www.hindawi.com Volume 2014
Hindawi Publishing Corporation
http://www.hindawi.com Volume 2014
Oxidative Medicine and Cellular Longevity
Hindawi Publishing Corporation
http://www.hindawi.com Volume 2014
PPAR Research
The Scientific
World Journal
Hindawi Publishing Corporationhttp://www.hindawi.com Volume 2014
Immunology Research Hindawi Publishing Corporation
http://www.hindawi.com Volume 2014 Journal of
Obesity
Journal ofHindawi Publishing Corporation
http://www.hindawi.com Volume 2014
Hindawi Publishing Corporation
http://www.hindawi.com Volume 2014
Computational and Mathematical Methods in Medicine
Ophthalmology
Journal ofHindawi Publishing Corporation
http://www.hindawi.com Volume 2014
Diabetes Research
Journal ofHindawi Publishing Corporation
http://www.hindawi.com Volume 2014
Hindawi Publishing Corporation
http://www.hindawi.com Volume 2014
Research and Treatment
AIDS
Hindawi Publishing Corporationhttp://www.hindawi.com Volume 2014
Gastroenterology Research and Practice
Hindawi Publishing Corporation
http://www.hindawi.com Volume 2014
Parkinson’s
Disease
Evidence-Based Complementary and Alternative Medicine Volume 2014Hindawi Publishing Corporation http://www.hindawi.com