University of Wollongong
University of Wollongong
Research Online
Research Online
Faculty of Engineering and Information
Sciences - Papers: Part A
Faculty of Engineering and Information
Sciences
1-1-2016
Towards data analytics of pathogen-host protein-protein interaction: a
Towards data analytics of pathogen-host protein-protein interaction: a
survey
survey
Huaming Chen
University of Wollongong, [email protected]
Jun Shen
University of Wollongong, [email protected]
Lei Wang
University of Wollongong, [email protected]
Jiangning Song
Monash University, [email protected]
Follow this and additional works at: https://ro.uow.edu.au/eispapers
Part of the Engineering Commons, and the Science and Technology Studies Commons
Recommended Citation
Recommended Citation
Chen, Huaming; Shen, Jun; Wang, Lei; and Song, Jiangning, "Towards data analytics of pathogen-host protein-protein interaction: a survey" (2016). Faculty of Engineering and Information Sciences - Papers: Part A. 6084.
https://ro.uow.edu.au/eispapers/6084
Research Online is the open access institutional repository for the University of Wollongong. For further information contact the UOW Library: [email protected]
Towards data analytics of pathogen-host protein-protein interaction: a survey
Towards data analytics of pathogen-host protein-protein interaction: a survey
Abstract
Abstract
"Big Data" is immersed in many disciplines, including computer vision, economics, online resources, bioinformatics and so on. Increasing researches are conducted on data mining and machine learning for uncovering and predicting related domain knowledge. Protein-protein interaction is one of the main areas in bioinformatics as it is the basis of the biological functions. However, most pathogen-host protein-protein interactions, which would be able to reveal much more infectious mechanisms between pathogen and host, are still up for further investigation. Considering a decent feature representation of pathogen-host protein-protein interactions (PHPPI), currently there is not a well structured database for research purposes, not even for infection mechanism studies for different species of pathogens. In this paper, we will survey the PHPPI researches and construct a public PHPPI dataset by ourselves for future research. It results in an utterly big and imbalanced data set associated with high dimension and large quantity. Several machine learning methodologies are also discussed in this paper to imply possible analytics solutions in near future. This paper contributes to a new, yet challenging, research area in applying data analytic technologies in bioinformatics, by learning and predicting pathogen-host protein-protein interactions.
Keywords
Keywords
protein, data, interaction, pathogen, host, survey, towards, analytics
Disciplines
Disciplines
Engineering | Science and Technology Studies
Publication Details
Publication Details
Chen, H., Shen, J., Wang, L. & Song, J. (2016). Towards data analytics of pathogen-host protein-protein interaction: a survey. 2016 IEEE International Congress on Big Data (BigData Congress) (pp. 377-388). United States: IEEE.
Towards Data Analytics of Pathogen-Host Protein-Protein Interaction: A survey
Huaming Chen, Jun Shen, Lei Wang School of Computing and Information Technology
University of Wollongong Wollongong, NSW, Australia
Email: [email protected],{jshen,leiw}@uow.edu.au
Jiangning Song
Department of Biochemistry and Molecular Biology Monash University
Melbourne, Victoria, Australia Email: [email protected]
Abstract—“Big Data” is immersed in many disciplines, in-cluding computer vision, economics, online resources, bioinfor-matics and so on. Increasing researches are conducted on data mining and machine learning for uncovering and predicting related domain knowledge. Protein-protein interaction is one of the main areas in bioinformatics as it is the basis of the biological functions. However, most pathogen-host protein-protein interactions, which would be able to reveal much more infectious mechanisms between pathogen and host, are still up for further investigation. Considering a decent feature representation of pathogen-host protein-protein interactions (PHPPI), currently there is not a well structured database for research purposes, not even for infection mechanism studies for different species of pathogens. In this paper, we will survey the PHPPI researches and construct a public PHPPI dataset by ourselves for future research. It results in an utterly big and imbalanced data set associated with high dimension and large quantity. Several machine learning methodologies are also discussed in this paper to imply possible analytics solutions in near future. This paper contributes to a new, yet challenging, research area in applying data analytic technologies in bioin-formatics, by learning and predicting pathogen-host protein-protein interactions.
Keywords-big data; PHPPI; bioinformatics; machine learn-ing
I. INTRODUCTION
The adoption of “Big Data” in bioinformatics has become the main research stream not only in genome and proteomics areas [1], but also in biomedical medicine and imaging area [2]. With the new high throughput technologies, enormous amounts of data are being generated by biologists. Ranging from genomic sequencing experiments to images of phys-iological structures, biologists are starting to grapple with tremendous data sets, encountering challenges in processing and analyzing information that were once considered only with specific domain knowledge [3]. The direct benefit for big data analytics in bioinformatics areas is that, with the enormous amounts of data we have obtained nowadays, the hypothesis and phenomena behind these biology researches could be generated based on data, which was summarized via vast amount of experiments. It is becoming a data-driven work that helps biologists in designing the further experiments.
Proteomics is a main branch in bioinformatics, since
proteins are considered as the basics of living organisms and the interactions between different proteins are the basics of the biological functions, including immune response, signal transduction and other essential functions [4]. As a basis of biological functions, protein-protein interaction (PPIs) plays a crucial role in most biological processes. Mostly, PPIs means either “intra-species PPIs” or “inter-species PPIs”. Intra-species PPIs is the interaction between two proteins from the same species, while inter-species PPIs means interaction between two proteins from two different species. How to identify PPIs is essential for understanding the whole biological functions. Since PPIs are essential to the majority of cellular functions, many innovative techniques and systems for identifying protein interactions have been developed [5]. Numerous supervised learning technologies have been adopted to prediction of PPIs. Classifying pairs of proteins as interacting or not, has been the subject of intense researches in the recent years, in both computational and biology experimental areas [6].
Most diseases, which occur between the host and pathogen, could be analyzed by groups of infectious mech-anisms. Since pathogen-host PPIs is the key to either the mechanisms of infection or medicine treatment, how to get a better understanding and prediction of inter-species PPIs, specifically between the host and pathogen is a hot topic for biology research. It has been reported that the unavailability of experimental methods for large-scale de-tection of interactions between host and pathogen organisms is one of the main obstacles [7]. On the other hand, the false positive rate of the available computational and high-throughput experimental interaction datasets remains high [8].
The pathogen-host protein-protein interactions, including the information of the infection pathways, reveals much more information in the infection mechanisms between pathogen and host. Since protein-protein interaction takes charge of almost every biological processes, systems bi-ology based approaches also study infectious diseases by analyzing the interactions between the host species and the pathogen organisms [9]. Different from classical protein-protein interaction, currently there is less experimentally identified interaction data for host-pathogen protein-protein
interaction. How to exploit these experimental identified PHPPI data for a further prediction is an urgent problem to facilitate the progress.
In this paper, we focus on the PHPPI big data set curation process. Some well developed methodologies used for tackling the prediction on this PHPPI big data set are also introduced as the background of our research. For every bioinformatics researcher, a good understanding of protein feature extraction is very important. Since there are several public databases that store different aspects of protein, this survey discusses on these databases first and release a PHPPI database for research at last. By conducting a survey in this protein related area, we hope to take stock of the progress that biologists have made till now, and help readers navigate through technology advances, which might focus on machine learning areas, in the future.
The rest of this paper is organized as follows: Section II describes important protein features; Section III intro-duces the related PHPPI databases; Section IV discusses the machine learning methodologies used in PPIs area; Section V presents a detailed process for the PHPPI big data set curation; challenges for using PHPPI big data set are introduced in Section VI. Finally Section VII concludes the paper.
II. PROTEINFEATURES
It is an ongoing research for bioinformatics researchers to figure out which mechanism would be the best and efficient method for representing and encoding protein features. A. Sequence Information
Sequence information is the basic information of protein. By a composition of hundreds or even thousands of amino acids, a protein is well developed and defined for its own structure and its function. “Sequence specifies structure” presents a virtual axiom, that knowledge of the amino acid sequence alone might be sufficient to estimate the interaction relationship between two proteins [10]. Shown as in Figure 1 is a diagram for these amino acids. These 20 basic proteinogenic types of amino acids are the structural units of proteins. Proteins are different from each other owing to the different order, combination and structure of these amino acids. This sequence information is read through the genetic code from its corresponding mRNA information.
1) Conjoint Triad Method: [10] points out that, accord-ing to each amino acids’ dipole scale and volume scale, which are their electrostatic and hydrophobic properties, these 20 amino acids types could be classified into seven groups. A short brief from [10] is listed as below in Table I. Based on this table, there are several different types of encoding algorithms for sequence representation.
The descriptor from [10] considers the properties of one amino acid and its vicinal amino acids. According the descriptor namely Conjoint Triad Method (CTM), it is easy
Figure 1: 20 Basic Proteinogenic Types of Amino Acids [10]
to represent every single protein sequence information into a class-sequence, which we call it as k-mer features. A diagram for k-mer feature encoding is shown as below in Figure 2.
Group Index Dipole Volume Amino Acids 1 - - Ala(A), Gly(G), Val(V) 2 - + Ile(I), Leu(L), Phe(F), Pro(P) 3 + + Tyr(Y), Met(M), Thr(T), Ser (S) 4 ++ + His(H), Asn(N), Gln(Q), Tpr(W) 5 +++ + Arg(R), Lys(K) 6 +’+’+’ + Asp(D), Glu(E)
7 +’ + Cysc(C)
Table I: Group of 20 Basic Amino Acids [10] As Figure 2 shows, a frequency of three conjoint triad information of sequence is calculated. In 3-mer features, a sequence would be encoded into a vector of 343 features. For a 2-mer, 4-mer and 5-mer features, the features number would be 49, 2401 and 16807.
Figure 2: Basic Process of CTM [10]
2) Auto Covariance: [11] proposed a new feature rep-resentation using auto covariance (AC) based on sequence information. By analyzing sequences with its auto cross
covariance, namely ACC, it is a popular transformation method for adopting numerical vectors to uniform matrices. Apart from cross covariance (CC) between two different vectors, only AC variable was calculated [11]. The basic idea was derived from the physicochemical properties of amino acid, which included hydrophobicity (H), volumes of side chains of amino acids (VSC), polarity (P1), polarizability (P2), solvent-accessible surface area (SASA) and net charge index of side chains (NCISC). These properties of 20 standard amino acids are reported in Table II.
Name H1 H2 Vsc P1 P2 SASA NCISC A 0.62 -0.5 27.5 8.1 0.046 1.181 0.007187 C 0.29 -1 44.6 5.5 0.128 1.461 -0.03661 D -0.9 3 40 13 0.105 1.587 -0.02382 E -0.74 3 62 12.3 0.151 1.862 0.006802 F 1.19 -2.5 115.5 5.2 0.29 2.228 0.037552 G 0.48 0 0 9 0 0.881 0.179052 H -0.4 -0.5 79 10.4 0.23 2.025 -0.01069 I 1.38 -1.8 93.5 5.2 0.186 1.81 0.021631 K -1.5 3 100 11.3 0.219 2.258 0.017708 L 1.06 -1.8 93.5 4.9 0.186 1.931 0.051672 M 0.64 -1.3 94.1 5.7 0.221 2.034 0.002683 N -0.78 2 58.7 11.6 0.134 1.655 0.005392 P 0.12 0 41.9 8 0.131 1.468 0.239531 Q -0.85 0.2 80.7 10.5 0.18 1.932 0.049211 R -2.53 3 105 10.5 0.291 2.56 0.043587 S -0.18 0.3 29.3 9.2 0.062 1.298 0.004627 T -0.05 -0.4 51.3 8.6 0.108 1.525 0.003352 V 1.08 -1.5 71.5 5.9 0.14 1.645 0.057004 W 0.81 -3.4 145.5 5.4 0.409 2.663 0.037977 Y 0.26 -2.3 117.3 6.2 0.298 2.368 0.023599
Table II: Physicochemical Properties for Amino Acids [11] In AC method, each single protein sequences was first translated into numerical values corresponding to these seven different physicochemical properties. Since the ranges of these seven physicochemical properties differ from each other, it would be a better operation to perform normalization for numerical values. These values were normalized to zero mean and unit standard deviation. The normalization equation is shown in Equation (1).
Pi,j=
Pi,j−M eanj SDj
(i= 1,2,3, ...,20;j= 1,2,3,4,5,6,7)
(1) Here Pi,j represents thejth property value ofith amino acid, whileM eanjis the mean value ofjth property over the 20 amino acids.SDjis the standard deviation ofjth property over the 20 amino acids. Through this operation, every single protein sequence was translated into six vectors with a zero mean and unit standard deviation. With a proper range of these numerical values for each single protein sequence, auto covariance was used to represented them into a uniform matric. Based on the Equation (2), a length of lg∗ 7 is calculated. lag is the distance between two amino acids, andlgis the maximum value of lag.
AC(lag, j) = 1 N−lag N−lag X i=1 (Pi,j−1 N N X i=1 Pi,j)∗(Pi+lag,j− 1 N N X i=1 Pi,j) (2)
Formproperties chosen out of these seven physicochem-ical properties, the length of the AC would be lg ∗ m. N means the length of the protein sequence. After AC transform, a representation of protein protein interaction is a concatenation of these two AC transform calculations.
3) Local Descriptor: Another sequenced-based feature representation method was Local Descriptor [12]. The most important feature of PHPPI is that, the interaction often occurs on some specific intermittent fragments. To better extract these continuous or discrete knowledge from se-quence information, [12] proposed using region descriptors to firstly divide a protein sequence into 10 regions. As shown in Figure 3, a protein sequence is divided into four equal regions (A-D), two equal regions (E, F), the central 50% region (G), the first 75% region (H), the final 75% region (I) and the central 75% region (J).
Figure 3: Dividing Protein Sequence into 10 Regions [12] With these 10 regions, a local descriptor is utilized to transform the region sequence into three related descriptors [12]. These three descriptors are Composition (C), Transition (T) and Distribution (D). Composition is the composition ratio of each group of amino acid within a separate region. Transition represents the percentage of which amino acid group is followed by another amino acid group. And Dis-tribution means a specific location information by selecting the first, 25%, 50%, 75% and last one of each amino acid group. Figure 4 shows a bit more details of C, T and D on a protein region sequence with 21 amino acids.
Figure 4: Local Descriptor for Protein Sequence adapted from [12]
Using local descriptor, the extracted feature vector would contains 7 features for composition, 21 features for transition and 35 features for distribution. Multiplied by 10 different local regions, Local Descriptor method would results in 630
features for a single protein sequence. In a PHPPI pair, this local descriptor contains 1260 features.
There are also some other methods that extract differ-ent types of concerned features for protein sequence, for example, Moran Autocorrelation Score [13], and Amino Acid Triplet [14]. Protein sequence information is the main information directly linked to PHPPI. A further novel rep-resentation of these PHPPI, which might include any other information from the specific host species, would be a better way to prediction of PHPPI [9].
B. Gene Ontology
For each single protein, it has its own gene ontology (GO) terms. Three important protein properties are provided via GO terms: molecular function (F), cellular component (C) and biological process (P). [9] has presented a good combination of GO terms into the PHPPI prediction task. The authors of [9] utilized the similarity between the GO terms of two proteins. G-Sesame [15] was used to compute the similarity between two individual GO terms, which would represent the similarity between two proteins in their molecular function, cellular component and biological process properties.
A diagram for GO terms similarity, which illustrates a “is-a” relationships as adapted from [16] is shown in Figure 5.
Figure 5: “is-a” Relationship in GO Terms [16]
By utilizing GO terms between a PHPPI pair, [9] reported that these gene ontology similarity features model the sim-ilarity between two functional properties of two proteins. Since PHPPI include many different types of pathogen species, using GO terms becomes a good strategy to link PHPPI between them. A policy deployed in [17, 18] was that, by building a set H which contains all GO terms appearing in possible human proteins and a set P which contains all GO terms from possible pathogen proteins, a matrix between set H and P was established. If set H’s size is n1 and set P’s size is n2, the size of matrix M would be n1∗n2. Now given two proteins h1 and p1. h1 might containsm1 GO terms andp1 containsm2GO terms. This results in a matrix ofm1∗m2 size. Thesem1∗m2features out of n1∗n2 is triggered and their values would be set
to be 1. Further a possible similarity calculation, such as G-Sesame, could be conducted to get a similarity map between these two proteins.
As PHPPI means protein-protein interaction between pathogen and host, they are “inter-species PPIs”. For se-quence information and gene ontology features, a pair-wise level representation is considered. However, for “intra-species PPIs”, single end representation would also be help-ful in PHPPI prediction job. For example, the interactome graph and gene expression are reported to be significantly different between two different pairs [9, 17]. Since PHPPI research mainly focus on the interactions between pathogen and human proteins, it implies an introduction of human interactome graph and gene expression for human proteins [19].
Human interactome graph features are derived using three graph properties: degree, between-ness centrality and clus-tering coefficient of human protein “node” in the human interactome graph, which can be downloded from HPRD [20]. And gene expression features are derived from several selected transcriptomic datasets, which represent a scope of human genes infected by corresponding pathogen, for example in [19] GDS77, GDS78, GDS80 from the Gene Expression Omnibus (GEO) database [21] are selected as gene expression features forSalmonella-human PPIs.
III. PHPPI DATABASES
Since many database repositories are provided all over the world by a variety of both academics and indus-try, there are many different standardized formats for PPIs data. Recently Human Proteome Organization Pro-teomics Standards Initiative(HUPO-PSI) published the PSI-MI XML format to store a single, unified format for PPIs data. Another consortium International Molecular Exchange (IMEx, http://www.imexconsortium.org/) is also established to create collaboration between research groups for sharing literature-curation efforts and making a non-redundant set of PPIs available in a single search portal on one website [22]. As a well developed version, PSI-MI XML is sup-plemented by a simplified tabular format named MITAB, which enables the user to download, combine, visualize and analyze data from multiple sources. Several well developed and popular repositories are introduced below. By far, DIP,
IntAct,MINT,I2D,MatrixDB,MBInfo,UniProt, Molecu-lar Connections,HPIDB,BioGRIDandPrimesDBare the IMEx partners. Notably most of these data repositories were initially built by the universities [22, 23].
* HPRD is a database manually extracted from lit-erature, which provides more than 30,000 proteins and also 39,000 protein-protein interactions. HPRD is built by Johns Hopkins University and the Institute of Bioinformatics. The related information, including its post-translational modifications, disease associations via OMIM for each protein in the human proteome and
domain architectures, are provided in details along with each records.
* BIND belongs to Biomolecular Object Network Data-bank (BOND), which is created by University of Toronto. Within more than 1500 organisms linked, more than 200,000 interactions are provided. Besides PPIs data, many other types of RNA, DNA, genes, complexes and small molecules interactions are also included in this repository. Even though BIND has stopped running since 2005, it still remains a highly cited PPIs database and subsequently a translation of this repository is available now.
* DIPis a combined database from a variety of sources, including Yeast Protein Database (YPD), EcoCyc, and FlyNet, Kyoto Encyclopedia of Genes and Genomes (KEGG). Developed by University of California at Los Angeles, now it contains more than 460 organisms. The DIP datasets in both complete mode and specialized mode are all freely available.
* BioGRIDis the most convincing repository because of the reported experimentally verified PPIs. 27 different organisms are included and it has continuously been updated. It contains more than 460,000 interactions and all data is available in standardized formats. Another excellent aspect is that experimental methods used for PPIs detection are also provided in BioGRID.
* MINT is a database, which contains PPIs data and various experimental details via a literature-mining program developed by University of Rome Tor Vergata. Now it provides more than 230,000 interactions and more than 34,000 proteins. The confidence scores for experimentally detected PPIs are also provided to show the reliability of the interactions.
* IntAct is an open database, which provides both the source code and data. It contains more than 60,000 proteins and more than 290,000 binary interaction evidences, which are extracted from more than 5000 scientific publications and also other direct database repositories. All of the PPIs, DNA, RNA and small-molecule interactions are included in this repository. Aside from these PPIs database, we focus on pathogen-host protein-protein interaction (PHPPI). Even though cur-rent PHPPI knowledge is still scarce and not sufficient, the research on PHPPI prediction are continuously being conducted.
Considering about 26,000 human proteins, the PHPPI pairs would be millions even if we only pair them with a few thousands of pathogen proteins. Reliable experimen-tal methods are time-consuming and expensive, making it unjustifiable, thus for some special PHPPI, we might need to verify its result with duplicate experiments. Now owing to some earlier research efforts, there are several verified PHPPI datasets available, including HPIDB [4], PATRIC
[24], PHISTO [25], VirHostNet [26] and VirusMentha [27]. These databases have provided some PPI pairs to build a “golden standard dataset”, including positive PHPPI and negative PHPPI for verifying computational methods.
A statistics of these PHPPI datasets repositories is shown in Table III. In order to build a PHPPI dataset between human and different types of pathogens, we used two datasets from PHISTO and PATRIC to build a comprehen-sive positive part of the “golden standard PHPPI dataset”. The details will be discussed in Section VI.
DataBase Pairs Number Pathogen Species Report Detection Method
HPIDB 45238 594 Yes
PATRIC 12194 15 Yes
PHISTO 47992 182 Yes
VirHostNet 2671 180 Yes
VirusMentha 6337 24 No
Table III: Details for PHPPI Databases
IV. MACHINELEARNINGMETHODOLOGIES
With a valuable dataset, a suitable computational model is desired to predict host-pathogen PPIs. Especially con-sidering the problems aforementioned in the discussion on the datasets, numerous methodologies have been proposed in different trials. Since very few host-pathogen PPIs has been studied, the methodologies presented below are mainly extracted from PPIs related researches.
1) Support Vector Machines: Support Vector Machines (SVM), developed by the authors of [28], have become the most utilized model in many research disciplines, in-cluding bioinformatics. Its associated basic structural risk minimization theory ensures the performance of SVM to be successful in many real world applications. A training dataset of PPIs is denoted as {xi,yi}, i=1,2,...,N, where
xi∈Rn andyi∈ {+1,−1}. Simply as defined in SVM,yi is calculated in the following equation:
y(x) =sign[ N
X
i=1
yiαi∗K(x, xi) +b] (3) whereK(xi, xj) =exp(−γkxi−xjk2)stands for a Radial Basis Functions (known as RBF) kernel, and αi are the parameters from a covex quadratic programming problem, which is shown as bellow:
M aximize N X i=1 αi− 1 2 N X i=1 N X j=1 αiαj·yiyj·K(xi, xj) (4) Due to the high efficiency and performance of SVM, it has been widely used in PPIs research. In [29], SVM is deployed, with a newly proposed feature curation method, to achieve a better results than others’ work, i.e. [12]. For PHPPI, the authors of [14] select two types of viruses, namely human papillomaviruses (HPV) and hepatitis C virus (HCV), then design a new frequency representation method
and deploy a SVM model achieving an average accuracy above 80 %, which is higher than other representation scheme using SVM. Furthermore, combining with transfer learning, [17] utilize two human-pathogen datasets as source tasks, and the other as target task, and achieve a relative good result using SVM model for training. These researches have shown the compatibility and performance of the SVM model for PPIs prediction.
2) Multi-task and Transfer Learning: Multi-task learn-ing aims to improve the performance of machine learnlearn-ing algorithms by learning classifiers for multiple tasks jointly, especially when the tasks contain much less data samples than we expected. It performs much better if the tasks could share some commonality.
The state-of-art studies of host-pathogen PPIs using multi-task and transfer learning are reported in [9, 17–19, 30]. [9] reports a novel method that builds a common structure across learning models, based on a biological hypothesis that “similar pathogens target the same critical biological pro-cesses in the host”. Based on another hypothesis, that “the set of human proteins are involved in a particular biological process by a graph called a biological pathway”, [9] revises it to a similarity in the infection process version, which is “protein from different bacterial species are likely to interact with human proteins from the same biological pathway”. For the pathways obtained from pathway databases like Reactome [31] and Pathway Interaction Database (PID) [32], the edges between these pathways are discarded and only the pathways are collected to present proteins, which means a human protein can be denoted as a binary pathway vector of every pathways.
In order to combine two tasks within the multi-task model, a solution for combining more tasks in the multi-task model has been proposed later but it is not implemented in [9], these two vectors obtained via pathways are calculated by an objective function. Supposepi
sis the pathway vector for PHPPI i, and two tasks are Ts and Tt. To calculate the dissimilarity between these two tasks, the objective function is denoted as Equation (5). L(ws, wt) =l(ws) +l(wt) +λkRk2+σ(kwsk2+kwtk2) (5) where R=S(Ts)−S(Tt) S(Ts) = 1 n+s X i∈Xs+ pisIpos(wTsx i s)
Only the positive PHPPI pairs are considered.
Meanwhile it is noted that any convex function could compute over task Ts and Tt for l(ws) and l(wt). The last two l2 regularization norms over the parameter vectors
ws and wt to control over-fitting. The parameters λ and
σ take positive values. It is proved that this equation is a difference of convex (DC) function. It could be represented
as in Equation (6). L=[l(ws, wt) +Rl2(ws, wt) +λ N X k=1 2(fk2+gk2)] −[λ N X k=1 (fk+gk)2] L=F(ws, wt)−G(ws, wt) (6)
Using CCCP algorithm proposed by [33], the objective function is decreased to a local minimum point. Then the pair-wise model is introduced to test the model.
The experiments are carried out with human as the host and four bacterial species as pathogens. Using a task-based regularization approach to build a multitask learning model, [9] implements a Convex-Concave procedure based algo-rithm to optimize the model and achieve a better result than single host-pathogen protein interaction dataset. According to its public data and source code, the gene expression from Gene Expression Omnibus (GEO) repository [21], protein sequence from Uniprot database [34], gene ontology from GO database, properties of human proteins in the human PPIs network and the positive pathway in each positive PPIs are utilized. For those missing data [9] uses a mean value-based feature imputation, because integrating several databases would result in incompleteness of features.
[9] also describes the details about the following promi-nent feature computations.
- For protein sequence from Uniprot ID, a frequency feature of amino acid within the sequence features are extracted using k-mers [10]. It is finally a frequency value to represent every single protein sequence. - For gene ontology features, using G-Sesame algorithm,
the similarity between two individual GO terms is computed.
- The third feature utilized in [9] is derived by using only the human protein from the pair, which represents the properties of human proteins in the human PPIs network. It has been reported that pathogens generally target host proteins that are important in several host processes, and later these host proteins interact with many other host proteins to carry out their tasks. These human interactome could be downloaded from HPRD, including the degree, between-ness centrality andclustering coefficient properties.
- The last feature is related to gene expression features. Using transcriptomic dataset GSE12131, GSE 14390, GSE 5966 for pathogenB.anthracis, GSE 12108, GSE 22203 forF.tularensis, and GSE 22299, GSE 18293 for Y.pestisfrom the GEO database, which would give the differential gene expression of human genes infected by the bacteria under different control conditions, the result shows a different regulation of human protein subject to bacterial infection.
With these four features integrated, for all four interaction datasets used in [9], a unique feature dataset is completed and the number of each PPIs dataset are, 694715 for B.anthracis, 468955 for F.tularensis, 886480 for Y.pestis, 349155 for S.typhi. But for every PPIs dataset, not all examples and all features are available over there since it is integrated by several different databases, some of which are not complete inherently. So the dimensions of each PPIs datasets is not the same as shown here, like 694715 for B.anthracis. For example, a PHPPI pair would be directly eliminated if the missing ration of features >10%. For the rest, a mean value-based feature imputation strategy is utilized.
Although experiments are basically conducted under the conditions of independent models and multitask pathway-based learning, the results have shown that multi-task learn-ing could improve the learnlearn-ing performance for small and limited PPIs datasets.
3) Extreme Learning Machines: [5, 35] utilized Ex-treme Learning Machines (ELM), combined with local de-scriptors, for protein sequence representation, and achieved a better result compared with SVM methods.
Dividing an entire protein sequence into several equal length fractions, which we call continuous regions, we are able to convert it in a binary coding scheme, which is called a global descriptor for protein sequence. Then for each continuous region, three types of descriptors, which are composition, transition, and distribution, are calculated to represent the local information for each continuous region. Derived from Local Descriptor discussed in Section II, below is a detailed process as shown in Figure 6.
The three types of descriptors are described in details.
- Composition: the exact percentage of each groups.
Group Index here means the seven-group category for Composition. There are six “1”, eight “3” and seven “7” in this protein sequence. The composition of these three symbols is 6/(6+7+8)=28.57%, 8/(6+7+8)=38.10%, 7/(6+7+8)=33.33%.
- Transition:the percentage of transition from one group
to another group, which results in namely 21 different transitions. For transitions, there are 2 transitions be-tween “1” and “3”, 3 transitions bebe-tween “7” and “1”, 6 transitions between “7” and “3”, thus, the transitions of these three symbols can be calculated as2/20=10%, 3/20=15%,6/20=30%.
- Distribution: for each group, we get a subset and its
corresponding selected location for distribution repre-sentation. The Distribution is calculated a bit more complicated here. The 1st, 25%,50%,75% and100% amino acid are selected for every group. Considering group “1”, they are the 1st, 2nd, 3rd, 5th and 6th amino acid in the group, which should be the 4th, 5th, 6th, 15th, 21th of the protein sequence. So the Distribution for “1” are4/21=19.05%,5/21=23.81%,6/21=28.57%,
15/21=71.43%,21/21=100%. The Distribution for “3” and “7” are similar.
Since it was categorized in seven groups, the dimensions of Composition is 7, the dimensions of Transitions is7*6/2=21 and the distribution is of 7*5=35 dimensions. So for every continuous region, it contains a vector of 63 dimensions. For an entire protein sequence, it is chosen with a 7-bit representation, which results in a set of 126 different regions. Taken from these 126 different regions, only 27 regions could be a continuous regions. That means each protein sequence contains63*27=1701dimensions overall. For each protein pair, a 3422 dimensional vector is constructed to represent it and to be used as a feature vector for Extreme Learning Machine.
Figure 6: Example from [36] for Local Descriptor
Method in [12] is a bit different from this partition method introduced in [36]. As discussed in Section II, 10 local regions of varying length are selected out of every protein sequence.
In all of these PPIs researches, a Golden Standard Dataset could be found from the HPRD. On the other hand a relative golden negative dataset of equal number can be downloaded from [37] and curated with another randomly generated one from Swiss-Prot database [38].
ELM plays a crucial role in training this curated dataset, if we focus on high accuracy and meanwhile consider the running time taken to train the classification model. The running time increases in this model, according to the reported results, with varying numbers of hidden neurons. A whole dataset consists of 73,110 protein pairs are used in this model. For ELM, it assumes that for a classic neural network, its traditional parameters set includes Wij, bi, βi. In ELM, for every pair of Wij, bi, the βi is decided correlated and unique. The design of ELM follows classic neural network. Suppose N samples for learning, which are denoted as (xi, ti), where xi = [xi1, xi2, ..., xin]T and
ti = [ti1, ti2, ..., tim]. Here we set ELM with L hidden neurons and the transfer function to beg(x). Shown as below
is the mathematical model function. L X i=1 βig(xj) = L X i=1 βig(wi∗xj+bi) wi= [wi1, wi2, wi3, ..., win]T βi= [βi1, βi2, ..., βim]T (7)
bi represent the bias of ith hidden neuron. According to ELM theory, the minimum error of
L
P
i=1
βig(xj)−tj is the main objective, where tj ∈ [t1, t2, ...tN]. These equations can be written in a compact way as follows.
Hβ=T (8) H[w1, ..., wL;b1, ..., bL;x1, ..., xN] = g(w1∗x1+b1) · · · g(wL∗x1+bL) g(w1∗x2+b1) · · · g(wL∗x2+bL) .. . · · · ... g(w1∗xN +b1) · · · g(wL∗xN +bL) N×L β = βT i .. . βLT L×m , T = tT i .. . tTi N×m (9) In summary, given a dataset, we are able to construct an ELM learning model, and the learning procedure can be presented as below.
STEP 1 Fix the input weight wi and bias bi, i = 1,...,L STEP 2 Calculate the hidden neurons output H
STEP 3 Calculate β according to β = H∗T, H∗ is the Moore-Penrose generalized inverse of the hidden neurons output.
4) Naive Bayes: [39, 40] reported using Bayesian Clas-sification to predict protein-protein interactions.
In [39], three-dimensional structural information was used to predict PPIs and the result shows that it is more superior than other non-structural evidences. Using the sequence alignment to identify structural representatives, which cor-respond to either their experimentally verified structures or homology models, this method tried to find both close and remote structural neighbors with these structural alignment. From these neighbors we would be able to form a template for modeling the interaction of query proteins. Thus com-bined with other raw features, the naive Bayesian Classifier was able to predict PPIs compared with other reported high-throughput experiments. It was actually not a direct three dimension structure information utilization in [39], but it still outperformed other methods. The algorithm, namely PrePPI, through combining structural information with other functional clues and using Bayesian statistics, shows its ability to be comparable with high-throughput experiments, which yields over 30,000 high-confidence interactions for yeast and over 300,000 for humans. A brief illustration of
the steps used in this method is shown below, assuming a pair of interesting query proteins are QAandQB.
STEP 1 Using sequence alignment to identify the structural representatives, here denoted asMAand MB, that correspond to either their experimentally deter-mined structures from the PDB [41] or to homology models from the ModBase [42] homology model databases. The selection criteria are different for these databases. For a specific data, a similarity of above 40% always brings in a high similarity in structure.
STEP 2 Using structural alignment to find both close and remote structural neighbors of MA and MB, here we denote them as N Ai and N Bj. There would probably be∼ 1500 of each, which would result in over 2 million pairs.
STEP 3 If one of the 2 million pairs is reported in PDB, we get a template for modeling the interaction of
QAandQB
This procedure would produce more interaction models, approximately 550 million “interaction model” for about 2.4 million PPIs involving about 3900 yeast proteins, and about 12 billion models for about 36 million PPIs involving about 13000 human proteins. The evaluation of each interaction model is needed. This PrePPI algorithm was considered to be able to identify unexpected PPIs of considerable biological interest.
Also for Bayesian statistics, the authors of [43] integrated a number of public intra-species PPIs datasets with protein-domain profiles to develop a framework for statistics com-puting, in order to illustrate the frequency of proteins with specific pairs of domains interacted, and predict inter-species HPPPIs. For every pair of host and pathogen proteins, there exists at least one domain, thus the probability whether these two proteins interact can then be calculated.
Besides these machine learning models, some other mod-els have also been adopted for PPIs prediction, including K-Nearest Neighbors [44], Decision Tree [45], Random Forest [46], Homology Detection Approaches [47]. All these models aim to get a better understanding of PPIs inner mechanism. How to better utilizing the features remains as a key issue in the research progress.
V. DATASET FORPHPPI
In this section, we will report the big data set curation process of PHPPI. The repositories we choose here are PATRIC and PHISTO, which data are manually extracted from related literatures. Furthermore, the feature we choose for PHPPI is sequence information. Every vector representing singular PPIs pair is high dimensional.
Pathogens include virus, bacterias fungi and others, anyhow, in our research we first use bacterias as the main pathogen and human as the host. This strategy allows us to focus on deeper information mining. Statistics combining
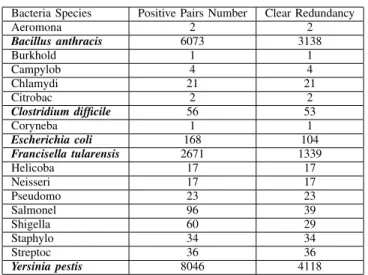
data from PHISTO and PATRIC is shown in Table IV below.
Bacteria Species Positive Pairs Number Clear Redundancy
Aeromona 2 2 Bacillus anthracis 6073 3138 Burkhold 1 1 Campylob 4 4 Chlamydi 21 21 Citrobac 2 2 Clostridium difficile 56 53 Coryneba 1 1 Escherichia coli 168 104 Francisella tularensis 2671 1339 Helicoba 17 17 Neisseri 17 17 Pseudomo 23 23 Salmonel 96 39 Shigella 60 29 Staphylo 34 34 Streptoc 36 36 Yersinia pestis 8046 4118
Table IV: Statistic of PHPPI Data Set
From Table IV, we choose bacteria Bacillus anthracis,
Clostridium difficile, Escherichia coli, Francisella tularensis and Yersinia pestis to curate the data set for PHPPI. In case that these data by now are reported with positive pairs, to curate a whole data set of PHPPI, a negative pairs data set is also desired.
They are actually only considered as a “probable negatives” dataset for negative pairs curation. Since no literature has ever reported any non-interacted protein protein pairs, we have used a technique, namely random selection, which is commonly used in PPIs prediction literature. We pair up all bacteria proteins with all human proteins and sample a random set to be negatives. This heuristics works in practice as the interaction ratio (i.e. number of positives in a large random set of protein pairs) is expected to be very low:1/100to1/500[9, 19, 48, 49]. We expect 1 out of every 100 random PHPPI to interact with each other. Thus the probability that our negatives contain true positives is essentially negligible.
Before we represent this data set with their corresponding features, a clustering process is required to reduce the occurrence of similar proteins in positive pairs. In this paper we used the cd-hit method, which were proposed in [50, 51]. After clustering, we found out that some of these proteins could be clustered into same groups. Hence we reserved those proteins, which interact with the most human proteins, in a same cluster.
Here we choose a ratio of 1:100 between positive pairs and negative pairs, which result in a number of 283300 pairs for Bacillus anthracis, 5200 pairs for Clostridium difficile, 7200 pairs for Escherichia coli, 118000 pairs for
Francisella tularensisand 340600 pairs forYersinia pestis. Even though for most proteins, their sequence and GO
terms information exist in the corresponding database, including Uniprot and Gene Ontology Consortium, there are still some of the proteins that we lack their features information. With a comprehensive fetching and curation process, we have successfully built a data set and its corresponding statistics are shown as below in Figure 7.
Figure 7: Statistics of PHPPI Data Set
With this whole data set including both positive and negative pairs, we are now able to extract the features using protein sequence features. The dimension details of the PHPPI data set will be discussed in the next section.
VI. CHALLENGES FORPHPPI DATASET
In this section, we will discuss several challenges existing for PHPPI big data sets and present some insights on several potential methods to tackle these challenges.
A. High Dimensions
For the computational model, the feature vectors, which are composed from these PPIs databases and feature databases, are with very high dimension. A short list for our PHPPI data set is shown in Table V. For sequence information, we used 2-mers, 3-mers, 4-mers and 5-mers features. The corresponding feature number would be 98, 686, 4802, 33614. So for each bacteria species, the dimen-sions are 39200.
Thus the PPIs data in a large sample set with high dimension poses a big challenge for learning the model efficiently. Furthermore, if we take gene ontology as extra
Bacteria Species All Pairs Number Dimensions Bacillus anthracis 286133 39200 Clostridium difficile 5252 39200 Escherichia coli 7272 39200 Francisella tularensis 119180 39200 Yersinia pestis 344006 39200
Table V: Detail Statistics of PHPPI Data Set
feature, and use the method proposed by [9], it would result in a feature with 700k dimensions.
Under these circumstances, there are several methods worth being considered to tackle the challenging problem. First of all, we could use Principal Component Analysis, minimal-redundancy-maximal-relevance criterion (mRMR) [52] and artificial neural network to reduce the dimensions. Neural network, especially a multi-layer structure, is be-lieved to be powerful to extract the inner relations between each data and dimensions. The state-of-art method here to encounter with high dimension problem would be a multi-layer structure for mapping the high dimension data into a low dimensions representation, which implies decreasing the dimension and extracting the abundant relations between each dimensions in a neural network learning model. For example, [53] used deep learning to create a multi-layer network for cancer diagnosis and classification. Compared with deep learning, General Vector Machines (GVM) [54], which was based on Monte Carlo algorithm and also used by us in genetic classifications, could be used to learn from data set associated with high dimension but a low quantity of samples.
B. Missing Data
Data scarcity is a common and challenging issue for applying machine learning methods in bioinformatics, es-pecially for host-pathogen protein-protein interactions. As mentioned in [19], a regular fraction of about 58% - 85% missing values makes it a big headache to apply machine learning algorithms. The missing data problem comes from the lack of experiments, where ongoing experimental stud-ies are either difficult or expensive to conduct or lagging behind to obtain enough information for the much more advanced progresses in data analytics area, even with the high-throughput techniques. Taking Salmonella-human PPIs prediction as an example, only 1058 proteins are known for their molecular functions in gene ontology, 592 proteins are known for their protein structure in PDB, and 2978 proteins are known for their protein family information in Pfam [55] database, even though there are 4533 protein sequences reported in the reference proteome set in the Uniprot database. This will result in a large missing fraction when we want to combine all of these features as one feature vector. It is reported that 58% of the interactions in 62 known PPIs have at least one feature with missing values [19].
In our PHPPI big data set, we try to avoid missing
data problem by deleting the protein pairs, which lack information for some features. It results in a smaller positive and negative data set. How to utilize a proper machine learning or data preparation technology to maintain these identified pairs, so as to curate data set and help to improve the prediction results, remains a research challenge now. C. Negative PHPPI Data
The negative PPIs data is needed under the consideration of supervised learning models. With a ratio of nearly 1:1 between positive and negative PPIs data, it is called a balanced dataset. Otherwise it is assumed an imbalanced dataset with a 1:100 or more. The ratio of positive to negative PPIs data is critical to avoid a biased classifier towards inaccurate predictions. A ratio of 1:100 is usually chosen for PHPPI data curation. The other challenge in dealing with the negative PPIs data is its selection strategy. Both random sampling and a novel negative data sampling method based on one-class SVM have been compared in [56].
VII. CONCLUSION
In this paper, we try to explore the PHPPI prediction problem, which would facilitate the research on infectious mechanisms between pathogen and host. Considering the protein features, which include sequence information, gene ontology information, human interactome graph and gene expression features, we have curated a PHPPI big data set and also have released a sample online for research1. It is a big data set with high quantity and high dimension. Most of the works in the literature focused on sequence information features and species” PPIs. In “intra-species” PPIs, a balanced data set was often curated and used for model performance analysis. For PHPPI, considering the experimental experience, an imbalanced ratio between 1:100 and 1:500 should be considered. Also other protein properties and pair-wise level features could be taken into consideration for feature representation.
The multi-layer structures, namely deep learning technol-ogy, have shown its decent performance to deal with big data set with high dimension. For example, sparse autoencoder [57], restricted Boltzmann machine (RBM) [58] and so on, have enlightened promising future research in establishing computational methods for PHPPI prediction.
ACKNOWLEDGMENT
The authors would like to thank Dr. Meghana Kshirsagar and Prof. Judith Klein for their kindly replies on their advanced work on PHPPI. This work is supported by the scholarship from the China Scholarship Council (CSC), while the first author pursues his PhD degree in the Uni-versity of Wollongong.
REFERENCES
[1] C. S. Greene, J. Tan, M. Ung, J. H. Moore, and C. Cheng, “Big data bioinformatics,”Journal of cellular physiology, vol. 229, no. 12, pp. 1896–1900, 2014.
[2] N. Savage, “Bioinformatics: big data versus the big c,” Nature, vol. 509, no. 7502, pp. S66–S67, 2014.
[3] V. Marx, “Biology: The big challenges of big data,”Nature, vol. 498, no. 7453, pp. 255–260, 2013.
[4] R. Kumar and B. Nanduri, “Hpidb-a unified resource for host-pathogen interactions,”BMC bioinformatics, vol. 11, no. Suppl 6, p. S16, 2010.
[5] Z.-H. You, S. Li, X. Gao, X. Luo, and Z. Ji, “Large-scale protein-protein interactions detection by integrating big biosensing data with computational model.”Biomed Res. Int., vol. 2014, p. 598129, 2014.
[6] Y. Qi, O. Tastan, J. G. Carbonell, J. Klein-Seetharaman, and J. Weston, “Semi-supervised multi-task learning for pre-dicting interactions between HIV-1 and human proteins,” Bioinformatics, vol. 26, no. 18, pp. i645–i652, 2010. [7] O. Krishnadev and N. Srinivasan, “Prediction of
protein-protein interactions between human host and a pathogen and its application to three pathogenic bacteria.” Int. J. Biol. Macromol., vol. 48, no. 4, pp. 613–9, 2011.
[8] M. S. Scott and G. J. Barton, “Probabilistic prediction and ranking of human protein-protein interactions,”BMC Bioin-formatics, vol. 8, no. 1, p. 239, 2007.
[9] M. Kshirsagar, J. Carbonell, and J. Klein-Seetharaman, “Mul-titask learning for host-pathogen protein interactions,” Bioin-formatics, vol. 29, no. 13, pp. 217–226, 2013.
[10] J. Shen, J. Zhang, X. Luo, W. Zhu, K. Yu, K. Chen, Y. Li, and H. Jiang, “Predicting protein-protein interactions based only on sequences information,”Proc. Natl. Acad. Sci., vol. 104, no. 11, pp. 4337–4341, 2007.
[11] Y. Guo, L. Yu, Z. Wen, and M. Li, “Using support vector machine combined with auto covariance to predict protein– protein interactions from protein sequences,” Nucleic acids research, vol. 36, no. 9, pp. 3025–3030, 2008.
[12] M. N. Davies, A. Secker, A. A. Freitas, E. Clark, J. Timmis, and D. R. Flower, “Optimizing amino acid groupings for gpcr classification,”Bioinformatics, vol. 24, no. 18, pp. 1980– 1986, 2008.
[13] J.-F. Xia, K. Han, and D.-S. Huang, “Sequence-based predic-tion of protein-protein interacpredic-tions by means of rotapredic-tion forest and autocorrelation descriptor,”Protein and Peptide Letters, vol. 17, no. 1, pp. 137–145, 2010.
[14] G. Cui, C. Fang, and K. Han, “Prediction of protein-protein interactions between viruses and human by an svm model,” BMC bioinformatics, vol. 13, no. 7, p. 1, 2012.
[15] Z. Du, L. Li, C.-F. Chen, S. Y. Philip, and J. Z. Wang, “G-sesame: web tools for go-term-based gene similarity analysis and knowledge discovery,”Nucleic acids research, p. gkp463, 2009.
[16] H. P. Bastos, L. A. Clarke, and F. M. Couto, “Annotation ex-tension through protein family annotation coherence metrics,” Frontiers in genetics, vol. 4, pp. 201–201, 2012.
[17] M. Kshirsagar, J. Carbonell, and J. Klein-Seetharaman, “Mul-tisource transfer learning for host-pathogen protein interaction prediction in unlabeled tasks,” NIPS Work. Mach. Learn. Comput. Biol., no. 1, pp. 3–6, 2013.
[18] M. Kshirsagar, S. Schleker, J. Carbonell, and J. Klein-Seetharaman, “Techniques for transferring host-pathogen pro-tein interactions knowledge to new tasks.”Front. Microbiol., vol. 6, no. February, p. 36, 2015.
[19] M. Kshirsagar, J. Carbonell, and J. Klein-Seetharaman,
“Tech-niques to cope with missing data in host-pathogen protein interaction prediction,” Bioinformatics, vol. 28, no. 18, pp. 466–472, 2012.
[20] T. K. Prasad, R. Goel, K. Kandasamy, S. Keerthikumar, S. Ku-mar, S. Mathivanan, D. Telikicherla, R. Raju, B. Shafreen, A. Venugopalet al., “Human protein reference database2009 update,” Nucleic acids research, vol. 37, no. suppl 1, pp. D767–D772, 2009.
[21] T. Barrett, D. B. Troup, S. E. Wilhite, P. Ledoux, D. Rudnev, C. Evangelista, I. F. Kim, A. Soboleva, M. Tomashevsky, and R. Edgar, “Ncbi geo: mining tens of millions of expression profilesdatabase and tools update,” Nucleic acids research, vol. 35, no. suppl 1, pp. D760–D765, 2007.
[22] J. Zahiri, J. H. Bozorgmehr, and A. Masoudi-Nejad, “Com-putational Prediction of Protein-Protein Interaction Networks: Algorithms and Resources.” Curr. Genomics, vol. 14, no. 6, pp. 397–414, 2013.
[23] S. Orchard, S. Kerrien, S. Abbani, B. Aranda, J. Bhate, S. Bid-well, A. Bridge, L. Briganti, F. S. Brinkman, G. Cesareni et al., “Protein interaction data curation: the international molecular exchange (imex) consortium,” Nature methods, vol. 9, no. 4, pp. 345–350, 2012.
[24] A. R. Wattam, D. Abraham, O. Dalay, T. L. Disz, T. Driscoll, J. L. Gabbard, J. J. Gillespie, R. Gough, D. Hix, R. Kenyon et al., “Patric, the bacterial bioinformatics database and analysis resource,”Nucleic acids research, p. gkt1099, 2013. [25] S. D. Tekir, T. C¸ akır, E. Ardıc¸, A. S. Sayılırbas¸, G. Konuk, M. Konuk, H. Sarıyer, A. U˘gurlu, ˙I. Karadeniz, A. ¨Ozg¨ur et al., “Phisto: pathogen–host interaction search tool,” Bioin-formatics, vol. 29, no. 10, pp. 1357–1358, 2013.
[26] V. Navratil, B. de Chassey, L. Meyniel, S. Delmotte, C. Gau-tier, P. Andr´e, V. Lotteau, and C. Rabourdin-Combe, “Virhost-net: a knowledge base for the management and the analysis of proteome-wide virus–host interaction networks,” Nucleic acids research, vol. 37, no. suppl 1, pp. D661–D668, 2009. [27] A. Calderone, L. Licata, and G. Cesareni, “Virusmentha:
a new resource for virus-host protein interactions,” Nucleic acids research, p. gku830, 2014.
[28] C. Cortes and V. Vapnik, “Support-vector networks,”Machine learning, vol. 20, no. 3, pp. 273–297, 1995.
[29] Z. You, Z. Ming, B. Niu, S. Deng, and Z. Zhu, “A svm-based system for predicting protein-protein interactions using a novel representation of protein sequences,” in Intelligent Computing Theories. Springer, 2013, pp. 629–637. [30] S. Schleker, M. Kshirsagar, and J. Klein-Seetharaman,
“Comparing humanˆaSalmonella with plantˆaSalmonella pro-teinˆaprotein interaction predictions,”Front. Microbiol., vol. 6, no. January, pp. 1–10, 2015.
[31] D. Croft, G. OKelly, G. Wu, R. Haw, M. Gillespie, L. Matthews, M. Caudy, P. Garapati, G. Gopinath, B. Jassal et al., “Reactome: a database of reactions, pathways and biological processes,” Nucleic acids research, p. gkq1018, 2010.
[32] C. F. Schaefer, K. Anthony, S. Krupa, J. Buchoff, M. Day, T. Hannay, and K. H. Buetow, “Pid: the pathway interaction database,” Nucleic acids research, vol. 37, no. suppl 1, pp. D674–D679, 2009.
[33] A. L. Yuille and A. Rangarajan, “The concave-convex pro-cedure,” Neural computation, vol. 15, no. 4, pp. 915–936, 2003.
[34] U. Consortium et al., “Uniprot: a hub for protein informa-tion,”Nucleic acids research, p. gku989, 2014.
[35] Z. You, Z. Ming, B. Niu, S. Deng, and Z. Zhu, “A SVM-based system for predicting protein-protein interactions using a novel representation of protein sequences,” Lect. Notes
Comput. Sci. (including Subser. Lect. Notes Artif. Intell. Lect. Notes Bioinformatics), vol. 7995 LNCS, pp. 629–637, 2013. [36] Z.-H. You, Y.-K. Lei, L. Zhu, J. Xia, and B. Wang, “Prediction of protein-protein interactions from amino acid sequences with ensemble extreme learning machines and principal com-ponent analysis,”BMC Bioinformatics, vol. 14, no. Suppl 8, p. S10, 2013.
[37] P. Smialowski, P. Pagel, P. Wong, B. Brauner, I. Dunger, G. Fobo, G. Frishman, C. Montrone, T. Rattei, D. Frishman et al., “The negatome database: a reference set of non-interacting protein pairs,”Nucleic acids research, vol. 38, no. suppl 1, pp. D540–D544, 2010.
[38] B. Boeckmann, A. Bairoch, R. Apweiler, M.-C. Blatter, A. Estreicher, E. Gasteiger, M. J. Martin, K. Michoud, C. O’Donovan, I. Phanet al., “The swiss-prot protein knowl-edgebase and its supplement trembl in 2003,”Nucleic acids research, vol. 31, no. 1, pp. 365–370, 2003.
[39] Q. C. Zhang, D. Petrey, L. Deng, L. Qiang, Y. Shi, C. A. Thu, B. Bisikirska, C. Lefebvre, D. Accili, T. Hunter, T. Maniatis, A. Califano, and B. Honig, “Structure-based prediction of proteinprotein interactions on a genome-wide scale,”Nature, vol. 490, no. 7421, pp. 556–560, 2012.
[40] M. Snyder, M. Snyder, H. Yu, H. Yu, N. Krogan, N. Kro-gan, R. Jansen, R. Jansen, a. Emili, a. Emili, M. Gerstein, M. Gerstein, Y. Kluger, Y. Kluger, J. Greenblatt, J. Greenblatt, S. Chung, S. Chung, D. Greenbaum, and D. Greenbaum, “A Bayesian Networks Approach for Predicting Protein-Protein Interactions from Genomic Data,”Science (80-. )., vol. 302, no. 5644, pp. 449–453, 2003.
[41] J. L. Sussman, D. Lin, J. Jiang, N. O. Manning, J. Prilusky, O. Ritter, E. Abolaet al., “Protein data bank (pdb): database of three-dimensional structural information of biological macromolecules,”Acta Crystallographica Section D Biologi-cal Crystallography, vol. 54, no. 6, pp. 1078–1084, 1998. [42] U. Pieper, N. Eswar, F. P. Davis, H. Braberg, M. S.
Madhusud-han, A. Rossi, M. Marti-Renom, R. Karchin, B. M. Webb, D. Eramianet al., “Modbase: a database of annotated com-parative protein structure models and associated resources,” Nucleic acids research, vol. 34, no. suppl 1, pp. D291–D295, 2006.
[43] M. D. Dyer, T. M. Murali, and B. W. Sobral, “Computational prediction of host-pathogen protein protein interactions,” Bioinformatics, vol. 23, no. 13, pp. i159–i166, 2007. [44] M. R. Guarracino and A. Nebbia, “Predicting
protein-protein interactions with k-nearest neighbors classification algorithm,” inComputational Intelligence Methods for Bioin-formatics and Biostatistics. Springer, 2009, pp. 139–150. [45] G. Xiaolong, J. Yan, and Q. Lu, “Study of decision tree in the
application of predicting protein-protein interactions,”Journal of Biomedical Engineering, vol. 5, p. 009, 2013.
[46] Y. Qi, J. Klein-Seetharaman, and Z. Bar-Joseph, “Random
forest similarity for protein-protein interaction prediction from multiple sources.” inPacific Symposium on Biocomput-ing. Pacific Symposium on Biocomputing, 2004, pp. 531–542. [47] Y. Murakami and K. Mizuguchi, “Homology-based predic-tion of interacpredic-tions between proteins using averaged one-dependence estimators,”BMC bioinformatics, vol. 15, no. 1, p. 1, 2014.
[48] O. Tastan, Y. Qi, J. G. Carbonell, and J. Klein-Seetharaman, “Prediction of interactions between hiv-1 and human proteins by information integration,” inPacific Symposium on Biocom-puting. Pacific Symposium on Biocomputing. NIH Public Access, 2009, p. 516.
[49] M. D. Dyer, T. Murali, and B. W. Sobral, “Computational pre-diction of host-pathogen protein–protein interactions,” Bioin-formatics, vol. 23, no. 13, pp. i159–i166, 2007.
[50] W. Li, L. Jaroszewski, and A. Godzik, “Clustering of highly homologous sequences to reduce the size of large protein databases,”Bioinformatics, vol. 17, no. 3, pp. 282–283, 2001. [51] ——, “Tolerating some redundancy significantly speeds up clustering of large protein databases,”Bioinformatics, vol. 18, no. 1, pp. 77–82, 2002.
[52] H. Peng, F. Long, and C. Ding, “Feature selection based on mutual information criteria of dependency, max-relevance, and min-redundancy,” Pattern Anal. Mach. Intell. IEEE Trans., vol. 27, no. 8, pp. 1226–1238, 2005.
[53] R. Fakoor, F. Ladhak, A. Nazi, and M. Huber, “Using deep learning to enhance cancer diagnosis and classifica-tion,” in Proceedings of the ICML Workshop on the Role of Machine Learning in Transforming Healthcare. Atlanta, Georgia: JMLR: W&CP, 2013.
[54] H. Chen, H. Zhao, J. Shen, R. Zhou, and Q. Zhou, “Super-vised machine learning model for high dimensional gene data in colon cancer detection,” inBig Data (BigData Congress), 2015 IEEE International Congress on. IEEE, 2015, pp. 134– 141.
[55] R. D. Finn, A. Bateman, J. Clements, P. Coggill, R. Y. Eberhardt, S. R. Eddy, A. Heger, K. Hetherington, L. Holm, J. Mistryet al., “Pfam: the protein families database,”Nucleic acids research, p. gkt1223, 2013.
[56] S. Mei and H. Zhu, “A novel one-class SVM based nega-tive data sampling method for reconstructing proteome-wide HTLV-human protein interaction networks.”Sci. Rep., vol. 5, p. 8034, 2015.
[57] Q. V. Le, “Building high-level features using large scale unsupervised learning,” inAcoustics, Speech and Signal Pro-cessing (ICASSP), 2013 IEEE International Conference on. IEEE, 2013, pp. 8595–8598.
[58] G. E. Hinton, S. Osindero, and Y.-W. Teh, “A fast learning algorithm for deep belief nets,”Neural computation, vol. 18, no. 7, pp. 1527–1554, 2006.
![Figure 1: 20 Basic Proteinogenic Types of Amino Acids [10]](https://thumb-us.123doks.com/thumbv2/123dok_us/383761.2542496/4.918.471.852.100.448/figure-basic-proteinogenic-types-amino-acids.webp)
![Table II: Physicochemical Properties for Amino Acids [11]](https://thumb-us.123doks.com/thumbv2/123dok_us/383761.2542496/5.918.83.449.308.606/table-ii-physicochemical-properties-for-amino-acids.webp)
![Figure 5: “is-a” Relationship in GO Terms [16]](https://thumb-us.123doks.com/thumbv2/123dok_us/383761.2542496/6.918.83.459.605.754/figure-is-a-relationship-in-go-terms.webp)
![Figure 6: Example from [36] for Local Descriptor](https://thumb-us.123doks.com/thumbv2/123dok_us/383761.2542496/9.918.474.845.440.588/figure-example-from-for-local-descriptor.webp)