Using Machine Learning Techniques to Classify
and Predict Static Code Analysis Tool Warnings
Enas A. Alikhashashneh, Rajeev R. Raje, and James H. Hill
Department of Computer and Information ScienceIndiana University-Purdue University Indianapolis Indianapolis, IN, USA
{ealikhas,rraje,hilljh}@iupui.edu
Abstract—This paper discusses our work on using software engineering metrics (i.e., source code metrics) to classify an error message generated by a Static Code Analysis (SCA) tool as a true-positive, false-positive, or false-negative. Specifically, we compare the performance of Support Vector Machine (SVM), K-Nearest Neighbor (KNN), Random Forests, and Repeated Incremental Pruning to Produce Error Reduction (RIPPER) over eight datasets. The performance of the techniques is assessed by computing the F-measure metric, which is defined as the weighted harmonic mean of the precision and recall of the predicted model. The overall results of the study show that the F-measure value of the predicted model, which is generated using Random Forests technique, ranges from 83% to 98%. Additionally, the Random Forests technique outperforms the other techniques. Lastly, our results indicate that the complexity and coupling metrics have the most impact on whether a SCA tool with generate a false-positive warning or not.
Index Terms—Static Code Analysis, Software Engineering Metrics, Machine Learning, Support Vector Machine, K-Nearest Neighbor, Random Forests, Feature Selection
I. INTRODUCTION
Static analysis examines program code without executing it to find potential defects that might arise at runtime. Tools based on static analysis are called Static Code Analysis (SCA) tools [1]. SCA tools usually report a variety of potential bugs that can be categorized into three main groups: true-positives, false-true-positives, and false-negatives [2] [3]. Many of the current SCA tools emit a large number of false-positive and false-negative warnings [4]. This drawback leaves developers reviewing a plethora of false-positive warnings manually to check if any of them may represent a potential bug or a security flaw. In the past, there have been several attempts to classify and predict the false-positive warnings by applying different Machine Learning (ML) techniques to the SCA tools warnings. For example, Yuksel et al. [5] applied 34 ML techniques over datasets containing 10 different artifact characteristics (i.e., Severity, Alert code, Life time, Developer idea, File name, Module name, Open alerts, Total alerts, Total alerts in module, Total alerts in file). Their results show they were able to classify 90% of warnings correctly. Likewise, Tripp et al. [6] proposed an interactive solution to address this problem through allowing the users (e.g., software developers) to classify a small subset of the SCA tool’s warnings into either actionable or spurious warnings. They then used this subset to train a statistical model that classified the remaining
warnings automatically. Such prior research efforts serve as evidence that ML techniques can be used to classify the output generated by SCA tools. None of the prior research, however, uses software engineering metrics as the determining factors for classifying the output generated by a SCA tool. For example, little is known about how software engineering metrics, like complexity and coupling, can be used to classify a SCA tool output (i.e., warning message) as a false-positive, true-positive, or false-negative. The aim of this research is to, therefore, evaluate how software engineering metrics can be used to classify the output of a SCA tool. Our proposed approach first generates a number of datasets by computing the values of different software engineering metrics using the Understand tool (https://scitools.com/) from the source code snippets. Second, we apply 4 different ML techniques to create a classifier, or predictive model. Lastly, we apply the model to unknown source code. Hence, the main contributions of this paper are:
1) It shows how we use ML and data mining techniques along with a collection of software engineering metrics to predict if the source code will lead the SCA tool to emit either true-positive, false-positive, or false-negative warnings; and
2) It evaluates which of software engineering metrics are highly correlated with the true-positive, false-positive, and false-negative warnings generated by a SCA tool. To evaluate our approach, we use 7 CWEs from the Juliet test suite for C++ [7] and two different SCA tools. Our experimental results show that the Random Forests technique achieved 83%–98% F-measure, which is the weighted har-monic mean of the precision and recall. Additionally, our experimental results indicate that complexity degree and cou-pling between the functions in a given source code impact a SCA tool’s performance.
Paper organization. The remainder of this paper is orga-nized as follows: Section II discusses the general approach for this research; Section III explores different ML techniques. Section IV illustrates the Case Study that we use to evaluate the proposed approach. Section V presents our experimental results and a discussion of the results; Section VI compares our work to other related works, and Section VII provides concluding remarks and lessons learned.
____________________________________________________
This is the author's manuscript of the article published in final edited form as:
Alikhashashneh, E. A., Raje, R. R., & Hill, J. H. (2018). Using Machine Learning Techniques to Classify and Predict Static Code Analysis Tool Warnings. 2018 IEEE/ACS 15th International Conference on Computer Systems and Applications (AICCSA), 1–8. https://doi.org/10.1109/AICCSA.2018.8612819
II. RESEARCHMETHODOLOGY
In order to classify the warnings created by SCA tools based on the software engineering metrics (i.e., source code metrics) new datasets have been created and a set of ML techniques have been utilized in the proposed approach. Fig. 1 indicates the overview of our approach. As shown in this figure, our approach includes two stages. In the first stage, we generate a number of datasets by analyzing a given source code in two different ways; first, we compute the software engineering metrics such as volume, complexity, and object-oriented metrics. Second, we extract the SCA tools’ warnings by utilizing a framework called Static Code Analysis Tool Evaluator (SCATE) [2]. In the second stage, we utilize four of the common ML techniques. Our proposed approach, however, is not limited to only the 4 ML techniques discussed in this paper. 6&$7( )UDPHZRUN &RGH %DVH 8QGHUVWDQG 6WDWLF 7RRO XVH!! 'DWD6HW 6WDJH 'DWD VHW JHQHUDWLRQ SKDVH 3UH SURFHVVLQJ 6WDJH /HDUQLQJ SKDVH 0RGHO 7UDLQLQJ 'DWD VHW 7HVWLQJ 'DWD VHW 3UHGLFDWH FUHDWH 5HVXOWV 'DWD6HW
Fig. 1. The overview of the proposed approach.
A. Dataset Generation Stage
In order to apply the ML techniques on a given source code, we have to follow a set of important steps:
1) Extract SCA tools’ warnings. To extract the class val-ues (i.e., true-positive, false-positive, and false-negative), we use SCATE [2], which is an open-source framework for evaluating the quality of a SCA tool based on the number of true-positives, positives, and false-negatives it generates. This framework was extended to evaluate more open-source and commercial SCA tools either by running them locally or remotely in the SWAMP, which is an open-resource cloud environment that allows the developers to test and assess the security of their source code through a wide range of open-source and commercial SCA tools [8]. The main reason for
using this framework in our research, is to run the SCA tools against Juliet test suite for the C++ language to highlight source code snippet that causes the SCA tool to:
a) Uncover the target security flaws in either the bad function or in the bad class implementation (aka true-positive tag),
b) Report that there is a flaw while in reality there is not one (aka false-positive tag), or
c) Report that there is no flaw while in reality there is one (aka false-negative tag).
These tags will represent class variable value in the generated dataset. Furthermore, the highlighted source code snippets will be used as inputs to the next step. 2) Compute software engineering metrics. To extract
the most important attributes, or features, from a given source code, we integrated SCATE with the Understand tool (https://scitools.com/). Understand is a static analy-sis tool focused on source code comprehension, metrics, and standards testing. We use the Understand tool by executing it against the highlighted source code snippet from the Juliet test suite to compute different software engineering metrics at the file and function-level. The software engineering metrics (see Section IV-D) are then integrated back into the SCA tool report managed by SCATE. Our proposed approach, however, is not limited to only using the Understand tool, but is generic in nature.
The output of this stage is a numerical dataset, which corre-sponds to the contents of a data matrix, where every column of the matrix represents a particular software engineering metric. The last column, however, represents a class value (i.e, true-positive (which is represented by 1), false-true-positive (which is represented by 2), and false-negative (which is represented by 3)). Likewise, each row in the matrix corresponds to a given function in the source code. The dataset is, therefore, a multi-class dataset. However, in some special cases, when the SCA tool generates only two type of tags, or classes, the generated dataset will be a binary dataset.
B. Learning Stage
The main goal of this stage is to build a classifier (i.e., statistical model) by applying a set of ML techniques to the datasets generated in Stage 1 (see Section II-A). The classifier is then used to predict a classification value for unknown source files. Another important goal of this stage is to learn which software engineering metrics are correlated with true-positive, false-true-positive, and false-negative warnings generated by a SCA tool. This stage includes three phases:
1) Preprocessing. The generated dataset contains a set of data points representing a function that will cause the SCA tool to generate a true-positive, false-positive, or false-negative message. The data points are represented by a collection of software engineering metrics that measure a function’s complexity, coupling, function’s
cohesion, and other metrics. Unfortunately, a SCA tool can generate more than one warnings (i.e., false-positive, false-negative, and true-positive) for the same function. This can result in contradicting data points in the gen-erated datasets. To address this problem, we remove the contradicting data points as Hern´andez et al. [9] suggest. The preprocessing phase also consists of (1) normalizing the values of the features/attributes, and (2) feature selection using Correlation-based Feature Selection (CFS) technique [10].
2) Model Learning. This phase involves constructing a classifier by using the training dataset and by examining four of the ML techniques: SVM [11], KNN [12], Random Forests [13], and RIPPER [14].
3) Prediction. The generated classifiers (from the model Learning phase) are used to predict whether a function in unknown source code will cause a SCA tool to generate a true-positive, false-positive, or false-negative message based on the value of software engineering metrics for the corresponding function.
III. MACHINELEARNINGTECHNIQUES
In this section, we briefly discuss the ML techniques used in our study.
A. Feature Selection
In our work, feature selection is important because it filters redundant and the inefficient software engineering metrics. We use the Correlation-based Feature Selection (CFS) tech-nique [10] to identify the most significant software engineering metrics. The CFS technique searches all the combinations of the software engineering metrics to find the best com-bination of the metrics [10]. The CFS technique evalu-ates the correlation between the software engineering metrics and the class. The selected software engineering metrics are highly correlated with the class and less correlated amongst themselves. To do that, the CFS technique uses the Pearson coefficient [15], where a high value, or correlation, indicates the best combination of software engineering metrics.
B. Synthetic Minority Over-sampling Technique (SMOTE)
SCA tools generate a large number of false-positive and false-negative warnings, which results in generating datasets that have a disproportionate ratio of true-positive, false-positive, and false-negative warnings, or classes. This problem is known as unbalanced data [16]. To solve this problem and enhance the classifier’s ability, we used the SMOTE technique [17] to balance both the training and testing dataset. The SMOTE technique balances the binary dataset (in our case: CWE252-Tool2 and CWE457-Tool2 see Section V-A) by adjusting the class distribution of a dataset. We apply the SMOTE on our multi-class datasets by following the strategy, proposed by Fernandez et al. [18], in two steps. First, we use the binarization schemes, such as one versus one (OVO), to transform the multi-class dataset into a set of binary datasets. Second, we apply the SMOTE approach on
each binary dataset to solve the imbalance problem. However, using the oversampling technique, such as SMOTE, to balance the datasets may cause overfitting problem. To overcome this problem, we use the cross-validation technique [19].
C. Classification Techniques
We selected four kinds of classification techniques for our study: instance-based learning, ensemble learning, rule-based learning, and statistical learning. The techniques are used as benchmarking algorithms to learn and predict the SCA tools warning for a given source code based on its corre-sponding software engineering metrics. We also selected ML techniques that have successfully been used in the software defect detection field [20] [21]. We used the Weka Machine Learning workbench (https://www.cs.waikato.ac.nz/ml/weka/) to train and test the selected ML techniques. Table I presents the summary of the 4 ML techniques we used in the study.
TABLE I
DESCRIPTION OFMACHINELEARNINGTECHNIQUESUSED INSTUDY
Machine Learn-ing Technique
Description
K-Nearest Neighbor (KNN)
It is an instance-based learning algorithm that gen-eralizes the training data when the time comes to predict a new data point rather than when the training dataset is processed [12].
Support Vector Machine (SVM)
It is developed from statistical learning to build a su-pervised learning model from either binary datasets or class datasets. In this study, for the multi-class datasets, we use OVO and binary SVM tech-nique to predict the SCA tool warning [11]. Random Forests
(RF)
It is an ensemble learning method that constructs a series of unpruned classification trees from bootstrap functions and software engineering metrics of the training dataset. The predicted SCA tool warning is determined using the majority vote as a decision rule [13]. Repeated Incremental Pruning to Produce Error Reduction (RIPPER)
It is a rule induction algorithm that generates the initial set of rules for the minority class using incre-mentally reduced error. These rules must cover all the functions of that class. Afterward, the algorithm fills up to the next class and repeats the same steps until all the classes have been covered [14].
IV. CASESTUDY FOR TESTING PURPOSES
We use the following case study to evaluate the effectiveness of the proposed approach.
A. Selected SCA Tools
We used an open source and a commercial tool for evalu-ating our work. Since most source code in the Juliet test suite is written in C/C++ and Java, we selected tools that supported at least one of these two languages. The selected SCA tools are listed below1:
1) Tool1. An open-source SCA tool that uses Lexical analysis to find the flaws in C++ source code. Lexical analysis matches the tokenized source code with a list of checkers, and reports if it finds a suspicious pattern.
Ignoring the data flow of the source code causes the Tool1 to not able to detect the vulnerabilities, which are caused by the invalidated external input.
2) Tool2. A commercial SCA tool that analyzes both the source code and binaries. To find the flaws in C++ and Java source code, Tool2 builds an abstract model from the source code and then the symbolic execution engine explores the source code to test every execution path and the variables to find the flaws.
We selected an open-source SCA tool because it is freely available and can be used as a base case in order to compare it with a commercial SCA tool. On the other hand, we selected a commercial SCA tool because the commercial tools are usually considered to be more trustworthy than the open-source tools [22].
B. Test Cases (Source Code)
We run each SCA tool against the Juliet test suite for C++ to generate the true-positive, positive, and false-negative warnings. The test suite was created by the Na-tional Security Agency’s (NSA) Center for Assured Software (CAS) to evaluate the SCA tools ability. The NIST Juliet suite contains 61,387 test cases covers 118 CWEs (Common Weakness Enumeration), which aim to create a catalog of software weaknesses and vulnerabilities [7].
C. Weaknesses
In this study, we focus on the following CWEs as they have a bigger dataset for SCA tools’ warnings when compared to the other weaknesses (see Section V-A) [23]:
1) CWE-252: Unchecked Return Value. This weakness happens when the software does not check the return value from the function. This weakness may lead to prevent the software from detecting unexpected states and conditions.
2) CWE-369: Divide by Zero.There are two reasons for this weakness; first one is when an unexpected value is provided to the product. The second reason is, if an error occurs that is not properly detected.
3) CWE-415: Double Free.This weakness happens when the product calls free() twice on the same memory address. This weakness may lead to modification of unexpected memory locations.
4) CWE-457: Use of Uninitialized Variable.This weak-ness happens when the source code uses a variable that has not been initialized. This weakness may lead to unpredictable or unintended results.
5) CWE-426: Untrusted Search Path. This weakness happens when the software looks out for critical re-sources using an externally-supplied search path that can point to resources that are not under the application’s direct control.
6) CWE-762: Mismatched Memory Management Rou-tines. This weakness happens when the application attempts to return a memory resource to the system, but it calls a release function.
7) CWE-476: NULL Pointer Dereference.This weakness happens when the application dereferences a pointer that it expects to be valid, but it is NULL. This weakness may lead to crash or exit.
void bad() { int ∗ptr = NULL;
/∗ FLAW: Dereferencing of the null pointer ’ ptr ’ ∗/
if (∗ptr == 17)
cout <<(”ptr = 17”)<<endl; return 0;
}
Listing 1. CWE-476 Example [24].
Listing 1 shows that the analyzer has to identify the frag-ment of code that uses a null pointer. In the if condition, there is a logical error that leads to dereferencing of the null pointer. The error may be introduced into the code during code refactoring or through a misprint [24]. SCA tools may be able to correctly detect these CWEs, and might also report a set of false-positive and false-negative warnings, which reduces the usability of the SCA tools. Like-wise, going through all the false-positive warnings manually, in order to check if the SCA tool correctly detects a real weakness in the source code, will consume a lot of developer time. Moreover, the proposed approach is not restricted to a specific number or type of CWEs.
D. Selected Software Engineering Metrics
As indicated earlier, we compute the source code metrics using the Understand tool at the function-level. We do this because we are interested in predicting the behavior of a SCA tool based on how the given function was written not how the whole file was written. For this reason, twenty-one software engineering metrics, which are supported by the Understand tool, are selected to generate the datasets. Table II shows a brief description for these metrics. However, our proposed approach is not restricted to the selected CWEs or SCA tools. Furthermore, we believe that the proposed approach can work for multiple SCA tools and for different weakness types.
V. RESULTS ANDDISCUSSIONS
This section evaluates the effectiveness of the selected ML techniques. This section also analyzes their performance using the F-measure.
A. Experiment Setup
In all the experiments, we have adopted a 10-fold cross-validation as a cross-validation method to address the overfitting problem and to obtain a realistic insight about the prediction of the model. In 10-fold cross-validation, the dataset is randomly divided into 10 folds—each one containing the 10% of the data points of the dataset. This means that nine folds were used for training and one fold was used for testing. This procedure is repeated ten times and the final performance value for each ML model is averaged [19]. Table III summarizes the properties of the generated datasets that we used in our experiments. This table shows the number of data points, the
TABLE II
DESCRIPTION OFSOFTWAREENGINEERINGMETRICS[25]. Software
Engi-neering Metric
Description
CountInput It computes the FanIn for a given function. CountOutput It computes the FanOut for a given function. Knots It reflects the structural complexity of a given source
code by measuring the overlapping jumps CountLineCode It reflects the total number of lines that contain
source code only in a given function Count Line Code
Exe
It reflects the total number of lines containing exe-cutable source code in a given function.
CountPath It reflects the total number of unique paths in a given function.
Essential It reflects the structural complexity of a given source code after replacing all the control-flow structure with a single statement.
Cyclomatic It reflects the structural complexity of the given source code based on the control-flow structures in a given source .
Cyclomatic Strict It reflects the structural complexity of a given source code based on the control-flow structures with the logical conjunction and logical AND in the condi-tional expression.
Cyclomatic Mod-ified
It reflects the structural complexity of a given source code based on the control-flow structures and by counting each decision in a multi-decision structure. MaxNesting It reflects the maximum nesting level of the
control-flows such as for, while, and if.
Min Knots It reflects the minimum knots after structured pro-gramming constructs have been removed.
Max Knots It reflects the maximum knots after structured pro-gramming constructs have been removed.
Comment to Code Ratio
It computes the ratio of the number of comment lines to the number of code lines.
Blank Lines of Code (+ Inactive)
It reflects the number of blank lines, including in inactive regions.
Blank Lines of Code (BLOC)
It reflects the number of blank lines, excluding in inactive regions.
Declarative Lines of Code
It reflects the number of lines containing declarative source code. Likewise, this metric counts a line that is declarative and executable.
Lines with Com-ments (CLOC)
It reflects the number of lines containing a comment. It can overlap with other code counting metrics. Inactive Lines It reflects the number of lines that are inactive from
the view of the preprocessor. Preprocessor
Lines
It reflects the number of preprocessor lines. CountDeclFunction It reflects the number of functions in the file.
number of features, and the number of classes for each dataset. A majority of the datasets used in this study have either two classes (i.e., true-positive and false-positive) or three classes (i.e., true-positive, false-positive, and false-negative).
B. Performance Evaluation Metric
We have carefully selected a suitable performance measure that examines the strength and the predictive ability of the developed models. SCA tools generate a large number of false-positive and false-negative warnings and the generated datasets have a disproportionate ratio of the true-positive, false-positive, and false-negative classes. This problem is known asunbalanced data. In such a case, when we create a classification model, we will get a high accuracy metric value (such as 90%). But, this accuracy value is only reflecting the
TABLE III
SUMMARYDESCRIPTION OF THE DATA SETS.
Data set #DataPoints #Features #Classes
CWE369-Tool1 1836 22 3 CWE476-Tool1 805 22 3 CWE762-Tool1 7277 22 3 CWE252-Tool2 1263 22 2 CWE369-Tool2 11186 22 3 CWE415-Tool2 10388 22 3 CWE426-Tool2 1064 22 3 CWE457-Tool2 9165 22 2
underlying class distribution. This problem is calledaccuracy paradox. For this reason, it is better to avoid using accuracy as the metric to assess the performance of the predictive models [26]. The precision and recall are commonly used as a performance measure in an unbalanced dataset problem [27]. However, there is a trade-off between the precision and recall. Thus it is, therefore, better to use theF-measure, which selects the best model based on the balance between the precision and recall, as a performance measure for our comparative needs.
C. CFS Results Analysis
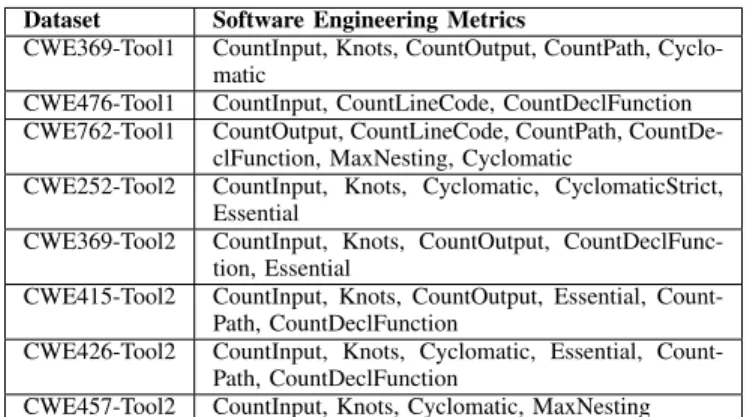
For our research, we are interested in building a classi-fier model that can predict the SCA tool warnings for a given function, but we also interested in finding which of the software engineering metrics are highly correlated with the true-positive, false-positive, and false-negative warnings. Table IV shows the relevant software engineering metrics that we identified in each dataset after applying CFS to it. The most frequent selected software engineering metrics among the eight datasets were: CountInput, Knots, CountOutput, CountPath, Cyclomatic, and Essential.
TABLE IV
RELEVANTSOFTWAREENGINEERINGMETRICS.
Dataset Software Engineering Metrics
CWE369-Tool1 CountInput, Knots, CountOutput, CountPath, Cyclo-matic
CWE476-Tool1 CountInput, CountLineCode, CountDeclFunction CWE762-Tool1 CountOutput, CountLineCode, CountPath,
CountDe-clFunction, MaxNesting, Cyclomatic
CWE252-Tool2 CountInput, Knots, Cyclomatic, CyclomaticStrict, Essential
CWE369-Tool2 CountInput, Knots, CountOutput, CountDeclFunc-tion, Essential
CWE415-Tool2 CountInput, Knots, CountOutput, Essential, Count-Path, CountDeclFunction
CWE426-Tool2 CountInput, Knots, Cyclomatic, Essential, Count-Path, CountDeclFunction
CWE457-Tool2 CountInput, Knots, Cyclomatic, MaxNesting
D. Evaluation Results
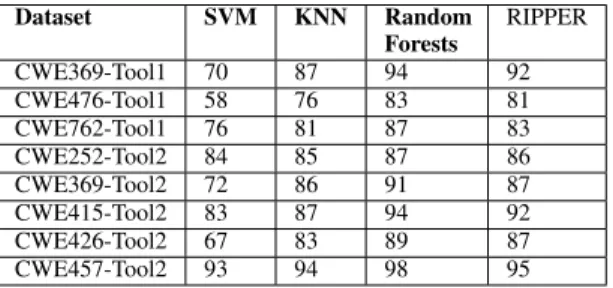
Table V presents the F-measures for the eight datasets and four classification techniques after using CFS to select the most important software engineering metrics. As shown in this table, we can observe that the Random Forests technique is better than the other ML techniques at predicting the functions
that force the SCA tools to emit either the true-positive, false-positive, or false-negative warnings. For example, for the CWE369-Tool1 dataset, the Random Forests can correctly predict 94% of the given functions which warnings the SCA tool will emit, while the RIPPER can correctly predict 92% of these functions. Likewise, KNN and SVM predict correctly 87% and 70% what warnings the given function will force the SCA tool to emit.
TABLE V
EXPERIMENTALRESULTSBASED ONF-MEASURE METRIC.
Dataset SVM KNN Random Forests RIPPER CWE369-Tool1 70 87 94 92 CWE476-Tool1 58 76 83 81 CWE762-Tool1 76 81 87 83 CWE252-Tool2 84 85 87 86 CWE369-Tool2 72 86 91 87 CWE415-Tool2 83 87 94 92 CWE426-Tool2 67 83 89 87 CWE457-Tool2 93 94 98 95
The results show that predicted models generated using the Random Forests and RIPPER techniques have F-measure greater than 80% corresponding to most of the datasets. On the other hand, the predicted models that generated using SVM technique have a low value of F-measure among the multi-class datasets. However, SVM technique has a high F-measure (i.e., larger than 80%) among the binary datasets.
The F-measures of the Random Forests models were be-tween 83% - 98% in the eight datasets. The results show that the Random Forests is better than the other ML techniques. It also demonstrates that the Random Forests is the most effective in SCA tool warnings prediction. One reason that the Random Forests technique has better performance is that the Random Forests technique works especially well on large datasets [28] such as CWE415-Tool2. Another reason is that the CFS selects the optimal subset of software engineering metrics and passes them to Random Forests. This means Ran-dom Forests uses the optimal subset of software engineering metrics—giving it a better F-measure score in classifying the SCA tool warnings.
The SVM technique was not able to do well in one dataset of the Tool1 (CWE476-Tool1), where the F-measure value is only 58%. This is because the SVM technique was not able to make an accurate prediction of the SCA tool warnings on the basis of only the volume (e.g., CountDeclFunction and Count-LineCode) and object-oriented metrics (e.g., CountInput).
E. RIPPER Results Analysis
As shown in the experimental results, the RIPPER comes in second place after the Random Forests in achieving high predicting performance. In this section, we display an example of the RIPPER rules learned from the CWE426-Tool2 dataset, and how we try to interpret these rules. Fig. 2 shows sample rules for the Tool2, which are as follows:
1) If the given source code (function) has a FanIn value larger than or equal 2 (which means that the total number
&RXQW,QSXW ! &RXQW3DWK !
¬¬ 7UXH 3RVLWLYH $OWHU
&RXQW,QSXW ! (VVHQWLDO !
(VVHQWLDO ¬ 7UXH 3RVLWLYH $OWHU &RXQW,QSXW ! .QRWV ¬ 7UXH 3RVLWLYH $OWHU
.QRWV ! ¬
&RXQW'HFO)XQ (VVHQWLDO ! ¬ )DVOH 1HJDWLYH $OWHU )DVOH 1HJDWLYH $OWHU )DVOH 3RVLWLYH $OWHU
Fig. 2. CWE426-Tool2 Datase Sample of Rules.
of parameters and global variables that are used in the function is greater than or equal to 2), and also the given function has at least 2 unique paths, then Tool2 can find the existing security flaw in the given function. 2) If the given source code (function) has a FanIn value
larger than or equal 2 (which means that the total number of parameters and global variables that are used in the function is greater than or equal to 2), and also the given function has a complexity larger than or equal to 1 and less than or equal to 2 after all the control-flow structures are replaced with a single statement, then Tool2 can find the existing security flaw in the given function. 3) If the given source code (function) has a FanIn value
larger than or equal 2 (which means that the total number of parameters and global variables that are used in the function is greater than or equal to 2), and also the given function complexity (Knots) equals zero, then Tool2 can find the existing security flaw in the given function. 4) If the number of the function in the given source code
equals one and the given source code has a complexity at least 1 after all the control-flow structures are replaced with a single statement, then Tool2 cannot find the existing security flaw in the given function.
5) If the number of the overlapping jumps (i.e., for the corresponding source code, Knots equals to the number of crossing of the lines that determine where every jump in the flow of control occurs) in the given source code(function) larger than zero, then Tool2 cannot find the existing security flaw in the given function. Lastly, if there exists a data point, or source code, that does not meet the conditions of the previous rules, then the predic-tive model assigns the majority class in the dataset, which is a false-positive warning. In other words, the predictive model assumes that the Tool2 will report that there is a security flaw in the given source code, while in reality there is no one. From the previous rules, we can conclude that Tool2 can find the defect, or the flaw, in the given function that has a high degree of FanIn. On the other hand, the ability of the Tool2 in finding the defects in the given function will be reduced when the source code has a high degree of complexity. In this situation, we can infer that the value of the software engineering metrics for the given function affects on the ability of the SCA tool in finding the potential defects in the source code.
Fig. 3 shows sample rules for the Tool1, which are as follows:
1) If the given source code (function) has a FanIn value lower than or equal 2 (which means that the total number
¬ ¬ &RXQW2XWSXW ¬ ¬ DQG ¬ &RXQW3DWK ! ¬ ¬ ¬ ¬DQG &RXQW3DWK ¬ DQG &RXQW,QSXW ¬ ¬ ¬ ¬ ¬
7UXH 3RVLWLYH $OWHU
&\FORPDWLF ! DQG .QRWV ¬ ¬ 7UXH 3RVLWLYH $OWHU
&RXQW2XWSXW ! DQG .QRWV ¬ ¬ ¬DQG .QRWV ! ¬ ¬
)DOVH 3RVLWLYH $OWHU
)DOVH 1HJDWLYH $OWHU
Fig. 3. CWE369-Tool1 Dataset Sample of Rules.
of parameters and global variables that are used in function is less than or equal to 2), on the other hand, if the given function has a FanOut value less than or equal to 1. Likewise, if the given function has at most 3 unique paths then the Tool1 can find the existing security flaw in the given function.
2) If the number of crossing of the lines that determine where every jump in the flow of control occurs in the given function equal zero. Also, if the complexity of the given function larger than or equal 5, then Tool1 can find the existing security flaw in the given function. 3) If the given function has a FanOut value larger than or
equal 2, and the Knots metric value ranges from 1 to 6, then Tool1 will generate a fake warning.
If there exists a data point, or function, that does not meet the conditions of the previous rules the predictive model assigns the majority class in the dataset, which is a false-negative warning. In other words, the predictive model assumes that the Tool1 will not report that there is a security flaw in the given source code when in reality there is one. From the previous rules, we can conclude that Tool1 can find the defect in the given function if it has a low degree of coupling (FanIn and FanOut). On the other hand, Tool1 will generate a false warning when the given function has a high degree of FanOut. In this situation, we can infer that the value of the software engineering metrics for the given function affects the ability of the SCA tool in finding the potential defects in the source code. For example, Tool2 cannot highlight the potential defects when the given source code has a high degree of Knots.
Due to a large number of decision trees that the Random Forests technique builds for each dataset (i.e., for the first dataset in Table III the Random Forests technique creates more than 50 decision trees.), we cannot list and describe the results for each developed model by the Random Forests technique.
F. Threats to Validity
For this work, the threats to validity are related to the soft-ware engineering metrics computed by Understand. In most of the software engineering tools, the metrics are computed either at a file or at a function level. We have computed metrics at the function level, which leads results in generating contradictory data points in the datasets. Another threat to validity is the generalization of the results of the proposed approach. We have analyzed 7,508 test cases from the Juliet test suite for C/C++, which may not truly represent real-world source code. We will work to address these threats in our future work (see Section VII).
VI. RELATEDWORK
Barstad et al. [29] investigated if they can predict the quality of the source code based on the static metrics’ value (e.g., McCabe Cyclomatic Complexity and Halsted metrics) using ML techniques (e.g., Naive Bayes (NB), KNN, and decision tree). In their work, the source code was classified as ”well written” or ”badly written”. Based on their results, the NB out-performs the other classifiers. Our work differs their work in three main ways. First, our work investigates the relationship between the SCA tools’ warnings and the software engineering metrics. Second, we evaluate the proposed approach against seven CWEs using two SCA tools, while Barstad et al. used the SCA tools to compute the metrics value only. Lastly, they apply ML techniques to predict the source code quality; while in this work we predict how the SCA tool will behave on the given source code. Yuksel et al. [5] proposed an approach to reduce the number of the false-positive warnings that are emitted by SCA tools by applying 34 ML techniques over datasets containing 10 different artifact characteristics. They conclude that the ML techniques can be a useful approach to classify the SCA tools’ warnings because they achieved 87% accuracy. Our work is similar to their work in that we want to reduce the number of false-positive warnings. The main difference between their work and our work, however, is that we use the source code characteristic to predict the SCA tool behavior (i.e., the SCA tool will generate true-positive, false-positive, or false-negative warnings) on the source code. Koc et al. [30] trained both a Bayesian classifier and a long short-term memories (LSTM) neural network on bytecode instructions to predicate the false positive warnings. In our work, we train our models on the source code, not on bytecode instructions, which are simplified and easier to analyze with ML techniques as compared to the source code. On the other hand, we evaluate which metrics are highly correlated with each type of warning generated by the SCA tool, while in their work the authors evaluated which source code structures force the SCA tools to generate false positive warnings. Reynolds et al. [31] identified and documented 14 of different kinds of false positive patterns, by running three of SCA tools against C/C++ Juliet test suite. Then the authors reduced the source code manually in order to remove the unrelated instructions. In our work, we run a number of ML techniques and infer which of software engineering metrics are related to each type of SCA tools’ warnings. Lastly, Tripp et al. [6] tackled the problem of false-positive warnings by combining the SCA tool user interaction with ML techniques. For example, users classify some of SCA tool warnings into either actionable or spurious. Based on the user input the ML techniques predict the remaining SCA tool warnings automatically. In our work, we do not consider user interaction to classify the SCA tool warnings. We will consider the user interactions in future work.
VII. CONCLUDINGREMARKS
In this paper, we proposed a learning approach to explore two main questions. First, which software engineering metrics cause the SCA tool to report true-positive, false-positive,
and false-negative warnings? Second, can we use the ML techniques to predict the type of the warning the SCA tool will emit for the given source code based on the software engineering metrics? To answer both questions, we generated various datasets after using SCATE to highlight source code that causes the SCA tools to emit either true-positive, false-positive or false-negative warnings. We then integrated the results generated by the Understand tool for the corresponding source code. Lastly, a classification model was built from the generated datasets by applying feature selection technique and a variety of ML techniques (e.g., SVM, KNN, Random Forests, and RIPPER). Based on our research effort, we learned the following:
1) The overall results show that the performance of the Random Forests technique is the best on average across the other examined ML techniques. Its average F-measure is 90.4%, while the performance of the RIPPER technique is the second best one. Its average F-measure is 87.7%.
2) The CountInput, Knots, CountOutput, CountPath, Cy-clomatic, and Essential were considered as the most important software engineering metrics over the eight datasets to predict the behavior of SCA tools against a given source code.
3) False-positive and false-negative warnings can be re-duced if the developers rewrite their source code in a way that reduces source code complexity, coupling, and usage of global variables.
4) The ML techniques that achieve high performance can be applied against new and different test cases that have the same nature and structure.
For future research efforts, we will apply our approach to source code from various open-source and commercial software projects. Likewise, we are planning to compute the software engineering metrics at the line level in order to reduce the number of contradictory data points in the generated datasets. Lastly, we plan to extend our approach by covering more SCA tools and using other advanced ML techniques.
ACKNOWLEDGMENT
This paper was sponsored in part by grant KT-1600071C-IU Kestrel Technology and D15PC00169 from the Department of Homeland Security (DHS).
REFERENCES
[1] I. Gomes, P. Morgado, T. Gomes, and R. Moreira, “An overview on the static code analysis approach in software development,” 2010. [2] E. Alikhashashneh, R. Raje, and J. Hill, “Using software engineering
metrics to evaluate the quality of static code analysis tools,” in Pro-ceedings of the 1st International Conference on Data Intelligence and Security, 2018.
[3] L. M. R. Velicheti, D. C. Feiock, M. Peiris, R. Raje, and J. H. Hill, “Toward modeling the behavior of static code analysis tools,” in Proceedings of the 9th Cyber and Information Security Research Conference, 2014.
[4] B. Johnson, Y. Song, E. Murphy-Hill, and R. Bowdidge, “Why don’t software developers use static analysis tools to find bugs?” in Proceed-ings of the 2013 International Conference on Software Engineering, 2013.
[5] U. Yuksel and H. S¨ozer, “Automated classification of static code analysis alerts: A case study.” inICSM, 2013.
[6] O. Tripp, S. Guarnieri, M. Pistoia, and Y. A. Aravkin, “ALETHEIA: improving the usability of static security analysis,” in Proceedings of the 2014 ACM SIGSAC Conference on Computer and Communications Security, 2014.
[7] Center for Assured Software, National Security Agency, “Juliet Test Suite v1.1 for C/C++ User Guide.”
[8] M. Livny and B. Miller, “The Case for an Open and Evolv-ing Software Assurance Framework,” http://continuousassurance.org/ wp-content/uploads/2013/11/White-Paper-Evolving-Framework.pdf. [9] M. Hern´andez and S. Stolfo, “Real-world data is dirty: Data cleansing
and the merge/purge problem,”Data Min. Knowl. Discov., 1998. [10] M. Hall, “Correlation-based feature selection for machine learning,”
Ph.D. dissertation, Department of Computer Science, University of Waikato, Hamilton, New Zealand, 1999.
[11] I. Steinwart and A. Christmann,Support Vector Machines. Springer Publishing Company, Incorporated, 2008.
[12] B. Dasarathy,Nearest Neighbor (NN) Norms: Nn Pattern Classification Techniques. IEEE Computer Society Press, 1991.
[13] L. Breiman, “Random forests,”Mach. Learn., no. 1, pp. 5–32, 2001. [14] A. Rajput, R. P. Aharwal, M. Dubey, S. Saxena, and M. Raghuvanshi,
“J48 and jrip rules for e-governance data,” International Journal of Computer Science and Security (IJCSS), 2011.
[15] J. Benesty, J. Chen, Y. Huang, and I. Cohen, Pearson Correlation Coefficient. Springer Berlin Heidelberg, 2009, pp. 1–4.
[16] V. Ganganwar, “An overview of classification algorithms for imbalanced datasets,”International Journal of Emerging Technology and Advanced Engineering, 2012.
[17] N. V. Chawla, K. W. Bowyer, L. O. Hall, and W. P. Kegelmeyer, “Smote: Synthetic minority over-sampling technique,”J. Artif. Int. Res., 2002. [18] A. Fern´andez, V. L´opez, M. Galar, M. del Jesus, and F. Herrera,
“Analysing the classification of imbalanced data-sets with multiple classes: Binarization techniques and ad-hoc approaches,” Knowledge-Based Systems, 2013.
[19] M. Stone, “Cross-validatory choice and assessment of statistical predic-tions,”Journal of the Royal Statistical Society, 1974.
[20] K. O. Elish and M. O. Elish, “Predicting defect-prone software modules using support vector machines,”Journal of Systems and Software, 2008. [21] A. Younis, Y. Malaiya, C. Anderson, and I. Ray, “To fear or not to fear that is the question: Code characteristics of a vulnerable functionwith an existing exploit,” in Proceedings of the Sixth ACM Conference on Data and Application Security and Privacy, 2016.
[22] N. Ayewah, D. Hovemeyer, J. D. Morgenthaler, J. Penix, and W. Pugh, “Using static analysis to find bugs,”IEEE software, 2008.
[23] The Common Weakness Enumeration (CWE) Initiative, MITRE Corpo-ration. http://cwe.mitre.org/.
[24] “Cwe-476: Null pointer dereference,” https://cwe.mitre.org/data/ definitions/476.html, accessed: 2017-09-15.
[25] “scitools,” https://scitools.com/, accessed: 2018-03-15.
[26] S. Kotsiantis, D. Kanellopoulos, and P. Pintelas, “Handling imbalanced datasets: A review,” GESTS International Transactions on Computer Science and Engineering, 2006.
[27] M. Bekkar, H. K. Djemaa, and T. A. Alitouche, “Evaluation measures for models assessment over imbalanced data sets,”Journal of Information Engineering and Applications, 2013.
[28] G. Anderson, “Random relational rules,” Ph.D. dissertation, Department of Computer Science, University of Waikato, Hamilton, New Zealand, 2009.
[29] V. Barstad, M. Goodwin, and T. Gjø sæter, “Predicting source code quality with static analysis and machine learning,”Norsk Informatikkon-feranse, 2014.
[30] U. Koc, P. Saadatpanah, J. S. Foster, and A. A. Porter, “Learning a Classifier for False Positive Error Reports Emitted by Static Code Analysis Tools,” inWorkshop on Machine Learning and Programming Languages, 2017.
[31] Z. P. Reynolds, A. B. JayanthIndiana, U. Koc, A. A. Porter, R. R. Raje, and J. H. Hill, “Identifying and documenting false positive patterns generated by static code analysis tools,” in Proceedings of the 4th International Workshop on Software Engineering Research and Industrial Practice, 2017.