Clemson University
TigerPrints
All Theses Theses
12-2017
Live Load Distribution Factors and UHPC Shear
Key Performance of SCDOT NEXT D Beam and
Solid Slab Bridges
Francis Vincent Filosa
Clemson University
Follow this and additional works at:https://tigerprints.clemson.edu/all_theses
This Thesis is brought to you for free and open access by the Theses at TigerPrints. It has been accepted for inclusion in All Theses by an authorized administrator of TigerPrints. For more information, please [email protected].
Recommended Citation
Filosa, Francis Vincent, "Live Load Distribution Factors and UHPC Shear Key Performance of SCDOT NEXT D Beam and Solid Slab Bridges" (2017).All Theses. 2795.
LIVE LOAD DISTRIBUTION FACTORS AND UHPC SHEAR KEY PERFORMANCE OF SCDOT NEXT D BEAM AND SOLID SLAB BRIDGES
A Thesis Presented to the Graduate School of
Clemson University
In Partial Fulfillment
of the Requirements for the Degree Master of Science
Civil Engineering
by
Francis Vincent Filosa December 2017
Accepted by:
Thomas E. Cousins, Committee Chair Brandon E. Ross
ABSTRACT
For short to medium span bridges experiencing lower average daily traffic (ADT), the South Carolina Department of Transportation (SCDOT) currently utilizes both hollow core and solid slab precast concrete span bridge sections. The intended advantages of these bridge sections were that they could be built according to an accelerated bridge construction (ABC) schedule and have increased durability. Increasing a bridge’s durability has economic advantages since they require less maintenance and have a greater lifespan.
Both the precast hollow core and solid slab spans have not met the SCDOT’s durability requirements. Deterioration of the grout key between adjacent precast members has led to reflective cracking in both the bridge deck and bridge wearing surface. These cracks allow water and other corrosive materials to infiltrate the precast beam sections, and lead to the corrosion of the prestressing strands and reinforcement. Corrosion of prestressing leads to bridge repairs as well as a diminished life-span, both costly to the SCDOT.
Reflective cracking at the shear key also leads to a decreased ability for a bridge to share load among its adjacent members. Both hollow core and solid slab sections are designed to distribute load transversely across the bridge and longitudinally to the girder bearings. Individual girders resist only a portion of the loads on a bridge. If the shear key is degraded and its ability to share load lessened, a possible overload and catastrophic failure of a bridge member could occur.
These durability issues have proved to be problematic and have concerned the SCDOT. The SCDOT and Clemson University teamed up to conduct research in order to identify, modify, or develop a bridge type that was both more durable and could meet the schedule of ABC. The SCDOT and Clemson University settled on the northeast extreme tee (NEXT) beam, developed by the bridge technical committee of PCI Northeast.
The NEXT beam section is an advantageous bridge section for many reasons, including its geometric diversity, ability to meet an ABC schedule, utility
accommodations, full deck option, and a wider shear key allowing for an easier concrete pour or grouting.
The NEXT beam cross section does not fall into an AASHTO LRFD category for simplified moment live load distribution factors. This project seeks to calculate live load distribution factors via live load test, and determine what, if any, category the NEXT section can fall under for simplified moment live load distribution factors. A future research project will assess the durability of the UHPC shear keys for both the NEXT D and solid slab span by monitoring the ability for girder sections to share load transversely over a period of two years. Results of this research will be given to the South Carolina Department of Transportation (SCDOT) so that they may be informed on how NEXT Beam transverse moment distribution behavior. Results on UHPC shear key performance and durability will also be given to the SCDOT.
ACKNOWLEDGMENTS
I want to thank and express my gratitude to all those individuals and organizations who have helped me in the last 5.5 years at Clemson University. First, I would like to thank all my committee members, Dr. Tommy Cousins, Dr. Brandon Ross, and Dr. Weichang Pang. Thank you for presenting this tremendous opportunity to participate in hands on bridge research. Additionally, I would like to thank them all for their patience and invaluable engineering insight, knowledge, and guidance. Thanks to Daniel Metz, Scott Black, and Samuel Hess. Without all of your hard work, neither the bridge test nor UHPC testing would have been possible. Thanks to Robert Gunter for his time and patience while teaching me how to operate the BDI data acquisition system. Thanks to the SCDOT and FHWA for providing the funding and opportunity to conduct this research. Finally, I would like to thank my family for their love and support during my time away from home. At the time of this writing, I have spent close to a quarter of my life in the town of Clemson, SC. It feels like home and I’m sorry to go. I will especially miss the beautiful campus, football Saturdays, hunts in the WMA, shooting the breeze at Nick’s, and the new friends that I have made. While I feel nostalgic looking back on my college days, I shall look forward to good times and new challenges ahead.
TABLE OF CONTENTS
TITLE PAGE...i
ABSTRACT ...ii LIST OF FIGURES ... xiv
Chapter 1: Introduction ... 1
1.1 Hanging Rock Bridge ... 5
1.2 Load Distribution Factors ... 9
1.3 Purpose and Scope ... 10
1.4 Objectives ... 11
1.5 Organization ... 11
Chapter 2: Literature Review... 13
2.1 NEXT Beam Background ... 13
2.2 Dynamic Load Allowance ... 16
2.2.1 AASHTO Dynamic Load Allowance ... 20
2.2.2 Experimental Calculation of Dynamic Load Allowance ... 21
2.3 Transverse Load Distribution in Slab-Girder Bridges ... 22
2.3.1 AASHTO LRFD Distribution Factors for Moment – NEXT Beam Bridges ... 24
2.3.2 AASHTO LRFD Distribution Factors for Moment – Adjacent Box Beam Bridges 27 2.3.3 Experimental Calculation of Distribution Factors for Moment ... 29 ACKNOWLEDGMENTS...iv
TABLE OF CONTENTS (CONTINUED)
2.4 Ultra-High Performance Concrete for Bridge Connections... 31
2.4.1 Adjacent Box Beam Bridge Shear Key Connections ... 32
2.4.2 Ultra-High Performance Concrete Compressive Strength ... 40
2.4.3 Ultra-High Performance Concrete Tensile Strength ... 40
2.4.4 Ultra-High Performance Concrete Bond Strength ... 41
2.4.5 Ultra-High Performance Concrete in Joint Connections ... 44
2.5 Field Test of Adjacent Beam Bridges ... 53
2.5.1 Suck Creek Bridge ... 53
2.6 NEXT Beam Case Studies and Investigations ... 59
2.6.1 New Bridge Case Study ... 59
2.6.2 NEXT F: AASHTO Equations, FE Modeling, and Live Load Testing ... 61
2.6.3 Clemson University NEXT D Beam FE Modeling and AASHTO Equation Parametric Study ... 67
2.7 Accelerated Bridge Construction ... 68
Chapter 3: UHPC Tests and Nondestructive Live Load Test ... 75
3.1. NEXT D and Solid Slab Span Material Properties ... 75
3.2 UHPC Materials Tests ... 79
3.2.1 UHPC Mix Design ... 80
TABLE OF CONTENTS (CONTINUED)
3.2.2 Compressive Strength ... 80
3.2.3 Split Tensile Strength ... 81
3.2.4 Bond with Concrete ... 82
3.3 Live Load Test ... 87
3.3.1 Data Collected ... 88 3.3.2 Bridge Instrumentation ... 88 3.3.3 Data Acquisition ... 88 3.3.4 Truck Descriptions ... 89 3.3.5 NEXT D Span ... 91 3.3.5.1 Strain Transducers ... 91
3.3.5.2 Linear Variable Differential Transformers ... 95
3.3.5.3 Instrumentation Plans... 96
3.3.5.4 Loading Configurations ... 100
3.3.6 Solid Slab Span ... 105
3.3.6.1 Strain Transducers ... 105
3.3.6.2 Linear Variable Differential Transformers ... 107
3.3.6.3 Instrumentation plans ... 107
TABLE OF CONTENTS (CONTINUED)
3.3.6.4 Loading Configurations ... 110
Chapter 4: Results and Discussion ... 117
4.1 Material Tests Results ... 117
4.1.1 Compressive Strength Test ... 117
4.1.2 Splitting Tensile Test ... 121
4.1.3 Pull Off Test ... 124
4.1.3 Summary of UHPC Tests Results ... 126
4.2 Live Load Test Results ... 127
4.2.1 Discarded Data and Strain Gauge Noise ... 127
4.2.2 NEXT D Live Load Test... 130
4.2.2.1 Overview of Test Results ... 130
4.2.2.2 Strain Gauge Data and DFM Calculation ... 133
4.2.2.2.1 Time Independent Method ... 134
4.2.2.2.2 Time Dependent Methods (a) and (b) ... 134
4.2.2.2.3 AASHTO Type i ... 135
4.2.2.2.4 AASHTO Type k ... 135
4.2.2.2.5 NEXT-6 FE Model ... 135
TABLE OF CONTENTS (CONTINUED)
4.2.2.2.7 NEXT-8 FE Model ... 135
4.2.2.4 LVDT Data ... 143
4.2.2.5 Dynamic Load Allowance ... 146
4.2.3 Solid Slab Live Load Test... 148
4.2.3.1 Overview of Test Results ... 148
4.2.3.2 Strain Gauge Data and DFM Calculation ... 151
4.2.3.2.1 Time Independent Method ... 152
4.2.3.2.2 Time Dependent Method ... 152
4.2.3.2.3 AASHTO Type g ... 153
4.2.3.3 LVDT Data ... 160
Chapter 5: Conclusions and Recommendations ... 165
5.1 Summary of Results ... 165
5.2 Conclusions ... 168
5.3 Recommendations ... 169
Appendix A: Calculations of AASHTO DFMs ... 172
A.1 NEXT D Super Structure at Hanging Rock Creek Bridge ... 172
A.2 Single Stem Approach (SST – type k) ... 173
TABLE OF CONTENTS (CONTINUED)
A.3 Double Stem Approach (DST – type i) ... 174
A.4 Exterior and Interior Girder DFM Calculations ... 175
A.4.1 Exterior DFM Calculation – Type (i) and (k) Approach ... 175
A.4.2 Interior DFM Calculation – Type (k) Approach ... 177
A.4.3 Interior DFM Calculation – Type (i) Approach ... 178
A.5 Solid Slab Super Structure at Hanging Rock Creek Bridge... 178
A.5.1 Interior DFM Calculation – Type (g) Approach ... 179
Appendix B: Predicted NEXT D Bending Strain ... 181
Appendix C: Predicted Solid Slab Bending Strain ... 182
LIST OF TABLES
Table Page
1 AASHTO LRFD IM Factors (AASHTO LRFD 2012) ... 21
2 Material Properties used in FE Model ... 35
3 Concrete Properties in Precast Beam Specimens ... 37
4 Virginia Tech UHPC Compressive Strength Test Results ... 40
5 Virginia Tech UHPC Tensile Strength Test Results... 41
6 VHPC-Large Mix Design (Joyce, 2014) ... 42
7 Bond Strength to Precast Concrete (Halbe, 2014) ... 43
8 Specimen Test Schedule (Halbe, 2014) ... 43
9 UHPC and VHPC Mix Proportions (Halbe, 2014) ... 44
10 Test Matrix for Static Tests (Sheng et al., 2013) ... 52
11 Displacement Values from First Bridge Test (Sheng et al., 2013) ... 56
12 DFM Values with Differing Span Lengths - (Skew Angle = 0⁰ ) [Singh, 2012] ... 63
13 DFM Values with Differing Skew Angles - (Span = 66.7 ft) [Sing, 2012] ... 63
14 Maximum Moments Experienced During Load Test (Bahjat et al., 2014) ... 67
15 Load Distribution Factors for NEXT-6 D Load Distribution Factors for NEXT-6 D ... 68
16 Specified NEXT D and Solid Slab Span Material Properties ... 76
17 Class 6500 Concrete Cylinder Compressive Test Results at 28 Days ... 77
List of Tables (Continued) Table
18 Class 8000 Concrete Cylinder Compressive Test Results
at 28 Days ... 78
19 Grade 270 Prestressing Test Results for 0.5” and 0.6” Diameter Strands ... 78
20 Grade 60 Steel Reinforcement Test Results ... 79
21 Material Test Summary... 80
22 Typical Ductal UHPC Mix Design ... 80
23 NEXT D BDI Gauge List ... 100
24 NEXT D Load Configuration Summary ... 101
25 Solid Span BDI Gauge List... 110
26 Solid Slab Span Loading Configuration Summary ... 111
27 Clemson University UHPC Compressive Strength Test Results ... 118
28 Virginia Tech UHPC Compressive Strength Test Results ... 119
29 Clemson University UHPC Tensile Strength Test Results – Batched on 3/20/17 ... 122
30 Clemson University UHPC Tensile Strength Test Results – Batched on 3/21/17 ... 122
31 Virginia Tech UHPC Tensile Strength Test Results... 123
32 Clemson University 6 Month UHPC Pull-Off Test Results ... 125
33 Virginia Tech UHPC Pull-Off Test Results... 126
34 Time Independent Maximum Bending Strain Values in Strain Transducers for Load Configuration 7 Trial 3 ... 136
List of Tables (Continued) Table
35 Time Independent Individual Web and Girder Calculated
DFMs ... 137
36 Experimental DFM Values Calculated by Time Dependent Method (a) and (b) ... 137
37 Maximum Experimentally Determined DFM Value ... 139
38 DFM Comparison for Single Truck and Side-by-Side Truck ... 142
39 NEXT D Average LVDT Horizontal Displacements ... 146
40 Maximum Experimentally Derived IM Values ... 147
41 Time Independent Maximum Bending Strain Values in Strain Transducers for Load Configuration 3 Trial 1 ... 154
42 Experimental DFM Values Calculated by Time Independent Method (Method 1) ... 155
43 Experimental DFM Values Calculated by Time Dependent Method (Method 2) ... 155
44 Maximum Experimentally Derived DFM Values... 157
45 DFM Comparison for Solid Slab Span Single and Side-by-Side Trucks... 159
46 Solid Slab Average LVDT Horizontal Displacements ... 163
47 Maximum Experimentally Derived IM Values on Solid Slap Span ... 155
LIST OF FIGURES
Figure 1: Section of Hollow Core Slab (Nielson et al., 2012) ... 2
Figure 2: Typical Building Double Tee (Picture courtesy of Tekla Structures) ... 4
Figure 3: NEXT D Section Cut ... 4
Figure 4: Hanging Rock Creek Bridge ... 6
Figure 5: NEXT D Shear Key ... 7
Figure 6: NEXT D Shear Key Detail ... 7
Figure 7: Solid Slab Shear Key ... 7
Figure 8: Solid Slab Shear Key Detail ... 7
Figure 9: Cut through NEXT D Beam (Span 1) ... 8
Figure 10: Section Cut through Hollow Core Slab Units (Spans 2 and 3) ... 8
Figure 11: Section Cut through Solid Slab Unit (Span 4) ... 8
Figure 12: Type (i) Girder (Double T Beam Bridge Section) [AASHTO LRFD] ... 9
Figure 13: Type (k) Girder (Bulb T Beam Bridge Section) [AASHTO LRFD] ... 10
Figure 14: NEXT D Beam Section Cut ... 13
Figure 15: High-Level Railroad Platform that Inspired NEXT Beam Design (Culmo and Seraderian, 2010) ... 14
Figure 16: Elevation View of the Route 601 Bridge with Planned Approach Slabs (Restrepo, 2002) ... 17
Figure 17: Elevation View of the Route 601 Bridge with Sloped Approach Slabs Due to Soil Settlement (Restrepo, 2002) ... 17
Figure 18: Approach Conditions of the Route 601 Fall 2001 Live Load Test (Restrepo,
2002) ... 17
Figure 19: Improved Approaches of the Route 601 Summer 2002 Live Load Test (Restrepo, 2002) ... 18
Figure 20: Route 601 IM Factor Comparison with AASHTO (Restrepo, 2002) ... 18
Figure 21: Static Versus Dynamic Load Effect (Collins, 2010) ... 19
Figure 22: Dynamic Response Superimposed on Static Response (Collins, 2010) ... 20
Figure 23: Illustration of Transverse Load Distribution (Barker and Puckett, 2007) ... 23
Figure 25: Type (k) Girder (I Beam Bridge Section) [AASHTO LRFD] ... 24
Figure 24: Type (i) Girder (Double T Beam Bridge Section) [AASHTO LRFD] ... 24
Figure 26: Type (g) Adjacent Box Beam Section [AASHTO LRFD]... 27
Figure 27: Live Load Distribution Factor for Moment Example (Collins, 2010) ... 31
Figure 28: Generic UHPC Stress-Strain Graph (Picture courtesy of the FHWA) ... 32
Figure 29: Typical Detail of Kevlar and Epoxy Connection (Halbe, 2014) ... 33
Figure 30: Top Flange Spliced Connection with UHPC (Halbe, 2014) ... 34
Figure 31: Joint Opening in the FE sub-assemblage Model (Halbe, 2014) ... 35
Figure 32: Test Setup for sub-assemblage Tests (Halbe, 2014) ... 36
Figure 33: Crack Illustration in the Precast Joint Element (Halbe, 2014) ... 38
Figure 34: Load vs. North Interface Displacement for Specimens with No. 4 Bar (Halbe, 2014) ... 39 List of Figures (Continued)
Figure 36: Bond Strength to Precast Concrete (Joyce, 2014) ... 42
Figure 37: Layout and Rebar plan for Concrete Panel 6H (Graybeal 2010) ... 45
Figure 38: Layout and Rebar plan for Concrete Panel 6B (Graybeal 2010) ... 46
Figure 39: Test setup for Cyclic Loading (Graybeal, 2010) ... 47
Figure 40: Concrete Panel with UHPC Joint Instrumentation Setup (Graybeal, 2010) ... 48
Figure 41: Graph of Load vs. Joint Opening for test specimen 6B (Graybeal, 2010) ... 49
Figure 42: UHPC Adjacent Box Beam Connection (Graybeal, 2014) ... 50
Figure 43: NEXT D Joint Details for Non-shrink Grout and UHPC (Culmo Email September 22, 2016) ... 51
Figure 44: Hooked Bar Shear Key Detail (Sheng et al., 2013)... 51
Figure 45: Strain Gauge and LVDT Layout for Shear Key Test (Sheng et al., 2013) ... 52
Figure 46: Cross Section of Suck Creek Bridge (Sheng et al., 2013) ... 54
Figure 47: LVDT Mounting Schematic (Sheng et al., 2013) ... 54
Figure 48: LVDT Locations for First Test (Sheng et al., 2013) ... 55
Figure 49: Truck Position for First Live Load Test (Sheng et al., 2013) ... 55
Figure 50: Cross Section of Arden Road Bridge (Halbe, 2014) ... 57
Figure 51: Arden Road Bridge Layout and Instrumentation (Halbe, 2014) ... 58
Figure 52: Typical Horizontal joint displacement (Halbe, 2014) ... 59
Figure 53: The New Bridge in York, ME (Gardner and Hodgdon 2013)... 61
Figure 54: Differential Stem Spacing of the NEXT F Beam (Singh, 2012) ... 63
Figure 55: NEXT 32-F Dimensions and Bridge Cross Section (Bahjat et al., 2014) ... 65 List of Figures (Continued)
Figure 56: Weighted Trucks and their Respective Positions. (a) Truck Dimensions and
axle weights; (b) Truck Configurations used in Load Test (Bahjat et al., 2014) ... 65
Figure 57: Strain Distribution for Multiple Live-Load Loading Conditions (Bahjat et al., 2014) ... 66
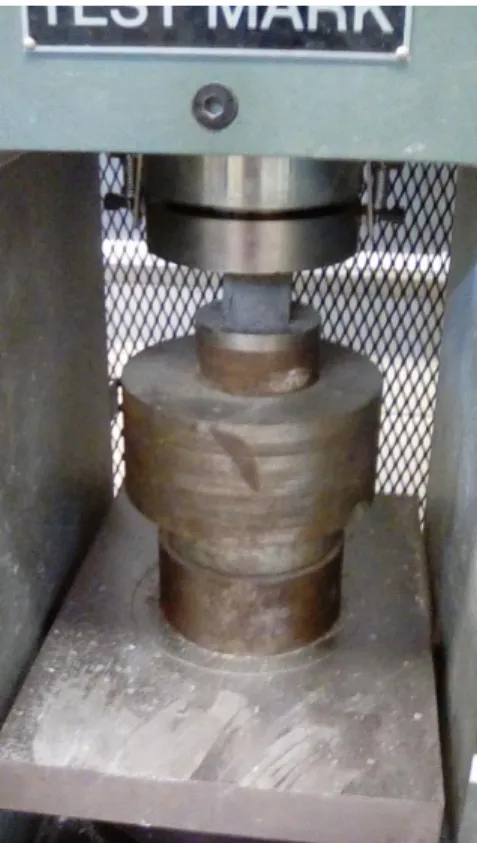
Figure 58: 2” x 2” Cube Compressive Strength Test ... 81
Figure 59: Schematic Drawing of Split Tensile Test (Courtesy of Roohollah Bagherzadeh) ... 82
Figure 60: 2' x 2' UHPC to Precast Test Specimen... 83
Figure 61: Schematic Top View of Pull Off Test Specimen ... 83
Figure 62: Schematic Side View of Pull Off Test Specimen... 84
Figure 63: Test specimen with cored holes... 84
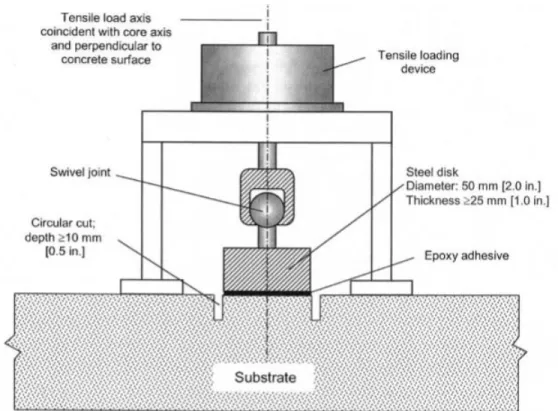
Figure 64: Schematic Drawing of Pulloff Test (Courtesy of ASTM C1583) ... 85
Figure 65: Failure of Test Specimen at the UHPC to Precast Interface ... 86
Figure 66: Schematic Drawing of Pulloff Test Failure Modes (Courtesy of ASTM C 1583) ... 87
Figure 67: Truck #1 Weight ... 89
Figure 68: Truck #2 Weight ... 90
Figure 69: Truck #1 Dimensions ... 90
Figure 70: Truck #2 Dimensions ... 91
Figure 71: Strain Transducer attachment to NEXT D Girder ... 92 List of Figures (Continued)
Figure 74: Loctite Adhesive (Picture courtesy of Robert Gunter) ... 94
Figure 75: Loctite Accelerant (Picture courtesy of Robert Gunter) ... 94
Figure 76: LVDT Rigged to measure Relative Horizontal Displacement on NEXT D Girder ... 95
Figure 77: NEXT D Strain Gauge Layout ... 98
Figure 78: NEXT D LVDT Layout ... 99
Figure 79: Load Configuration 1 (Exterior Girder Single Truck) ... 101
Figure 80: Load Configuration 2 (Single Truck on Interior Girder) ... 102
Figure 81: Load Configuration 3 (Two Trucks Max Loading Exterior Girder) ... 102
Figure 82: Load Configuration 4 (Two Trucks Max Loading Interior Girder – One wheel line directly over Joint) ... 103
Figure 83: Load Configuration 5 (Single Truck on Interior Girder – Wheel Line over Middle Joint) ... 103
Figure 84: Load Configuration 6 (Single Truck on Exterior Girder – Symmetry with Scenario 1) ... 104
Figure 85: Load Configuration 7 (Single Truck on Interior Girder – Symmetry with Scenario 2) ... 104
Figure 86: Strain Transducers and LVDT Rigged on Solid Slab Span ... 105
Figure 87: Schematic Drawing of Strain Gauge Mount Position on Solid Slab Girders 1 through 12 ... 106 Figure 88: Schematic Drawing of Strain Gauge Mount Position on Solid Slab Girders 13 List of Figures (Continued)
Figure 89: LVDT Mounted to Solid Slab ... 107
Figure 90: Solid Span Strain Gauge Sensor Layout ... 108
Figure 91: Solid Span LVDT Sensor Layout ... 109
Figure 92: Load Configuration 1 (Single Truck on Exterior Girder/Joint) ... 112
Figure 93: Load Configuration 2 (Single Truck Straddling Two Interior Joints) ... 112
Figure 94: Load Configuration 3 (Single Truck Over Two Interior Joints) ... 113
Figure 95: Load Configuration 4 (Two Trucks, each with Wheel Line Over Joint - Exterior Girder) ... 113
Figure 96: Load Configuration 5 (Two Trucks, offset from Joints – Interior Girders) .. 114
Figure 97: Load Configuration 6 (Two Trucks, each with Wheel Line Over Joint – Interior Girders) ... 114
Figure 98: Load Configuration 7 (Single Truck on Exterior Girder/Joint - Symmetry with Scenario 1) ... 115
Figure 99: Load Configuration 8 ((Single Truck Straddling Two Joints – Symmetry with Scenario 2) ... 115
Figure 100: Load Configuration 9 (Single Truck over Middle Joint) ... 116
Figure 101: Load Configuration 10 (Single Truck over Middle Joint – Dynamic Case) 116 Figure 102: UHPC Compressive Strength Gain ... 120
Figure 103: UHPC Tensile Strength Gain ... 123
Figure 104: Load Configuration 1 Trial 3 J5-6 Data ... 128 List of Figures (Continued)
Figure 106: Cross-Section View and Strain Gauge Data for Load Configuration 7 Trial 3
... 131
Figure 107: Strain Gauge Data from Trial 3 of Load Configuration 7 on NEXT D Span ... 132
Figure 108: LVDT Data from Trial 3 of Load Configuration 7 on NEXT D Span ... 133
Figure 109: DFM Comparison for Single Truck Load ... 140
Figure 110: DFM Comparison for Side-by-Side Truck Load ... 141
Figure 111: LVDT Data from Trial 3 of Load Configuration 7 on NEXT D Span ... 144
Figure 112: Dynamic vs. Static Responses in Strain Gauge 4R on NEXT D Span ... 147
Figure 113: Cross-Section View and Strain Gauge Data for Load Configuration 3 Trial 1 ... 149
Figure 114: Strain Gauge Data from Load Configuration 3 Trial 1 ... 150
Figure 115: LVDT Data from Load Configuration 3 Trial 1 on Solid Slab Span ... 151
Figure 116: DFM Comparison for Solid Slab Single Truck Load ... 158
Figure 117: DFM Comparison for Solid Slab Side-by-Side Truck Load ... 159
Figure 118: LVDT Data from Load Configuration 3 Trial 1 on Solid Slab Span ... 161
Figure 119: NEXT D Cross-Section from Hanging Rock Bridge ... 173
Figure 120: NEXT Beam Type k Stem Labeling Scheme ... 174
Figure 121: NEXT Beam Type i Stem Labeling Scheme... 175
Figure 122: Type (i) and (k) Lever Rule ... 176
Figure 123: Solid Slab Cross-Section from Hanging Rock Bridge ... 179 List of Figures (Continued)
Chapter 1:
Introduction
Every four years, the American Society of Civil Engineers (ASCE) produces a report card that grades America’s infrastructure in sixteen different categories. Bridges are included within this report card. According to ASCE’s 2017 report, of the 614,387 bridges in the United States, 9.1% are rated as structurally deficient (Bridges, 2017). Additionally, close to 40% of the nation’s bridges are reaching their design life of 50 years. As many bridges approach the end of their design life, the report estimates that an additional $123 billion is needed for bridge rehabilitation projects. In the state of South Carolina, 964 of its 9,358 bridges are rated as structurally deficient. The Federal Highway Administration (FHWA) classifies a bridge as structurally deficient if “significant load carrying elements are found to be in poor condition due to deterioration” (Ahmad, 2011). When replacing these structurally deficient bridges, the state hopes that new technologies and materials can help build these bridges at an accelerated rate to promote safety and resilience so that longer design lives can be achieved.
For many of its bridges, The South Carolina Department of Transportation (SCDOT) commonly utilizes cast-in-place (CIP) construction, precast solid slab, or precast hollow core bridges. Hollow core bridge sections are precast prestressed concrete rectangular slabs with tubular voids located in the middle of the section that extend the length of the slab. Solid slab bridges are similar in shape and geometry to hollow core sections, but do not have the tubular voids. Time has shown that CIP bridges are durable, but have a long construction time. Hollow core flat slab bridges can be built according to
an accelerated bridge construction (ABC) schedule, however, several durability issues have occurred.
For short to medium span bridges carrying lower average daily traffic (ADT), SCDOT commonly implements either hollow core and solid slab precast concrete span bridge sections. The SCDOT has discovered that both the precast hollow core and solid slab spans present durability issues. As shown in figure 1, deterioration of the grout key between adjacent precast members has led to reflective cracking in both the bridge deck and bridge wearing surface. These cracks allow water and corrosive materials to infiltrate the precast beam sections which leads to the degradation of the concrete and eventually corrosion of the prestressing strands. Corrosion of prestressing strands can lead to bridge repairs, diminished life-span, and postings.
Reflective cracking at the shear key is an indication of decreased transverse load distribution. Transverse load distribution is the ability of applied loads to be shared by adjacent members. If shear keys are degraded, transverse load distribution is decreased,
Reflecting Crack
and load carrying capacity may be decreased. This can result in bridge postings and in extreme cases, overload and catastrophic failure of a bridge member.
These durability issues have proved to be problematic and have concerned SCDOT. In a past project, SCDOT and Clemson University teamed up to conduct
research in order to identify, modify, or develop a bridge type that was both more durable and could lead to the schedule of ABC (Deery, 2010). SCDOT and Clemson University selected the Northeast Extreme Tee (NEXT) beam, developed by the bridge technical committee of PCI Northeast for further study and deployment on an SCDOT bridge (Culmo and Seraderian, 2010).
The NEXT beam is shaped like a double tee used in building construction (figure 2), but more robust, as shown in figure 3. The NEXT beam section was selected for many reasons, including geometric adaptability, ability to meet an ABC schedule, utility
accommodations, full deck option, easier to inspect, and a full-depth wider shear key allowing for an easier concrete pour and greater bond between precast girder elements and shear key. One of the NEXT beam models (NEXT D), is precast with a full depth flange (8”). The NEXT D beam requires no CIP overlay and a bituminous asphalt overlay is optional. In other words, the NEXT D beam can carry traffic as soon as the girders are set, shear keys are poured, and guardrails are in-place.
Many states have started to use the different varieties of NEXT beam bridge girder systems as an alternate to CIP concrete or precast sections with great success.
Additionally, some states have also replaced traditional shear key grout with ultra-high
Figure 2: Typical Building Double Tee (Picture courtesy of Tekla Structures)
performance concrete (UHPC). UHPC has very high compressive and tensile strength, and is extremely durable (Graybeal, 2010). Graybeal states that for a concrete to be considered UHPC, it must display compressive strengths greater than or equal to 21.7 ksi, and tensile strengths greater than or equal to 0.72 ksi (Graybeal and Russell, 2013). Additionally, UHPC bonds exceptionally well to precast bridge girder elements. The NEXT D bridge system that SCDOT is deploying includes UHPC as a replacement for grout in the shear keys. South Carolina and many other states are beginning to use UHPC as a replacement for grout in shear keys and other structural connections. Since NEXT beams and UHPC shear keys are beginning to see use by SCDOT and other state DOT’s, research is needed to investigate the structural performance and durability of UHPC shear keys.
1.1
Hanging Rock Bridge
Hanging Rock Creek Bridge in Kershaw, SC, is an example of a short span low average daily traffic (ADT) bridge. The bridge consists of four simple spans: one 40’ NEXT D span, two 70’ hollow core slab spans, and one 40’ solid core slab span. Hanging Rock Creek is the subject of this investigation.
A photo of the nearly completed Hanging Rock Bridge is shown in figure 4. The image displays four simply supported spans as well as the substructure beneath. Span 1 (far left and facing north) is a 40 ft. long NEXT-D beam span. Spans 2 and 3 are both 70 ft. long cored slab unit spans. Finally, span 4 is a 40 ft. long solid slab unit. The Hanging Rock Bridge utilizes Ductal Concrete as the UHPC shear key material. Ductal is the brand name of Lafarge Corporation’s version of UHPC. Additionally, spans 2 – 4 are
transversely post-tensioned. The UHPC is fiber-reinforced: it contains steel fibers that increase both the concretes strength and ductility. Ductal concrete’s strength is 6 to 8 times greater than standard concrete strength and has a lifespan 2 to 3 times longer (Ductal, 2015).
The SCDOT chose to build a bridge with three different types of prestressed concrete girders so that a head-to-head comparison of the behavior of the three bridge types could be performed. Shear keys for the NEXT-D and solid and hollow slab spans are shown figures 5 and 7, respectively.
Figure 8: Solid Slab Shear Key Detail Figure 6: NEXT D Shear Key Detail
Figure 7: Solid Slab Shear Key Figure 5: NEXT D Shear Key
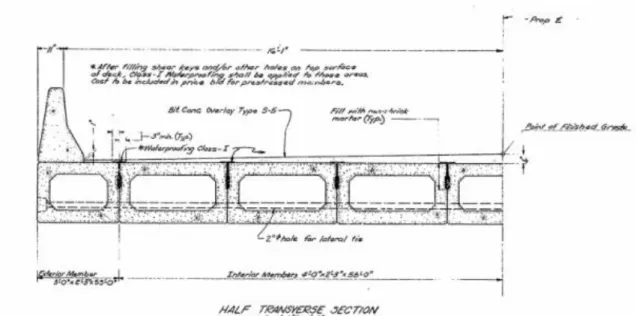
Figures 9, 10, and 11 show the cross sections of spans 1, 2 and 3, and 4
respectively. Facing north, NEXT D beam bridge girders are numbered 1-6 while moving from left to right. Facing north, hollow core and solid slab bridges, girders are numbered 1 through 14 while moving from left to right.
Figure 11: Section Cut through Solid Slab Unit (Span 4)
Figure 10: Section Cut through Hollow Core Slab Units (Spans 2 and 3) Figure 9: Cut through NEXT D Beam (Span 1)
1.2
Load Distribution Factors
AASHTO LRFD uses distribution factors to account for transverse load sharing in many categories of bridges. The NEXT beam cross section does not neatly fall into an AASHTO LRFD category for calculating simplified moment live load distribution factors (DFM). It is a hybrid between type (i) and type (k) when referencing AASHTO LRFD (AASHTO LRFD 2010). Type (i) and (k) are shown in Figures 12 and 13 respectively. A Precast Concrete Institute (PCI) technical committee has recommended that engineers calculating DFM for bridges containing NEXT D beams can treat the bridge as type (k) (Guidelines, 2012). This project seeks to evaluate the accuracy of this recommendation via live load testing. Additionally, the durability of the shear key will be monitored over a period of two years. Durability monitoring will be a focus of subsequent thesis projects; the current thesis focuses on DFM. The purpose and scope are described in detail in the next section.
1.3 Purpose and Scope
The purpose of this entire project is threefold: 1) evaluate the transverse load sharing characteristics of the NEXT D beams via UHPC connection and determine the live load moment distribution factors, 2) to monitor and compare the health of the UHPC shear keys in both the NEXT-D beams and solid core slab over a two-year period, and 3) to perform material tests on UHPC samples. This thesis will focus on the initial live load test of Hanging Rock Creek Bridge and the UHPC specimen tests performed in the Clemson University laboratory. Two more live load tests (at 12 and 24 months from date of bridge opening) are scheduled and will be discussed in a thesis at a later date.
Truck weights and configurations for the live load tests were selected to generate the maximum bridge girder response. Bridge girder strains and deflections were recorded during the live load tests of the bridge spans containing NEXT D beams and solid core slab. Cube, split cylinder, and pull-off tests all were performed to obtain metrics of the UHPC found in Hanging Rock Bridge shear keys. Cube strength tests determined the compressive strength of the UHPC, split cylinder determined the tensile strength of the UHPC, and the pull-off test measured the bond strength between the precast concrete and UHPC. The results from this project are used to present recommendations for engineers
designing NEXT beam bridges, specifically live load distribution factors for moment and if UHPC shear keys are more durable than normal strength grout or concrete.
1.4 Objectives
The entirety of this research project set out to answer the four objectives below. This thesis will focus on objectives #1 and #4. The objectives are as follows:
1. How is load shared transversely between NEXT-D beams? What is the calculated
DFM? How conservative is type (k) category, recommended by the PCI technical committee?
2. Does the transverse load behavior of NEXT-D beams and solid core units change
over the next two years as the bridge ages?
3. How durable are the UHPC shear keys? Does the UHPC bond well to the precast?
Is there a difference between the NEXT-D beam shear key (full-depth) and solid slab shear key (partial depth)? Are there any changes that would improve the joint detail?
4. What are the material properties of the UHPC? Specifically, what are the
compressive, tensile, and bond strengths?
1.5 Organization
This Master’s thesis is composed of five chapters. A literature review of NEXT beams, nondestructive bridge testing, and UHPC use in bridges is presented in chapter 2. Chapter 3 aims to present the setup and experimental procedure of the UHPC material tests and live load test. Results of the live load test are presented in chapter 4. Finally,
chapter 5 presents conclusions and recommendations based on the results found in chapter 4.
Chapter 2:
Literature Review
2.1 NEXT Beam Background
The NEXT beam is an alternative to the typical box-beam girder used by many state DOT’s in short to medium span bridges. The NEXT beam addresses many of the shortcomings of box beam girders including: accommodating utilities, construction challenges, and difficulty grouting shear keys. There are three variations of the NEXT beam, and they include NEXT D, NEXT E, and NEXT F (Seraderian, 2016). The NEXT D has full flange thickness (8”) with the top serving as a road surface. An optional asphalt overlay may be added. The NEXT E has half flange thickness (4”) and receives a 4” CIP concrete overlay. The NEXT F beam has a partial flange thickness, which serves as formwork for an 8” CIP concrete overlay. Hanging Rock Creek Bridge span 1 is a NEXT D bridge system. The geometry of the Hanging Rock Creek Bridge NEXT D section cut is shown in figure 14.
The idea for the NEXT beam came about in 2006 at the Rotondo Precast plant in Rehoboth, Massachusetts (Culmo and Seraderian, 2010). The Rotondo plant had
developed a precast section that was used for high-level railroad platforms show in figure 15. The high-level railroad platform section exhibited many favorable characteristics for short and medium bridge span lengths. After some dimensional parameters were set by PCI, the NEXT beam was born.
The main issues that state DOTs face with flat slab and hollow core sections is their durability and load sharing abilities (Deery, 2010). The NEXT beams seeks to solve these durability issues a few ways. First, there are no voids in the NEXT beam bridge sections, which limits waters ability to infiltrate inside the precast section and corrode the prestressing steel. While NEXT beams limit corrosion, they are also much easier to
Figure 15: High-Level Railroad Platform that Inspired NEXT Beam Design (Culmo and Seraderian, 2010)
inspect for girder damage and strand corrosion in comparison to hollow core and solid slabs (Deery, 2010)
Additionally, NEXT beam shear keys are wider and full depth, unlike many box-beam solid slab and hollow core section shear keys. These modified shear keys should allow for a stronger more durable connection that are easier to grout. Shear key failures can often be attributed to inadequate grouting procedures, which are made difficult by shear key narrowness (El-Remaily et al., 1996).
Lastly, solid slab sections often do not have any reinforced concrete overlay to assist with load sharing. All NEXT sections have reinforced concrete flanges and/or overlay to assist with load sharing.
There are papers that have shown various ways to decrease reflective cracking some of which include using a full depth shear key and using a grout material with a high bond strength (Miller et al., 1999). The NEXT beams of the Hanging Rock Creek have implemented both of these strategies.
The remaining portion of the literature review aims to summarize relevant
research completed and describe how the current study seeks to build off previous studies to answer the target objectives. Included in the literature review is a section on how transverse load distribution is accounted for by the AASHTO LRFD Bridge Design Specifications (2012). Another section contains background information on UHPC, how UHPC has been used in bridge connections by other state DOTs, and UHPC joint research conducted by Clemson University and Virginia Tech. The final section covers
research from the University of Massachusetts at Amherst on NEXT F beams, including their findings on transverse load distribution in NEXT beam bridges.
2.2 Dynamic Load Allowance
No road is smooth and perfectly flat. Roads all have different degrees of
roughness. Additionally, approach slabs may settle, creating a ramp from approach slab to the bridge system. Road roughness and these ramps cause vehicles to oscillate, or to bounce up and down on their suspension systems as a vehicle crosses a bridge. As the vehicles bounce, the shocks compress. This downward compression force is greater than the weight of the vehicle alone. The increase in the force of the truck due to the bouncing and compression of the shocks is called the dynamic load allowance (IM) (Barker and Puckett, 2007).
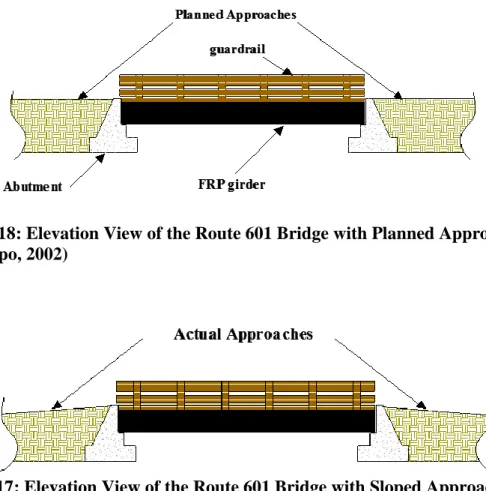
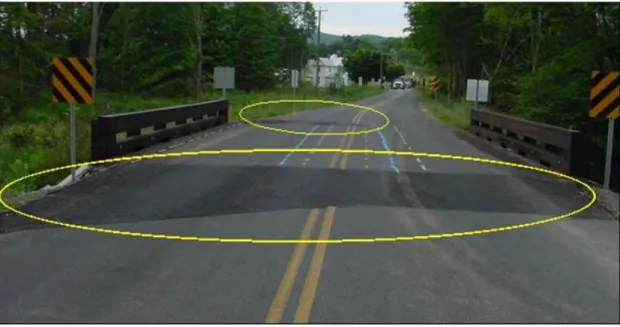
Edgar Restrepo observed this ramp like effect in his thesis work at Virginia Tech (Restrepo, 2002). Figures 16 and 17 are the hypothetical versus actual bridge approach slab elevation views for the Route 601 Bridge. The actual approach slab has a slope due to poor soil compaction under the approach slab. For his thesis work, Restrepo performed two bridge tests, one in the fall of 2001 and one in the summer of 2002. During the fall 2001 test, the approach slabs were in poor condition as shown in figure 18. During the summer 2002 test, the approach slabs had been repaired as shown in figure 19. A comparison of IM factors from both bridge tests and AASHTO standards is shown in figure 20.
Figure 18: Elevation View of the Route 601 Bridge with Planned Approach Slabs (Restrepo, 2002)
Figure 17: Elevation View of the Route 601 Bridge with Sloped Approach Slabs Due to Soil Settlement (Restrepo, 2002)
Figure 16: Approach Conditions of the Route 601 Fall 2001 Live Load Test (Restrepo, 2002)
From the data shown in figure 20, it was concluded that the dynamic load allowance was affected by the settlement of the approaches. In this case, the approach slab improvements actually amplified the dynamic effects of the trucks. In the Fall 2001
Figure 19: Route 601 IM Factor Comparison with AASHTO (Restrepo, 2002) Figure 20: Improved Approaches of the Route 601 Summer 2002 Live Load Test (Restrepo, 2002)
test, the ramped approaches allowed for the truck to go slightly airborne during the live load test, resulting in smaller bridge responses and a lower IM factor. The repair of the bridge approaches did not allow the truck to go airborne in the summer 2002 test, resulting in greater bridge responses and an increased IM factor.
Figure 21 shows a bridge girder under static and dynamic loading for the US Route 15 Southbound bridge over Interstate 66. This bridge is a two span 244 ft. steel girder bridge. Figure 22 plots bridge displacement versus truck position since the static and dynamic tests operate on a different time scale. From figure 22, it is shown that the deflections are greater due to the dynamic response than the static response. These dynamic forces must be accounted for in bridge design. Factors that influence the IM include bridge stiffness, span length, truck weight, and road surface roughness.
2.2.1 AASHTO Dynamic Load Allowance
Rather than determining the IM analytically or experimentally, AASHTO has a table that guides engineers on how to design for the dynamic effect of a vehicular load. The table for the design IM of different bridge components is shown in table 1.
Table 1: AASHTO LRFD IM Factors (AASHTO LRFD 2012)
In the case of Hanging Rock Creek Bridge, the bridge girders were designed used an IM of 1.33. This is a conservative value, which is illustrated in chapter 4 of this text.
2.2.2 Experimental Calculation of Dynamic Load Allowance
The dynamic load allowance is typically calculated using equation 1 below, where Ddyn is the response (bending strain or deflection) due to dynamic loading, and Dsta is the
response due to a static loading.
Equation 1
Once the IM is calculated, the dynamic loading is determined using equation 2, which converts the static loading into an appropriate dynamic loading:
2.3 Transverse Load Distribution in Slab-Girder Bridges
Bridges are designed to take vehicular loads and deliver them safely to the bridge foundation. Bridge decks and girders are designed to distribute load transversely across the bridge and longitudinally to the girder bearings. Individual girders resist a portion of the loads on a bridge. This portion or fraction of load is primarily a function of the transverse load distribution of the bridge.
The ability for bridge girders to share vehicular load transversely between
adjacent bridge girders is predicted using moment distribution factors (DFM). Stiffness of bridge components, including but not limited to the concrete deck, diaphragms, bearings, and bridge geometry, all play a role in how vehicular loads are transversely distributed to each bridge girder (Barker and Pucket, 2007). After a live load distribution factor is
obtained, axle loads are multiplied by the distribution factors. The product is equivalent to the vehicular design load, which is multiplied by a dynamic load allowance and then combined with other loads (i.e. deck weight, barrier rails, etc.) to produce the total design load. A large distribution factor means that less load is shared between adjacent girder members, and therefore, the girder directly beneath the axle load takes more load.
Figure 23 illustrates the concept of fair and poor transverse load distribution. Figure 23(a) is a picture of a slab-girder bridge and Figure 23(b) visually illustrates the load path of a point load distributed from the deck into the girders. As shown, the further away the girder is from the point load, the less load received. Figures 23(c) and (e), respectively, illustrate ideal load distribution, while Figure 23(d) illustrates that poor load distribution leads to excessive deflection in girders directly under load when compared to deflections of nearby girders.
Transverse load distribution is an important factor in the design of bridge girders to resist both applied shear and moment. Transverse load distribution for moment (or flexural) design of NEXT D beam bridges is the primary concern of this research, therefore, the following literature review will not address transverse load distribution as it relates to shear design of bridge girders.
Figure 23: Illustration of Transverse Load Distribution (Barker and Puckett, 2007)
2.3.1 AASHTO LRFD Distribution Factors for Moment – NEXT Beam Bridges
Multiple factors are considered when calculating bridge girder distribution factors including girder spacing, length of span, girder geometry, and the modular ratio between girder and deck (Barker and Puckett, 2007). AASHTO LRFD presents a table of formulas (Table 4.6.2.2.1-1) that assists engineers in calculating distribution factors for single and multi-lane traffic loads for both interior and exterior girders. The empirical derivations of these formulas can be traced to NCHRP Project 12-26 (Zokaie and Imbsen, 1993). NEXT D girder bridges most closely resemble section types (i) and (k) from AASHTO LRFD 4.6.2.2.1-1, shown in figures 24 and 25, respectively.
Cross section (k) uses the following equations to calculate the DFM of an interior beam for single and multiple design lanes loaded:
Figure 25: Type (i) Girder (Double T Beam Bridge Section) [AASHTO LRFD]
gM1i- = Equation 3
gM2+i- = Equation 4
Where:
Kg = n(Ibs+Abseg2)
n = EBeam/ESlab
gM1i- = DFM for interior girder with one lane loaded
gM2+i- = DFM for interior girder with two or more lanes loaded
Kg = longitudinal stiffness parameter for the composite girder (in4)
S = respective spacing between the girders (ft) for different
approaches
L = spand of the bridge (ft)
ts = thickness of deck slab (in)
n = modular ratio between the material of girder and material of deck eg = the distance between centers of gravity of stems and flange (in)
Abs = cross sectional area of the stems (in2)
Ibs = moment of intertia of the stems (in4)
EBeam = modulus of elasticity of NEXT beam (ksi)
Similar equations for type (k) to calculate exterior girder DFM for one design lane load are not provided by AASHTO LRFD, rather, the lever rule is applied. The lever rule is outlined in AASHTO LRFD Section 4.6.2.2.2. Using the lever rule method, moments are summed about a hinge placed at the first interior girder. The reaction at the exterior girder is determined and then divided by the total truck load. The ratio of the exterior girder reaction by the total load is the calculated DFM for the exterior girders.
Equations to calculate type (k) exterior beam DFM for multiple lane loads are as follows:
g = e*ginterior
e = 0.77+de/9.1
de = horizontal distance from the centerline of the exterior web of
exterior beam at the deck level to the interior ede of curb or traffic barrier
Cross section (i) uses the following equations to calculate the DFM of an interior beam regardless of number of loaded lanes:
g = S/D C = K(W/L) ≤ K D = 11.5-NL+1.4NL(1-0.2C)2 when C ≤ 5 D = 11.5-NL when C > 5 K I 1( ) J g = distribution factor
W = edge-to-edge width of bridge (ft)
μ = Poisson’s ratio
J = St. Venant torsional inertial (in4)
Cross section (i) uses the lever rule (explained above) to calculate the DFM of an exterior beam regardless of number of loaded lanes. If a type (i) bridge is “sufficiently connected to act as a unit” (AASHTO, 2012) the bridge can calculate DFM values using the type (k) equations.
2.3.2 AASHTO LRFD Distribution Factors for Moment – Adjacent Box Beam Bridges
Adjacent box beam bridges most closely resemble section type (g) from AASHTO LRFD 4.6.2.2.1-1, shown in figure 26.
Cross section (g) uses the following equations to calculate the DFM of an interior beam for a single and side-by-side truck load:
gM1i- = Equation 5
gM2+i- = Equation 6
Where:
k =
Nb = Number of beams, stringers or girders
gM1i- = DFM for interior girder with one lane loaded
gM2+i- = DFM for interior girder with two or more lanes loaded
J = St. Venant torsional inertial (in4)
L = spand of the bridge (ft)
b = width of beam (in)
I = moment of intertia about axis under consideration (in.4)
Cross section (f) uses the following equations to calculate the DFM of an exterior beam for a single design lane loaded:
g = Equation 7
Where:
e =
de = horizontal distance from the centerline of the exterior web of
exterior beam at the deck level to the interior ede of curb or traffic barrier ginterior = distribution factor of interior beam
Cross section (g) uses same equations to calculate the DFM of an exterior beam for multiple design lanes loaded except for one change:
e =
2.3.3 Experimental Calculation of Distribution Factors for Moment
The NEXT D bridge girder does not neatly fall into one of the AASHTO LRFD DFM categories, however, as previously stated, treating the section as type (k) may lead to higher, and therefore, more conservative calculated DFM’s. Experimental DFM values can be calculated and can inform engineers how load is shared transversely between bridge girders. Through the use of a live load test, bridge girders can be instrumented to record the strain of the bridge girder. The maximum strain that a bridge girder
experiences is used to calculate the DFM. Load may be applied to a bridge through the use of a slow driving truck. Using equation 8, bridge girder DFM values may be experimentally determined (Fu et al., 1996).
Equation 8
Where gi is the distribution factor for girder “i”, εi is the strain in girder “i”, and εj is the
strain in all of the other bridge girders taken at the same time that the maximum strain in girder “i” was measured.
An alternative equation (equation 9) has been proposed to experimentally
calculate DFM values. This equation accounts for increased stiffness that is given by the barrier rails. The equation is as follows (Barnes et al., 2003):
Equation 9
Where gi is the distribution factor for girder “i”, Ri is the response in girder “i”, and Rj is
the response in all of the other bridge girders taken at the same time that the maximum response in girder “i” was measured. Response (R) can be taken as either strain (ε) or displacement (Δ). Wi and Wj are the section moduli of girders i and j, respectively.
Figure 27 from Collins (2010), is a graphical displays the results of a live load test. The tested bridge contained 6 girders with equal spacing and stiffness. The results shown are for side-by-side truck crossing, which was meant to cause maximum load in girder 3. Two sets of data are displayed on the graph. The service strain is the greatest response experienced by each bridge girder, while the distribution strain is each girders response at the time when the greatest girder response is experienced by the maximally loaded girder, which in this case is girder 3. Girder strain is the highest in girders directly below wheel loads and dissipates as the girders get further away from the load. DFM values would be calculated by using the distribution data set in conjunction with Equation 9.
2.4 Ultra-High Performance Concrete for Bridge Connections
Ultra-high performance concrete (UHPC) has been commercially available since about 2000 and is characterized by displaying compressive strengths of over 21.7 ksi and cracking tensile strengths above 0.72 ksi (Graybeal and Russell, 2013). Ingredients of UHPC include cement, fine sand, steel fibers, water, and other additives. The steel fibers in the mix are what gives UHPC its high tensile strength. UHPC is vastly more expensive than standard concrete (sometimes greater than 10 times as much) (Ultra-High
Performance Concrete: Homeland Security), but is also more durable and needs less maintenance. Additionally, UHPC bonds well to cast-in-place (CIP) concrete and is resistant to fatigue cracking. Due to its durability and bond strength, UHPC is an
attractive option to use for connections between precast elements in bridges. Figure 28 is a generic stress-strain curve of UHPC. The figure illustrates UHPC’s remarkable tensile strength and ductility, which is what makes it a viable material for bridge connections.
2.4.1 Adjacent Box Beam Bridge Shear Key Connections
It has been well documented that adjacent box beam bridges (ABBB) have durability issues, particularly in the shear key. In Kedar Halbe’s dissertation from the Virginia Tech (Halbe, 2014), he proposed new connection details to improve shear key performance, reduce reflective cracking, and consequently, improve bridge durability. Specifically, six different connection details between box beams were assembled and tested. The research proposed two new connection details. The first proposed connection made no change to an existing partial or full depth shear key, rather it added a Kevlar sheet to reinforce the connection. The Kevlar sheet not only added strength to the
Figure 28: Generic UHPC Stress-Strain Graph (Picture courtesy of the FHWA)
connection, but waterproofing as well. The detail for this connection is shown in figure 29.
The second proposed connection detail is more complicated. Cracking in the ABBB shear keys was caused by the grout debonding from the concrete. The second connection, added a structural connection to improve the bond. This connection was a splice bar connecting the two adjacent beams at the top of the flange. UHPC or very high performance concrete (VHPC) replaced the shear key grout to keep the splice length of the bar short. UHPC and VHPC have a greater bond strength to rebar allowing for shorter development lengths. The detail for this connection is shown in figure 30.
Two FE models of the specimens were created in ABAQUS to quantify responses of adjacent box bridges subject to truck loads. The first model used material properties shown in table 2, below, while the second model used the material properties measured from laboratory tests.
Table 2: Material Properties used in FE Model
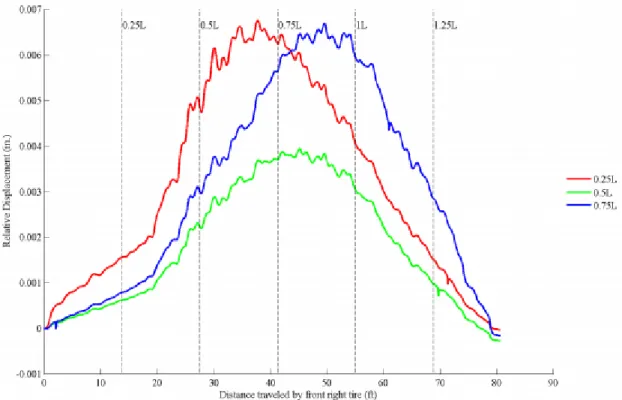
Of particular interest in the modeling was the horizontal opening of the joint, as shown in Figure 31. Joint displacement values for the sub-assembalge (SA) models and full scale bridge (FSB) models were recorded and measured as 0.0038 in and 0.00387 in., respectively. These predicted displacements serve as an order of magnitude value that the researchers can compare to to when performing a live load test on the solid slab section.
In addition to FE modeling, SA specimens using the two new proposed
connection details were constructed and tested. The SA specimens were instrumented and recorded responses caused by fatigue and static strength tests. Relative gap displacements were measured by LVDTs to capture the joint behavior. The location of the instrumented LVDTs can be found in figure 32. Table 3 presents the concrete properties of the precast specimens.
Table 3: Concrete Properties in Precast Beam Specimens
Interface openings typically occurred before any cracks showed in the UHPC or VHPC pockets. Once the interface was completely opened, cracks either propagated diagonally below the grout pocket into the precast concrete, or, the interface would continue to delaminate along the bottom of the shear pocket. These failure forms are illustrated in figure 33.
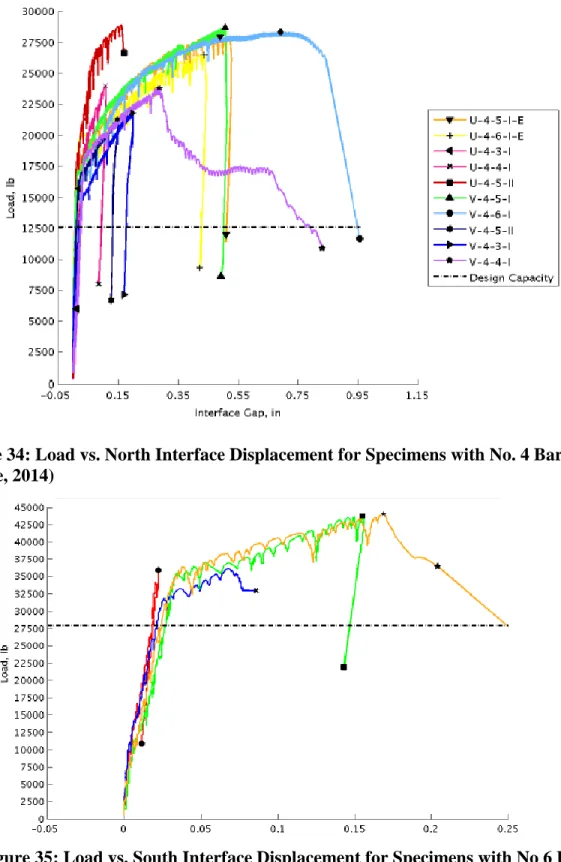
The interface measurements were plotted versus the applied load and can be seen in figures 34 and 35, respectively. Figure 34 shows displacements for all specimens with No. 4 reinforcing bars extending into the joint, while figure 35 has No. 6 bars. Interface displacements are significantly smaller in the No. 6 bar joint compared to No. 4 bar joint. For all test specimens, displacements are very similar up until debonding at the interface occurs, after which, displacements increase at different rates. The design capacity of the No. 4 bar specimens was 12.5 kips, and cracks began to occur at approximately 15 kips. The design capacity of the No. 6 bar specimens was approximately 27.5 kips, and cracks began to occur at approximately 30 kips. These figures and numbers allowed the
researchers to learn about UHPC behavior under loading, and approximate values of when UHPC is expected to crack and move from the linear to the non-linear zone.
Figure 34: Load vs. North Interface Displacement for Specimens with No. 4 Bar (Halbe, 2014)
Figure 35: Load vs. South Interface Displacement for Specimens with No 6 Bar (Halbe, 2014)
2.4.2 Ultra-High Performance Concrete Compressive Strength
Table 4 contains UHPC tensile strength results from 3 different Virginia Tech researchers [(D’Alessandro, 2013), (Halbe, 2014), (Field, 2015), (Joyce, 2014)]. All of the Virginia Tech researcher’s test results show that UHPC’s compressive strength is significantly greater than compressive strength of conventional concrete.
Table 4: Virginia Tech UHPC Compressive Strength Test Results
Researcher Specimen ID Specimen Age Average Compressive Stress (ksi) Number of Specimens Tested Halbe 1 13 Days 17.6 3 2 17.2 3 Field 3 7 Days 16.0 3 4 28 Days 19.9 3 Joyce 5 7 Days 11.3 2 6 11 Days 15.5 2 7 7 Days 11.6 2 8 11 Days 14.3 2 D'Alessandro 9 4 Days 14.5 3 10 7 Days 18.7 3 11 14 Days 19.5 3 12 21 Days 20.3 3 13 28 Days 20.8 3 14 104 Days 24.9 3
2.4.3 Ultra-High Performance Concrete Tensile Strength
Table 5 contains UHPC tensile strength results from 3 different Virginia Tech researchers [(D’Alessandro, 2013), (Halbe, 2014), (Field, 2015)]. Fields concluded that the due to the steel fibers, UHPC exhibited strong splitting tensile strength and post
cracking behavior. Additionally, the UHPC was much more durable (scaling surface tests), making it a good option for shear keys where durability is key.
Table 5: Virginia Tech UHPC Tensile Strength Test Results
Researcher Specimen ID Specimen Age
Average Tensile Strength (ksi) Number of Specimens Tested Halbe 1 13 Days 2.04 3 2 13 Days 2.20 3 Field 3 7 Days 1.81 2 4 28 Days 2.40 2 D'Alessandro 5 7 Days 2.35 3 6 14 Days 2.79 3 7 196 Days 3.44 2
2.4.4 Ultra-High Performance Concrete Bond Strength
In 2014, Graybeal submitted a report and guidance on how field-cast UHPC connections should be constructed to provide a stronger and more durable connection between precast girders. Since the bond strength between UHPC and the precast concrete is much stronger than conventional grout, shorter rebar development lengths are allowed (Graybeal, 2014). Figure 36 from (Joyce, 2014) illustrates the bond strength of UHPC, very high performance concrete (VHPC), and conventional grout to precast concrete, respectively. The UHPC was named Ductal and produced by Lafarge. The VHPC mix was developed at Virginia Tech. It is similar to UHPC, but has less strength.
Bond strength was measured via the pull-off test. In addition to UHPC, a mix labeled “VHPC Large” was used in the research. VHPC-Large takes the original mix design of VHPC and substitutes the small aggregate for large aggregate. VHPC-Large mix design is shown in Table 6. Figure 37 shows UHPC and VHPC-Large’s significant
bond strength compared to conventional grout, making it a useful substitute for grout in bridge joints.
Table 6: VHPC-Large Mix Design (Joyce, 2014) Figure 36: Bond Strength to Precast Concrete (Joyce, 2014)
Table 7 from Halbe (2014) illustrates the bond strength of UHPC, very high performance concrete (VHPC), and conventional grout to precast concrete, respectively. A schedule of the specimen types can be found in table 8. Mix designs for the UHPC and VHPC are shown in Table 9.
Table 7: Bond Strength to Precast Concrete (Halbe, 2014)
Table 8: Specimen Test Schedule (Halbe, 2014)
Specimen Type
Bond Strength (psi)
Age (Days) Test
Start Test End
1 Grout N/A N/A 76
2 UHPC 195 204 96
3 UHPC 79 93 128
4 Grout 68 74 170
5 VHPC 35 86 187
Table 9: UHPC and VHPC Mix Proportions (Halbe, 2014)
2.4.5 Ultra-High Performance Concrete in Joint Connections
In a study funded by the FHWA, UHPC deck connections between six different precast deck panels were tested under cyclic and static loadings (Graybeal, 2010). UHPC was used in both transverse and longitudinal connections between precast members. The specimens were first loaded to an amount below cracking strength for 2 million cycles, then 5 million cycles to a load larger than cracking strength. Finally, the specimens were statically loaded until failure.
Two of the six specimen tests were loaded in order to test the longitudinal joint. Figures 37 and 38 below, show the joint reinforcement details for the two longitudinal joint specimens. The average compressive strength of UHPC in the joint was 31.8 ksi. The concrete panels were fabricated using a high performance concrete (HPC) with 28-day compressive strength of 6.5 ksi.
Figure 37: Layout and Rebar plan for Concrete Panel 6H (Graybeal, 2010)
Figure 38: Layout and Rebar plan for Concrete Panel 6B (Graybeal, 2010)
The deck panels were designed and fabricated in a way to simulate a longitudinal joint connection between the top flanges of adjacent bridge girders. The test specimens were loaded in three-point bending to induce flexural stresses in the longitudinal joint, as shown in Figure 39.
The panel specimens were instrumented with both strain gauges and LVDTs, as shown in Figure 40. The LVDT was instrumented in such a way to capture any opening at the UHPC joint. Figure 41 shows a graph of the joint opening data as the test specimen went through the cyclic load test. 10,154,101 cycles were performed at a load range between 3 and 21.5 kips. 1,118,000 amount of cycles were performed between 3 and 32 kips. Minimal joint deflection was detected during the first two cyclic load phases as shown in figure 41. The final cyclic phase loaded the test specimen from 3 to 40 kips for 343,399 cycles, at which point the specimen failed along the joint interface. In the final loading phase, a joint opening of approximately 0.28 in. was detected before failure of the specimen. This data will be used as a reference to compare with the Hanging Rock Bridge LVDT test data measuring relative horizontal displacement at the joints.
Figure 40: Concrete Panel with UHPC Joint Instrumentation Setup (Graybeal, 2010)
Figure 42 is a picture of Graybeal’s recommended UHPC detail for adjacent box beams. This structural connection allows the transfer of shear, moment, and axial forces across the joint. Additionally, no transverse post-tensioning or concrete overlay is needed. Graybeal (2014) states that this connection can easily be applied to the flange tips of NEXT beams. The connection is very similar to Kedar Halbe’s flange spliced connection from his Virginia Tech dissertation mentioned in Literature Review section 2.3.1. It is important to research and observe how different connection details can positively influence the bond between precast concrete elements. These same tactics could later be applied to help NEXT D connection design.
Figure 41: Graph of Load vs. Joint Opening for test specimen 6B (Graybeal, 2010)
Figure 43 from a PCI bridge technical committee displays several different options for NEXT D beam joint detailing. There are options for both UHPC and non-shrink grout shear keys. Vermont Agency of Transportation (VAOT) has built several bridges with the non-shrink grout and hooked bars and has not noted any issues with the joints (Culmo Email September 22, 2016).
Researchers at Clemson University tested a joint very similar to the hooked bar detail from figure 43. The purpose was to evaluate the performance of the proposed shear key configuration that SCDOT was hoping to use for NEXT D beam joints. Figure 44, shows the shear key detail of the 11 specimens tested.
Figure 43: NEXT D Joint Details for Non-shrink Grout and UHPC (Culmo Email September 22, 2016)
Three different materials were used for the shear key: Grout with polyvinyl alcohol (PVA) fiber, UHPC with steel fiber, and UHPC with PVA fiber. Two precast panels were connected via joint and then instrumented with gauges. After
instrumentation, specimens were loaded both statically and cyclically. Instrumentation layout can be seen in figure 45. Table 10 shows different specimens and their respective shear key mixtures.
Table 10: Test Matrix for Static Tests (Sheng et al., 2013)
Figure 45: Strain Gauge and LVDT Layout for Shear Key Test (Sheng et al., 2013)
During the static tests, bond interface cracks were recorded as 121 kip-in., 277 kip-in., 183 kip-in., 247 kip-in., 285 kip-in., and 285 kip-in. for specimens STA-01 to STA-06, respectively. These values were determined from the moment-curvature curves taken from LVDT readings. The max moment capacities for these specimens were 763.5 kip-in, 742.5 kip-in, 736.6 kip-in, 738 kip-in, 650 kip-in, and 634.1 kip-in,
respectively. Fatigue/service load capacities for specimens FAT-01 through FAT-04 were 5.3 kip (110 kip-in of internal moment), 8.7 kip, 4.9 kip, and 8.1 kip respectively. No relative horizontal displacements were included in the report. A main conclusion from the report was that UHPC was the recommended NEXT D shear key material since it was adequately strong, ductile, and stiff.
2.5 Field Test of Adjacent Beam Bridges
2.5.1 Suck Creek Bridge
Researchers at Clemson University performed a live load test at the Suck Creek Bridge in South Carolina in order to understand the bridge’s load-sharing abilities and behaviors (Sheng et al., 2013). Specifically, the goal of the testing was to analyze the data and explain why reflective cracking was forming on the wearing surface of the bridge. Figure 46, shows a cross section of the bridge deck.
LVDTs and strain gauges were used in bridge instrumentation. LVDTs captured the global displacements of the bridge and local displacements across the shear key. The LVDT instrumentation setup is shown in figures 47 and 48.
Figure 46: Cross Section of Suck Creek Bridge (Sheng et al., 2013)
A weighted dump truck was driven over the bridge (figure 49) and data was recorded. Joint displacement can be seen in table 11. The relative deflections were fairly large, and it was determined that these relative vertical and angular displacements were causing reflective cracking. The relative deflections have been included to compare with deflections measured from the solid slab span live load test of the Hanging Rock Creek Bridge.
Figure 48: LVDT Locations for First Test (Sheng et al., 2013)
Table 11: Displacement Values from First Bridge Test (Sheng et al., 2013)
2.5.2 Arden Road Bridge
Researchers at Virginia tech performed a live load test at the Arden Road Bridge in Nokesville, VA to understand the bridge’s load-sharing abilities and behaviors (Halbe, 2014). Specifically, the goal of the testing was to analyze the data and analyze the
LVDTs and strain gauges were used in bridge instrumentation. LVDTs captured the global displacements of the bridge and local displacements across the shear key. The bridge instrumentation is shown in figure 51.