Gene Expression Profiling of
Encephalitogenic CD4
+
T cells:
Identification of Genes Controlling
Migration of Effector T cells into the CNS
Dissertation der Fakultät für Biologie
der Ludwig-Maximilian-Universität München
von
Vijay Kumar Ulaganathan
aus
Chennai (Madras)
Erklärung
Hiermit erkläre ich ehrenwörtlich, dass ich die vorliegende Dissertation selbstständig und ohne unerlaubte Hilfe angefertigt habe. Die Arbeit wird hiermit erstmalig einer
Prüfungskommission vorgelegt.
München, den
Vijay Kumar Ulaganathan
Eingereicht am: 12 April 2010
Mitglieder der Promotionskommission:
Erster Gutacher:
Professor Dr. Tobias Bonhoeffer
Zweiter Gutacher:
Professor Dr. Elisabeth Weiss
Sonderberichterstatter:
Professor Dr. Alexander Flügel
Table of Contents
Table of Contents ... i
List of Tables ... iii
List of Figures ... v
Summary ... 1
1. Introduction ... 3
1.1 Multiple sclerosis ... 3
1.2 Clinical course ... 4
1.2.1 Relapsing-remitting MS ... 4
1.2.2 Secondary progressive MS ... 4
1.2.3 Primary progressive MS ... 4
1.2.4 Progressive relapsing MS ... 5
1.3 Diagnosis ... 5
1.4 Pathogenesis ... 5
1.5 Experimental autoimmune encephalomyelitis ... 6
1.6 EAE in Lewis rats ... 6
1.6.1 Active EAE in Lewis rats ... 6
1.6.2 Adoptive transfer EAE in Lewis rats ... 7
1.7 T lymphocyte migration to the CNS in AT-EAE ... 8
1.8 Targeting T cell migration: Therapeutic strategies for multiple sclerosis ... 10
2 Objectives... 13
3. Materials ... 15
3.1 Animals ... 15
3.2 Cell lines ... 15
3.3 Plasmids ... 16
3.4 Antigens ... 16
3.5 Antibodies ... 16
3.6 Buffers and Reagents ... 17
4. Methods ... 23
4.1 Generation of antigen specific T cells ... 23
4.2 Retroviral transduction of antigen specific T cells ... 23
4.3 Recombinant DNA cloning ... 24
4.4 Proliferation assay for T cells ... 25
4.5 Cytofluorometry FACS ... 25
4.6 Quantitative polymerase chain reaction ... 25
4.7 EAE induction ... 27
4.8 Memory animal generation ... 27
4.9 In vitro matrigel motility assay ... 27
4.10 Microarray data analysis ... 28
4.11 Dual luciferase assay ... 29
4.12 Bioinformatics ... 30
5. Results ... 31
5.1 Microarray analysis of encephalitogenic T cells ... 31
5.3 Gene Ontology based analysis of microarray expression data ... 42
5.4 Pathway based analysis of microarray data ... 46
5.5.1 PCR based validation ... 56
5.5.2 Antibody based validation ... 58
5.6 Bioinformatics prediction of KLF4 as a common transcriptional regulator for inflammatory chemokine receptors ... 59
5.7 Overexpression of KLF4 induces cell cycle arrest and upregulates CCR2 and CCR5... 62
5.8 Transcriptional activity of KLF4 on CCR2 and CCR5 promoters ... 65
5.9 Identification of differentially regulated membrane molecules as potential candidate genes ... 66
5.10 EMP1 as a novel candidate gene ... 69
5.11 Bioinformatics based structural features of EMP1 ... 69
5.12 Expression of EMP1 in T cells ... 73
5.13 Cloning of EMP1 full length cDNA from activated TMBP-GFP cells ... 75
5.14 Analysis of gene expression changes in EMP1 overexpressing T cells ... 76
5.15 EMP1 overexpressing T cells proliferate normally ... 78
5.16 Overexpression of EMP1 induces enhanced T cell motility in matrigel ... 79
5.17 EMP1 overexpressing encephalitogenic T cells induce accelerated onset of EAE ... 80
5.18 EMP1 overexpressing T cells infiltrate earlier into the CNS parenchyma ... 88
6. Discussion... 89
7. References ... 97
Abbreviations ... 105
Appendix 1. ... 109
Appendix 2. ... 127
Appendix 3. ... 143
Appendix 4 ... 159
Curriculum Vitae ... 161
Publications ... 163
List of Tables
Table 3. 1 List of mammalian cell lines used. ... 15
Table 3. 2 List of plasmids used. ... 16
Table 3. 3 List of primary antibodies used. ... 17
Table 3. 4 List of secondary antibodies used. ... 17
Table 4. 1 List of primers used for recombinant DNA cloning. ... 24
Table 4. 2 List of Taqman primers and probes used for qPCR. ... 27
Table 5. 1 A summary of differentially regulated transcripts from microarray dataset. . ... 32
Table 5. 2 GO: Molecular Class based annotations of differentially regulated transcripts in Tactivated transcriptome ... 44
Table 5. 3 GO: Molecular Class based annotations of differentially regulated transcripts in Tmigratory transcriptome ... 44
Table 5. 4 GO: Biological Process based annotation of differentially regulated transcripts in Tactivated transcriptome ... 45
Table 5. 5 GO: Biological Process based annotation of differentially regulated transcripts in Tmigratory transcriptome ... 45
Table 5. 6 qPCR and microarray data indicating up regulation of quiescence factors. .. ... 51
Table 5. 7 List of genes selected for microarray data validation by quantitative PCR. .. ... 56
Table 5. 8 Inflammatory chemokine receptors’ transcripts are upregulated in Tmigratory transcriptome. ... 59
Table 5. 9 KLF4 binding motifs are present in inflammatory chemokine receptors. . 61
Table 5. 10 Overexpression of KLF4 upregulates CCR2 and CCR5 in ovalbumin-specific T cells. ... 64
Table 5. 11 List of cell membrane receptors which are established drug targets for multiple sclerosis ... 67
Table 5. 12 List of cell membrane molecules differentially regulated in Tspleen cells compared to Tblast cells as indicated by microarray data. ... 69
Table 5. 13 Prediction for transmembrane helix regions in EMP1 amino acid sequence. ... 69
List of Figures
Figure 1. 1 Schematic representation of different clinical forms of MS. ... 4
Figure 1. 2 Clinical course of AT-EAE in Lewis rats. ... 7
Figure 1. 3 Illustration depicting the mode of action of natalizumab. ... 11
Figure 4. 1 Diagrammatic representation of time lapse video microscopy setup for matrigel motility assay. ... 28
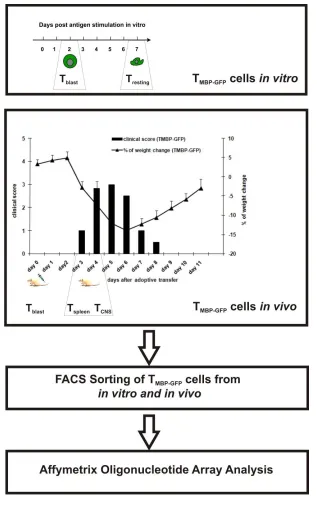
Figure 5. 1 Schematic illustration of green fluorescent TMBP-GFP cell sorting using FACS from different milieus and subsequent microarray analysis. ... 35
Figure 5. 2 Microarray dataset viewed as expression plot. ... 36
Figure 5. 3 Heat Map representation of cluster analysis of annotated genes. ... 37
Figure 5. 4 Depiction of cluster A-F. ... 38
Figure 5. 5 Pie chart analysis of clusters A to F. ... 39
Figure 5. 6 Cell cycle genes and chemokine receptors are clustered. ... 40
Figure 5. 7 Differential regulation of cell migration and cell cycle processes. ... 41
Figure 5. 8 Cholesterol biosynthetic pathway is upregulated in Tactivated transcriptome. ... 47
Figure 5. 9 Cholesterol biosynthetic pathway is downregulated in Tmigratory transcriptome. ... 48
Figure 5. 10 Cell cycle pathway is upregulated in Tactivated transcriptome. ... 49
Figure 5. 11 Cell cycle pathway is downregulated in Tmigratory transcriptome. ... 50
Figure 5. 12 Cell migration pathway is upregulated in Tmigratory transcriptome. ... 53
Figure 5. 13 Intracellular propidium iodide staining of DNA for cell cycle analysis by flow cytometry. ... 54
Figure 5. 14 Validation of microarray data by qPCR. ... 57
Figure 5. 15 Differential regulation of KLF4 in vivo. ... 58
Figure 5. 16 Inflammatory chemokine receptors are upregulated in Tspleen. ... 60
Figure 5. 17 Inflammatory chemokine receptors are clustered in the genome. ... 60
Figure 5. 18 Standardization of KLF4 qPCR primers. ... 62
Figure 5. 19 Overexpression of KLF4 inhibits cell cycle progression in MBP-specific T cells. ... 62
Figure 5. 20 Overexpression of KLF4 upregulates CCR2, CCR5 but not CXCR3 in MBP specific T cells. ... 63
Figure 5. 21 Overexpression of KLF4 upregulates CCR2 and CCR5 in RBL1 cell lines. ... 64
Figure 5. 22 Dual luciferase assay for CCR2, CCR5 and CXCR3 promoter activity. 65 Figure 5. 23 ClustalW multiple sequence alignment of mammalian EMP1 protein sequences. ... 70
Figure 5. 24 Phylogram tree for mammalian EMP1 are related. ... 70
Figure 5. 25 ClustalW multiple sequence alignment of rat EMP1 family amino acid sequences. ... 71
Figure 5. 26 Computer based prediction of EMP1 topology. ... 72
Figure 5. 27 Standardization of EMP1, EMP2 and EMP3 qPCR primers. ... 73
Figure 5. 28 Differential regulation of EMP1 family genes in T cells. ... 74
Figure 5. 29 EMP1 protein detection in activated T lymphocytes. ... 74
Figure 5. 31 Gene overexpression of EMP1 in activated T cells. ... 76
Figure 5. 32 Gene expression of cytokines. ... 77
Figure 5. 33 Gene expression of transcription factors. ... 77
Figure 5. 34 Proliferation assay of in vitro cultured T cells. ... 78
Figure 5. 35 Matrigel T lymphocyte motility assay in vitro. ... 79
Figure 5. 36 Adoptive transfer EAE induced by intraperitoneal injection and migratory pattern of encephalitogenic T cells in vivo 5 days post intra peritoneal injection. ... 81
Figure 5. 37 Adoptive transfer EAE induced by sub cutaneous injection and migratory pattern of encephalitogenic T cells in vivo 5 days post sub cutaneous injection. ... 82
Figure 5. 38 Adoptive transfer EAE induced by intra venous injection and migratory pattern of encephalitogenic T cells 4 days in vivo post intra-venous injection. ... 83
Figure 5. 39 Migration of EMP1 overexpressing T cells to the draining lymph nodes. . ... 84
Figure 5. 40 Active EAE induced in memory animals by MBP/CFA immunization. 84 Figure 5. 41 Encephalitogenic T cell infiltration to CNS post AT-EAE induction. .... 87
Figure 5. 42 Encephalitogenic T cell migration coincides with expression of T cell specific genes in CNS post AT-EAE. ... 88
Summary
T cells directed against brain antigens are generally held to play a crucial role in the initiation of multiple sclerosis (MS). This was deduced from experimental autoimmune encephalomyelitis (EAE). In this model for MS, T cells reactive for myelin antigens induced a severe paralytic disease upon transfer to healthy syngeneic recipients. Intriguingly, the disease does not start immediately upon transfer of the pathogenic effector T cells. Instead, as earlier studies have shown, the effector T cells attack their target organ only after having migrated in the periphery through secondary lymphoid organs. The aim of the project was to characterize the functional properties of these migrating encephalitogenic T cells during the course of EAE and to identify biological pathways which determine their migratory behaviour and pathogenic potential. To this end, average linkage hierarchical clustering, pathway and gene ontology (GO) analyses of transcriptomes from cultured and ex vivo-isolated myelin basic protein-reactive T cells (TMBP cells) were performed.
At the time of transfer, encephalitogenic T cells in vitro are maximally activated, i.e. they exhibit a prominent upregulation of cell cycle genes such as cyclin A2 (CCNA2) and cyclin B2 (CCNB2) among others. In contrast, T cells isolated from spleen 3 days post transfer, downregulated activation markers such as interleukin 2 receptor (IL2R) and
interferon γ (IFNγ), and at the same time upregulated migration specific genes such as
within the extracellular matrix milieu in vitro and promoted T cell migration from the connective tissue to lymph nodes in vivo resulting in an accelerated onset of EAE.
1.
Introduction
Our organism is constantly exposed to a wide variety of microbial pathogens. The system that comes into play to protect us from these everyday invaders is a complicated and highly precise mechanism called the immune system. The adaptive immune system consists of antigen presenting cells (APCs) and lymphocytes which together coordinate the recognition and elimination of any invading pathogen. In most cases this system is highly effective i.e., the pathogen is eliminated without any lasting damage to host tissues. But there are circumstances, as in the case of autoimmune diseases, when T cells can mount an immune response directed against self-tissues with detrimental consequences. Autoimmune diseases affect approximately 5% of the population in western countries. The exact cause of autoimmune diseases is largely unknown. However, several environmental and genetic factors are known to contribute to the triggering of an autoimmune reaction. Autoimmune disorders are divided into two categories: systemic and localized. Systemic autoimmune disorders, such as rheumatoid arthritis or lupus, affect many organs of the body simultaneously, while localized disorders, such as type I diabetes, Crohn’s disease or multiple sclerosis, afflict only one organ.
1.1
Multiple sclerosis
1.2 Clinical course
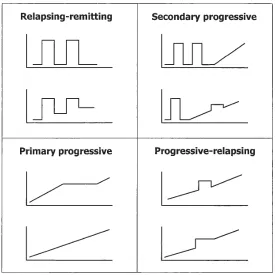
In 1996 the United States National Multiple Sclerosis Society standardized four subtype definitions (1). These are termed as the primary-progressive (PP)-, secondary-progressive (SP)-, relapsing-remitting (RR)- and progressive-relapsing (PR)-MS (Figure 1. 1).
Figure 1. 1 Schematic representation of different clinical forms of MS.
Image adapted from Kieseier et al (2).
1.2.1 Relapsing-remitting MS
Approximately 85% of MS patients present RRMS, which is characterized by disease relapses with full recovery
1.2.2 Secondary progressive MS
SPMS is characterized by disease progression with or without occasional relapses. At least 50% of patients with RRMS will transition into SPMS.
1.2.3 Primary progressive MS
1.2.4 Progressive relapsing MS
This is the least common form presenting a progressive course with acute relapses with or without full recovery.
1.3
Diagnosis
According to the McDonald criteria, magnetic resonance imaging (MRI) evidence of CNS lesions disseminated in time and space is sufficient for a diagnosis of MS even before clinical symptoms have occurred. The McDonald criteria define the Barkhof-Tintore MRI criteria requiring 3 of the following 4 elements: (i) at least one gadolinium-enhancing lesion or 9 T2 hyper intense lesions; (ii) at least one infractentorial lesion; (iii) at least one juxtacortical lesion; and (iv) at least 3 periventricular lesions.
1.4
Pathogenesis
The aetiology of MS is still unclear but recent data point to a combination of genetic and environmental factors. Evidence for the role of genetic factors comes from the MS susceptibility gene localized to the major histocompatibility complex (MHC). The proportion of the total genetic susceptibility explained by the MHC locus is estimated to range between 20% and 50% (3). According to the knowledge obtained from experimental autoimmune encephalomyelitis (EAE) studies, peripherally activated autoreactive CD4+ T cells enter the CNS and recognize auto-antigens, thereby releasing proinflammatory cytokines. Cytokines such as IFNγ and tumour necrosis factor-α
1.5
Experimental autoimmune encephalomyelitis
Experimental autoimmune encephalomyelitis is one of the well characterized animal models of human MS. Since its first description in primates (7), EAE has been replicated in a wide range of species including guinea pigs (8), rabbits (9), goats (10), mice (11), rats (12), hamsters (13), dogs (14), sheep (15), marmosets (16) and chickens (17). Studies from animal models have provided strong evidence for brain antigen specific T lymphocytes being the pathogenic mediators of EAE.
1.6
EAE in Lewis rats
1.6.1 Active EAE in Lewis rats
1.6.2 Adoptive transfer EAE in Lewis rats
Adoptive-transfer EAE (AT-EAE) is an important experimental tool for the investigation of T cell function and regulation in neuroinflammation and autoimmune diseases. AT-EAE in Lewis rat is induced by injection of 5 to 10 million freshly activated TMBP cells.
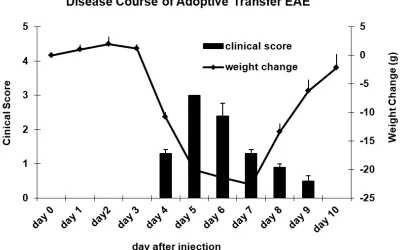
The animals are monitored daily for neurological signs and weight change. Clinical EAE is graded in five scores: 0.5, loss of tail tonus; 1, tail paralysis; 2, gait disturbance; 3, hind limb paralysis; 4, tetraparesis; and 5, death. The disease is highly predictable and is typically monophasic and self-limited (Figure 1. 2). One of the consistent feature of this disease model is that, irrespective of the number of cells injected, clinical and histological changes do not develop in the CNS immediately upon cell transfer but only after a preclinical latency period of at least 3 days (22). Studies using AT-EAE in experimental animals has provided many insights into the behaviour of pathogenic T cells culminating in the design of T cell directed therapies (23).
Figure 1. 2 Clinical course of AT-EAE in Lewis rats.
1.7
T lymphocyte migration to the CNS in AT-EAE
The concept of the BBB was originally introduced by the German bacteriologist, Paul Ehrlich during the late 1800s. He found that intravenous injection of dyes into the bloodstream stained all tissues in most organs except the brain.
The BBB is formed by highly specialized endothelial cells, which inhibit transcellular passage of molecules across the barrier by an extremely low pinocytic activity (39). The endothelial cells of the brain are different in many ways from those found in the peripheral tissues. Brain endothelial cells are joined by tight junctions of high electrical resistance providing an effective barrier against molecules. Only molecules that have a molecular weight less than 500 Daltons can reliably pass through the BBB (40).
The CNS is generally considered as an immunologically privileged site owing to the presence of the BBB, its lack of lymphatic vessels and the absence of classical MHC-positive antigen presenting cells. However, recent evidence points to immunosurveillance of the CNS taking place and that only freshly activated T cells and not resting T cells can enter the CNS. Adoptive transfer experiments using TMBP cells indicate that instead of
immediately infiltrating the CNS after activation, they undergo a functional tuning process, which enable them to cross the blood-brain barrier. This preclinical phase normally lasts for 3 to 4 days, during which TMBP cells are distributed in the peripheral
lymphoid organs.
The exact molecular and cellular mechanisms guiding activated encephalitogenic T cells into the CNS during this early preclinical phase are not clearly understood. However, according to the traditional view the T cell infiltration into the CNS follows a biphasic course in EAE (20,41). The first phase consists of ‘pioneer T cells’, that infiltrate within a few hours after transfer and encounter their antigen presented by local antigen-presenting cells (42). This first entry of TMBP effector cells supposedly converts
the CNS from an immune hostile environment to an immune friendly environment facilitating inflammation. Subsequently, after an interval of 3-4 days, a second wave composed of millions of effector TMBP cells enters the CNS, marking the onset of
recovery is considered to be due to enhanced apoptosis of inflammatory T cells in the lesion (43).
Recent studies using green fluorescent labelled encephalitogenic MBP-specific T cells (TMBP-GFP) in vivo imply that a transcriptomic programming in the periphery is
essential for enabling effector T cell migration into the CNS. (44). Importantly, on their way to CNS these TMBP-GFP cells undergo functional changes in peripheral organs, from
maximal activation to migratory state, characterized by downregulation of activation markers, an upregulation of chemokine receptors and an increase of MHC class II molecules on their surface. Eventually, upon arrival to the CNS, migratory TMBP-GFP cells
undergo reactivation as a result of cognate antigen recognition presented by local antigen presenting cells and set the stage for inflammatory leukocyte infiltration. Several pieces of evidence support this hypothesis. Firstly, retransfer of TMBP-GFP cells from the spleen of
an EAE rat 3 days post adoptive transfer to naïve syngeneic rats results in TMBP-GFP cell
infiltration into the CNS within 24 hours (Streyl et al, unpublished). Moreover, surgical connection of blood circulation of an EAE animal (3 days post adoptive transfer of T
MBP-GFP cells) to naïve rat also results in early infiltration of TMBP-GFP cells. In order to migrate
to the CNS TMBP-GFP cells undergo post activation phenotypic changes in the periphery.
It follows, therefore, that deeper insights into the molecular changes of TMBP-GFP
1.8
Targeting T cell migration: Therapeutic strategies for multiple
sclerosis
Cell motility is crucial for the effective function of T lymphocyte and immune homeostasis. Priming of lymphocytes for adaptive immune responses requires their migration from the blood stream to lymph nodes to allow their interaction with antigen loaded APCs. Distinct lymphocyte subsets use different combinations of cell migration factors on their surface to orchestrate effector functions and for general immune surveillance. Lymphocyte homing to skin requires the expression of selectin E (SELE) and selectin P (SELP) ligands, CC-chemokine receptor 4 (CCR4) and CC-chemokine receptor 10 (CCR10) (45). Likewise, lymphocyte tropism for the intestines is controlled
by expression of the intestine homing receptor α4β7 and CC-chemokine receptor 9
(CCR9) which binds to mucosal addressin cell adhesion molecule 1 (MAdCAM1) and CC-chemokine ligand 25 (CCL25), respectively (46). Up to now, no adhesion molecule combination has been defined that specifically target (effector) T cells to the CNS.
Development of new treatments for MS would require a detailed understanding of the molecular mechanisms of autoreactive T cell migration to the brain. In healthy condition, only a limited number of T lymphocytes are able to cross the BBB and penetrate the CNS. In MS, there is an increased permeability of the BBB leading to an increased transmigration of autoreactive T lymphocytes. After activation, they recruit lymphocytes, macrophages and B cells which induce damage to the CNS. Blocking the migration of T lymphocytes across the BBB has long been considered a promising therapeutic approach to autoimmune diseases of the CNS. The first such agent limiting T cell migration to CNS and representing a breakthrough for the treatment of MS, is a monoclonal antibody (mAb) called natalizumab (Tysabri). Natalizumab is a humanized
monoclonal antibody to α4β1 integrin. The integrin heterodimer α4β1 has two binding
integrin by natalizumab blocked clinical paralysis in various animal models of MS and has also been approved for treatment of MS.
Figure 1. 3 Illustration depicting the mode of action of natalizumab.
2
Objectives
Studies using the AT-EAE model for MS have shown that activated encephalitogenic T cells undergo functional changes in the peripheral lymphoid organs such as spleen before migrating to the CNS. There is a phenotypic change from the activated T cell state to migratory T cell state with downregulation of activation markers and upregulation of chemokine receptors. However, still lacking was a detailed understanding of the transcriptomic changes between these different T cell states. The objectives of this thesis were:-
1. To characterize the genome-wide transcriptomic changes in TMBP-GFP CD4+ T
cells during the pre-clinical course of AT-EAE.
2. To identify the molecular link between T cell activation and the T cell migratory state.
3.
Materials
3.1
Animals
Lewis rats aged 6-8 weeks old were obtained from the animal facility of Max Planck Institute for Biochemistry (Martinsried, Germany). All animal experiments were performed as per the guidelines of the Bavarian state regulations for animal experimentation.
3.2
Cell lines
Cell Line Description Catalogue
Number
Company
NIH/3T3 Mouse embryonic fibroblast cell
line derived from NIH/Swiss strain CRL-1658 LGC/ATCC
RBL1
Rat basophilic leukaemia cell line derived from Wistar rat peripheral blood
CRL-1378 LGC/ATCC
293T
Human embryonic kidney cell line transformed with adenovirus E1a and carrying a temperature sensitive T antigen.
CRL-11268 LGC/ATCC
Phoenix™-Eco
293T cell line carrying genes for gag-pol and envelope protein for generation of ecotropic retroviruses.
RVK-10001 Orbigen
GP+E 86 cell line
NIH/3T3 cell line carrying genes for gag-pol and envelope protein for generation of ecotropic retroviruses.
CRL-9642 LGC/ATCC
3.3
Plasmids
Plasmid Name Use Company
pMSCVneo Mammalian ecotropic retroviral expression
plasmid DNA Clonetech
pIRES2-EGFP Mammalian expression plasmid DNA Clonetech
pRNAT-H1.4/Retro Mammalian siRNA retroviral expression
plasmid DNA Genscript
pGEMTEASY TA cloning plasmid DNA Promega pGL3basic Luciferase reporter plasmid DNA Promega
Table 3. 2 List of plasmids used.
3.4
Antigens
Myelin basic protein (MBP was prepared from guinea pig brain homogenates as reported (48). S100 calcium binding protein β (S100β) and ovalbumin (OVA) were obtained from Sigma-Aldrich.
3.5
Antibodies
Primary Antibodies (Clone)
Isotype Specificity Applications Company
CD45RC (OX22)
Mouse
IgG1κ Rat FACS Serotec
CD4 (W3/25)
Mouse
IgG1κ Rat FACS Serotec
αβTCR
(R73)
Mouse
IgG1κ Rat FACS Serotec
MHC-II (OX6)
Mouse
IgG1κ Rat FACS
Purified from hybridoma culture supernatant
(WT.1) IgG1κ
EMP1 Rabbit IgG
Mouse, Rat, Cow, Dog & Human
WB, IF, IP & ELISA
Santa Cruz biotechnology
KLF4 Rabbit IgG Human & Rodent
WB, IC, IH
Affinity BioReagents
PAN
ACTIN Rabbit IgG
Human & Rodent
WB, IC Cell signalling technology
Table 3. 3 List of primary antibodies used.
FACS-Fluorescence Activated Cell Sorting, ELISA-Enzyme Linked Immunosorbent Assay, IC- Immunocytochemistry, IF-Immunofluorescence, IH-Immunohistochem, IP- Immunoprecipitation, WB -Western Blot.
Secondary Antibodies Host Conjugation Company
Anti-mouse Goat Allophycocyanin Invitrogen Anti-goat Donkey Allophycocyanin Dianova
Anti-rabbit Goat Allophycocyanin Jackson ImmunoResearch
Table 3. 4 List of secondary antibodies used.
3.6
Buffers and Reagents
Cell culture medium and buffers
Dulbecco’s modified Eagle’s medium (DMEM) for 5 L
DMEM powder (Gibco) specified amount
Sodium bicarbonate (Merck) 18.5 g
Distilled water quantum sufficit (q.s.) to 5 L
T-cell medium (TCM) for 1 L
Glutamine (200 mM) (Gibco) 10 mL
β-mercaptoethanol (Merck) 4 μL
DMEM medium q.s. to 1000 mL
Re-stimulation medium (RM) for T cells
Fresh autologous rat serum 1 mL
TCM q.s. to 100 mL
T cell culture medium with growth factor (TCGF)
Supernatant from ConA (Pharmacia Biotech) stimulated mouse splenocytes as a source of IL2 and other growth factors 30 mL
Inactivated horse serum (PAA Lab) 50 mL
TCM q.s. to 500 mL
Eagle’s HEPES solution (EH)
HEPES (Gibco) 125 mL
DMEM medium q.s. to 5 L
Freezing medium
Inactivated horse serum (PAA Lab) 80 mL Dimethyl sulfoxide (Sigma) 10 mL
TCM 10 mL
Phosphate buffered saline (PBS)
Sodium chloride (Merck) 137 mM
Potassium chloride (Merck) 2.7 mM Disodium hydrogen phosphate (Merck) 4.3 mM Potassium dihydrogen phosphate (Merck) 1.47 mM
Distilled water 800 mL
Ammonium chloride-potassium (ACK)-erythrocyte lysing buffer Ammonium chloride (Merck) 0.15 M Potassium bicarbonate (Merck) 10 mM Ethylene diamine tetra acetic acid (Merck) 0.1 mM
Distilled water 800 mL
Adjusted pH to 7.4 and volume made up to 1 L using distilled water and sterilized by filtration
Hypoxanthine-Xanthine-Mycophenolic acid (HXM) medium
Hypoxanthine (Sigma) 15 μg/mL
Xanthine (Sigma) 250 μg/mL
Mycophenolic acid (Sigma) 25 μg/mL Inactivated fetal calf serum (PAA Lab) 50 mL
DMEM medium q.s. to 500 mL
Reagents for density gradient
Blood lymphocyte gradient
Heparin (5000 U/mL) (Sigma) 100 μL
Optiprep (Nycomed Pharma) 0.63 mL/5 mL blood
CNS lymphocyte gradient
Percol isotonic solution (1.124 g/mL) (Biochem AG) 10.8 mL Percol underlay solution (1.077 g/mL) (Biochem AG) 10 mL
FACS buffers
FACS buffer for surface staining
Rat serum 3 mL
FACS buffer for surface staining of EMP1
Bovine serum albumin (BSA) (Sigma) 1 g
Sodium azide (Merck) 1 g
PBS q.s. to 100 mL
FACS buffer for intracellular staining
Fixation solution
Paraformaldehyde (PFA) (Merck) 4 g
PBS q.s. to 100 mL
Permeabilization solution
Triton X 100 (Carl Roth) 1 mL
PBS q.s. to 100 mL
or
Methanol (Merck) 90% in PBS
Incubation buffer
PBS 100 mL
BSA (Sigma) 0.5 g
Transfection reagents
Chloroquine solution 1000×
Chlroquine diphosphate (Sigma) 100 mM
Distilled water q.s. to 10 mL
Calcium chloride solution (2 M)
Calcium chloride (Merck) 29.4 g
Distilled water q.s. to 100 mL
HEPES-buffered saline (HBS) 2×
HEPES (Gibco) 50 mM
Sodium chloride (Merck) 280 mM
Adjusted pH exactly to 6.95 using Hydrochloric acid (HCl) (Merck) followed by sterilization by filtration through 0.2 μm filter. Small volume aliquot were stored at -20° C
Western Blot buffers
2× Sample Buffer
0.5 M Tris-HCl, pH 6.8 1.25 mL
Glycerol (Carl Roth) 2.5 mL
Sodium dodecyl sulphate (SDS) (Carl Roth) 10% (w/v) 2.0 mL Bromophenol blue (Sigma) 0.5% (w/v) 0.2 mL
Deionized water 3.5 mL
50 μL of β-mercaptoethanol (Merck) added to 950 μL of sample buffer before
use.
SDS-poly acrylamide gel electrophoresis (PAGE) Running Buffer 10×
Tris base (Sigma) 30.3 g
Glycine (Merck) 144.0 g
SDS (Carl Roth) 10.0 g
Deionized water q.s. to 1 L
SDS-PAGE Transfer Buffer
Tris base (Sigma) 3.03 g
Glycine (Merck) 14.4 g
Methanol (Merck) 200 mL
Deionized water q.s. to 1 L
TBS-T (Tris-buffered saline with tween) Wash Buffer 10×
Tris-base (Sigma) 31.52 g
Sodium Chloride (Merck) 175.32 g
Tween-20 (Sigma) 10 mL
4.
Methods
4.1
Generation of antigen specific T cells
Antigen specific T cells were generated using the method of Flügel et al, 1999 (49). Lewis rats were immunized by subcutaneous injection of 100 μg of MBP antigen emulsified in CFA (Gibco-BRL) containing 4 mg/mL Mycobacterium tuberculosis. Cells from the draining lymph nodes were isolated 10 days after immunization and cultured with a modified limiting dilution method. Lymph node cells (2×10⁵ cells/well) were cultured together with MBP (10 μg/mL) in 96-well plates for 3 days and propagated for 5-6 days in IL2 conditioned medium.
4.2
Retroviral transduction of antigen specific T cells
Retroviral packaging cells were generated using GP+E-86 cell lines (50) by adopting the established method of Flügel et al. (49). Phoenix-eco packaging cell lines were transfected with retroviral plasmids EMP1-IRES2-EGFP and pMSCVneo-IRES2EGFP (control). Two days after transfection, viral particles containing supernatant were passed through a syringe filter of 0.45 μm and were added to sub-confluent grown GP+E-86 cell lines. Viral transduced GFP positive GP+E-86 cells (EMP1 and GPE-GFP) were selected in HXM medium for several days and subsequently were FACS sorted several times to obtain 100% GFP positive GP+E-86 packaging cell lines which could produce retroviruses encoding EMP1-IRES2-GFP and GFP respectively. FACS-based viral titration using 3T3NIH cell lines was also performed to determine efficiency of virus production.
Retroviral mediated transduction of primary T lymphocytes was performed by co-cultivation with GP+E-86 packaging cells. The packaging cells were seeded in a 96 well plate (1.4×10⁶ cells per plate) and then freshly isolated draining lymph node cells obtained from 10 days post MBP/CFA immunized animals, were added to the wells at a concentration of 2 X 10⁵ cells/well together with MBP (10 μg/mL). Selection with G418
For the subsequent re-stimulation, T lymphocytes were incubated with 1×10⁶ irradiated (5000 rad) syngeneic thymocytes/well in the presence of MBP (10 μg/mL). T lymphocyte blasts cells were transferred into IL2 conditioned medium and propagated further.
4.3
Recombinant DNA cloning
For construction of a recombinant mammalian retroviral over-expression system, full length cDNA for KLF4 and EMP1 were amplified by polymerase chain reaction (PCR) from in vitro activated MBP-specific T cells and were cloned between EcoRI (Fermentas) and SacII (Fermentas) in pMSCVneoIRES2EGFP plasmid DNA. pMSCVneoIRES2EGFP was constructed by sub-cloning IRES2EGFP from pIRES2EGFP into pMSCVneo between HpaI (Fermentas) and EcoRI (Fermentas).
For construction of luciferase assay promoter plasmids, sequences from -1000 to +70 upstream of transcription start site of chemokine receptors viz, CCR2, CCR5 and CXC-chemokine receptor (CXCR3) were amplified by PCR from rat genomic DNA. CCR2 was cloned between XhoI (Fermentas); CCR5 and CXCR3 were cloned between SacI (Fermentas) and XhoI (Fermentas) sites in pGL3 basic vector. Full length KLF4 cDNA for promoter assay was cloned between EcoRI (Fermentas) and SacII (Fermentas) in pMSCVneo vector which lacks EGFP. All the constructs were sequence verified for mutations. Primers sequences used for cDNA and promoter amplification is shown in Table 4. 1.
Gene Forward (5’---3’) Reverse (5’---3’)
KLF4 5’-TCTGAATTCTTAATGAGGC AGCCACCTGGCGA-3’
5’-TCTCCGCGGTGTGGGTCATG TCCACGATGTGG-3’
EMP1 5’-TCTGAATTCAAGATGTT GGTGCTACTGGCC-3’
5’-GTCCTGAGGAAGAAATAA GCTCGT-3’
CCR2 5’-CTCGAGTCTAATTTGGA GGCAGGATT-3’
5’-CTCGAGGAAATAGAGAA TGAGATGTTGATAGTATG-3’ CCR5 5’-GAGCTCTCAGAAGTGA
AGTATCTTGCCA-3’
5’-CTCGAGGGAACGGATGTC TCACCT-3’
CXCR3 5’-CCGTGAACAGAGGAA GTGAA-3’
5’-GTCCATCGGGAGAGAAGA-3’
4.4
Proliferation assay for T cells
T cells (5×10⁴ cells/well) were co-cultured with irradiated thymocytes (1.2×10⁶ cells/mL) in 100 μL RM per well together with antigens viz., MBP, 10 μg/mL or OVA (Sigma), 10
μg/mL or ConA (Pharmacia Biotech) 0.25μg/mL. 48 hrs later, radioactive thymidine [3H]dT (Amerscham Biosciences) (2 Ci/mmol) was added to the culture and radioactive
counts were measured after 16-24 hours using a β counter.
4.5
Cytofluorometry FACS
Surface staining
Cells were washed three times in PBS followed by incubation in PBS+3% Rat serum for blocking. Primary antibodies were added in 1:100 dilution in PBS+3% Rat serum for 60 mins on ice followed by three times washing in same buffer. Allophycocyanin-labelled goat anti-mouse was used as secondary antibody.
Intracellular staining
For intracellular staining, cells were fixed in 2% PFA for 10-15 mins then washed in PBS. Permeabilization was carried out using ice cold methanol added slowly to pre-chilled cells, while gently vortexing, to a final concentration of 90% methanol and incubated on ice for 30 mins. Cells were washed in incubation buffer and blocked for 10 mins in incubation buffer at room temperature. Primary antibodies at the appropriate dilutions were added and incubated at room temperature for 30-60 mins. After being washed three times in incubation buffer, secondary antibodies were added and incubated for 30 mins at room temperature before being washed in PBS.
4.6
Quantitative polymerase chain reaction
Biosystem where applicable. Custom designed primers and Taqman probes were ordered with FAM-TAMRA as fluorophore-quenchers respectively. The list of custom designed Taqman primer probes are listed in Table 4. 2.
Gene Forward Reverse FAM-Probe-TAMRA
β-actin 5´-TACAACCTCC TT GCAGCTCCT-3´ 5´-TTGTCGAGAC GAGCGC-3´ 5´-CGCCACCAGTTC GCATGGAT-3´ IFNγ 5´-AACAGTAAAG CAAAAAAGGATG CATT-3´ 5´-TTCATTGACAG CTTTGTGCTGG-3´ 5´-CGCCAAGTTCGAG GTGAACAACCC-3´
IL2 5´-CTCCCCATGA TGCTCACGTT-3´ 5´-TCATTTTCCAGG CACTGAAGATG-3´ 5´-CAATTCTGTGGC CTGCTTGGG CAA-3´ IL2R 5´-CACAGTCTGT GTACCAGGAGAA CCT-3´ 5´-CCACGAAGTG GTAGATTCTCTTG G-3´ 5´-CAGGTCACTGCAG GGAGCCCCC-3´
TNFα 5´-TCGAGTGACAA GCCCGTAGC-3´ 5´-CTCAGCCACTC CAGCTGCTC-3´ 5´-CGTCGTAGCAAAC CACCAAGCAGA-3´
IL4 5´-CGGTGAACTGA GGAAACTCTGTA GA-3´ 5´-TCAGTGTTGTG AGCGTGGACTC-3´ 5´-CGGTCTGAACTCAC TGAGAAGCTGCACC-3´ IL10 5´-GAAGACCCTC TGGATACAGCTG C-3´ 5´-TGCTCCACTGCC TTGCTTTT-3´ 5´-CGCTGTCATCGATT TCTCCCCTGTGA-3´
IL17 5´-AGTCCCCGG AGAATTCCA-3´
5´-GAGTACCGCTG CCTTCACTGT-3´
5´-ATGTGCCTGATGC TGTT-3´
CCR2 5´-CACTTAGAC CAGGCCATGCA-3´ 5´-TGACAGAGAC TCTTGGAATGACA CACTGCTG-3´ 5´-ACTTCTCACCAACA AAGGCATAAAT-3´ CCR5 5´-GTTCTCCTG TGGACCGGGTAT AG-3´ 5´-ATTGTCAAACG CTTCTGCAAAC-3´ 5´-AGCTTACACGATCA GGATTGACTTGC-3´
CXCR3 5´-AGCAGCCAAG CCATGTACCTT-3´ 5´-TAGGGAGATGT GCTGTTTTCCA-3´ 5´-AGGTCAGTGAACGT CAAGTGCTAGATGCCT C-3´
EMP1 5´-TCCTCTCGGG ATCCACCAT-3´
5´-TCTACACTCAC CACTACGCCCA-3´
5´-CTGGTGTGCTGGCT GTGCAT-3´
EMP2 5´-CGTCCTGACG GCCATCAT-3´
5´-GACGGAAGCCC CGATCA-3´
5´-CATGTCCTGTCTG TGTGTC-3´
EMP3 5´-GGCCTGCAGT AACGTCAGTGA-3´
5´-GGATGAGAGAC AGCACCATGAG-3´
5´-AACGGCTGGCTG AAG-3´
KLF4 5´-CAGTCGCAA GTCCCCTCTCT-3´
5´-TATCAAGAGC TCATGCCAC-3´
5´-CTCTTTGGCTTGG GCTCCT-3´
T-BET 5’-CCAACAATGTG ACCCAGATGAT-3’
5’-CTGGCTCACC GTCATTCA-3’
5’-TCCTGCAGTCCCTC CATAAGT ACCAGCC-3’ FOXP3 5’-TGGCAAACGG
AAGTCTCAA-3’
5’-TCTCATCCAGA GGTGATCTGCTT-3’
5’-AGCCGGGAGAGTT TCTCAAGCACTGC-3’ Table 4. 2 List of Taqman primers and probes used for qPCR.
4.7
EAE induction
AT-EAE in Lewis rats was induced by intraperitoneal (i.p.) or subcutaneous (s.c.) or intravenous (i.v.) injection of 3×10⁶ encephalitogenic T lymphocytes. The animals were monitored for weight loss and clinical symptoms. Clinical evaluation was performed by grading clinical scores as follows: 0.5, loss of tail tonus; 1, tail paralysis; 2, gait disturbance; 3, hind-limb paralysis; 4, tetraparesis; and 5, death.
4.8
Memory animal generation
In order to embed CD4+ TMBP-GFP and TMBP-EMP1 in the immune system of syngeneic
neonatal rats, 2.5×10⁶ cells in 0.5 mL/animal in EH medium were administered by i.p. injection into new-borns within 48 hrs after birth under hypothermia. After T cell transfer, the new born rats were kept under 30°C humid atmosphere until fully recovered and then returned to their mother. T cells were transferred 4-5 days after re-stimulation with antigen in vitro.
4.9
In vitro matrigel motility assay
Figure 4. 1 Diagrammatic representation of time lapse video microscopy setup for matrigel motility assay.
The setup consists of a small cylindrical polypropylene tube with an inner radius of 5 mm and height of 7 mm cut out and attached to the centre of 35mm culture dish using 1% agarose. The mixture of matrigel and T cells in a proportion of 1:1 (shown in orange) is then pipetted into the lumen of the cylindrical space and incubated in a closed system with controlled temperature and pH. After 30 mins of incubation, time lapse video microscopy is performed in intervals of 30 seconds over 30 minutes.
4.10 Microarray data analysis
TMBP-GFP cells were generated as described before in detail (49). Activated T cells (Tblast)
were obtained 2 days post re-stimulation in vitro using thymocytes and MBP antigen followed by FACS sorting. Resting T cells (Tresting) were obtained 7 days post antigen
exposure followed by FACS sorting. AT-EAE was induced as described before by injection of 5 million in vitro activated TMBP-GFP (44). FACS sorting of TMBP-GFP cells
from spleen (Tspleen) and TMBP-GFP cells from CNS (TCNS) was performed, 3.5 days post
AT-EAE induction. RNA was isolated and reverted into cDNA followed by cRNA synthesis for microarray analysis. Organs were pooled from several animals to obtain enough starting material. The pooled RNA was divided into three parts for three independent microarray hybridizations and measurements were performed by our collaborators at the Max Planck Institute of Molecular Genetics.
The microarray expression dataset consisted of normalized expression data from three measurements. The dataset essentially pertains to T cells from four different milieus viz, in vitro activated (Tblast), in vitro resting (Trest), ex vivo spleen (Tspleen) and ex vivo
spinal cord (TCNS). Comparison analysis was performed to define three T cell state such
Tblast). After generating a list of differentially expressed genes in Tactivated, Tmigratory and
Teffector, all transcripts without annotations were disregarded for further downstream
analysis. This resulted in an expression dataset consisting of only 17,694 probesets from a total of 31,256 probesets in the Affymetrix GeneChip® Rat Expression Set 230.
Average linkage hierarchial clustering was performed on the annotated expression dataset using GENESIS .shtml). Further, downstream analyses were carried out only on data pertaining to Tactivated
and Tmigratory. For GO based analysis affymetrix probesets were downloaded from GO
consortium database (http://www.geneontology.org/). For pathway based analysis, the GenMAPP (Gene Map Annotator and Pathway Profiler) program was used (http://www.genmapp.org/).
4.11 Dual luciferase assay
4.12 Bioinformatics
Extraction of promoter sequences
Chemokine receptor promoter sequences were downloaded using BioMart central portal as
follows:-Prediction of transcription factor binding site in target DNA sequences
Potential transcription factor binding sites in chemokine receptor promoter sequences CCR1, CCR2, CCR3, CCR4, CCR5 and CXCR3 were predicted using a web based tool called Matinspector™ from Genomatix which can be reached at the following website:-
Multiple sequence alignment of protein sequences
Evolutionarily conserved motifs in EMP1 was identified by a multiple sequence alignment (MSA) of EMP1 protein sequences from different mammalian species such as human, monkey, pig, cattle, rabbit, rat and mouse. PMP22/EMP/MP20 family motifs were illustrated by MSA of EMP1, EMP2, EMP3 and PMP22. The ClustalW2 program used for MSA is available online at the following portal:-
Prediction of transmembrane helices
EMP1 transmembrane helices were determined and illustrated using SOSUI server as reported which is available at the following web portal (51) :-
5.
Results
5.1
Microarray analysis of encephalitogenic T cells
EAE can be induced by adoptive transfer of freshly-activated TMBP cells. In contrast,
resting T cells are not pathogenic irrespectively of the number of injected cells. Intriguingly, the TMBP cell blasts do not immediately migrate into their target organ;
they rather follow predefined migration paths leading them from peripheral lymph nodes to the spleen and finally into the CNS. Moreover, there is a dramatic downregulation of activation marker and an upregulation of chemokine receptors in the periphery (44). Notably, TMBP cells extracted from the spleen 3.5 days post
transfer, readily infiltrate the CNS and induce disease as early as 24 hours post transfer (p.t.) (Streyl et al, PhD dissertation).
In order to investigate the gene expression changes in encephalitogenic T cells TMBP-GFP cells during the pre-clinical phase of AT-EAE, a genome-wide
transcriptional profiling of in vitro cultured TMBP-GFP cells (resting cells: Tresting and
freshly activated blast cells: Tblast) and ex vivo -isolated migratory TMBP-GFP cells (by
FACS from spleen (Tspleen) and CNS (TCNS) 3.5 days p.t.) (Figure 4. 1) was performed.
Microarray analysis was carried out using the affymetrix oligonucelotide microarray transcripts, including over 28,000 well substantiated rat genes. Microarray was performed by the automation group (Dr. Wilfried Nietfeld, Max Planck Institute of Molecular Genetics, Berlin) and data normalization was executed by the department of computational molecular biology (Prof. Dr. Martin Vingron, Max Planck Institute for Molecular Genetics, Berlin), the resultant expression values being presented as log to the base ‘e’. Thus we started with expression datasets comprising expression values pertaining to four different samples of encephalitogenic T cells termed Tblast, Tresting,
Tspleen and TCNS. Prior to data analysis three different T cell states or transcriptomes
were defined as follows.
1. Tactivated state: comparison of Tblast versus Tresting.
3. Teffector state: comparison of TCNS versus Tblast.
Activated T cell state (Tactivated state) represents the transcriptome of T cell blasts 48
hrs after re-stimulation in vitro whereas migratory T cell state represents the transcriptome of T cell 3.5 days post adoptive transfer in peripheral lymphoid organ, spleen. Effector T cell state on the other hand represents the transcriptome of reactivated TMBP cells within the target organ, CNS.
5.2
Cluster analysis of the microarray expression data
Cluster analysis is the most popular and commonly used method for gene expression analysis. One of the primary goals of clustering is to group together objects such as genes or transcriptomes with similar expression pattern. When genes with similar expression profiles are grouped together they are believed to be co-regulated and functionally related.
Tspleen vs Tblast TCNS vs Tblast Tblast vs Tresting
Number of upregulated
( ≥ 2 fold) transcripts 587 514 919 Number of downregulated
( ≤ 0.5 fold) transcripts 1027 1149 1791
Total number of differentially
regulated transcripts 1614 1663 2710 Total number of transcripts 30200 30200 30200
Table 5. 1 A summary of differentially regulated transcripts from microarray dataset.
A summary of the number of differentially regulated transcripts is given in Table 5. 1. A cut off of ≥ 2 fold was chosen for upregulation and ≤ 0.5 fold for downregulation. A comparison between Tspleen and Tblast state resulted in 1614 differentially regulated
transcripts. The number of regulated transcripts in Tblast cells (i.e., after activation with
specific antigen) compared to Tresting cells was 2710 transcripts. This indicates that
Tblast cells upon migration to spleen experience a dramatic reorganization of their
Average linkage cluster analysis revealed surprisingly diverse gene expression patterns. Importantly, out of 30248 transcripts only a fraction (~6%) of them showed a differential regulation (Table 5. 1). Moreover, the regulation of genes in Tmigratory and
Teffector states is very similar, as can been seen from the heat map illustration of cluster
analysis (Figure 5. 3), implying a similar transcriptome between Tspleen and TCNS. In
vitro activated T cells undergo transcriptomic changes that imparts them migratory phenotype facilitating CNS infiltration. Two interesting clustering pattern could be observed from the analysis, namely (i) downregulated in Tactivated and upregulated in
Tmigratory and Teffector and (ii) upregualted in Tactivated and downregulated in Tmigratory and
Teffector. Several clustered genes are labelled and depicted in Figure 5. 4. One of the
prominent features evident from the cluster analysis is the reciprocal regulation of the same genes in Tactivated and Tmigratory. Genes that are upregulated in Tactivated state were
downregulated in Tmigratory state and vice versa (Figure 5. 2, Figure 5. 3 and
Figure 5. 4).
As expected, major differences between Tblast cells and Tresting cells included
genes responsible for strong immune activation and proliferation, i.e. genes encoding cytokines for e.g. interleukin 17f (IL17F), CC-ligand 2 (CCL2); cell cycle-associated genes, for e.g. cell division cycle 20 homolog (CDC20), cyclin E1 (CCNE1), cytoskeleton associated protein 5 (CKAP5); factors of the DNA replication machinery, for e.g. deoxyuridine triphosphatase (DUT), minichromosome maintenance complex component 7 (MCM7), replication factor C 3 (RFC3); DNA polymerases, for e.g. minichromosome maintenance complex component 4 (MCM4), minichromosome maintenance complex component (MCM6) and cell metabolism, for e.g. 3-hydroxy-3-methylglutaryl-Coenzyme A reductase (HMGCR), cytochrome P450, family 51 (CYP51), phosphomevalonate kinase (PMVK) (Appendix 1). In striking contrast Tmigratory state displayed a completely distinct genotype. The genes regulated in Tspleen
integrin β1 (ITGβ1), integrin β7 (ITGβ7), (CCR5), vinculin (VCL), and immune response for e.g. CXC-chemokine ligand 2 (CXCL2), GLI pathogenesis-related 1 (GLIPR1), immunoglobulin superfamily, member 6 (IGSF6) (Appendix 2). Overall cluster analysis revealed a strong association of cell cycle genes in a Tactivated state and
Figure 5. 1 Schematic illustration of green fluorescent TMBP-GFP cell sorting using
FACS from different milieus and subsequent microarray analysis.
TMBP-GFP were generated as described in detail previously (49). Activated T cells (Tblast) were
obtained 2 days post re-stimulation in vitro using thymocytes and MBP antigen, followed by FACS sorting. Resting T cells (Tresting) were obtained 7 days post antigen exposure followed
by FACS sorting. AT-EAE was induced as described before by injection of 5 million of in vitro activated TMBP-GFP (44). FACS sorting of TMBP-GFP cells from spleen (Tspleen) and TMBP-GFP
cells from CNS (TCNS) was performed, 3.5 days post AT-EAE induction. RNA was isolated
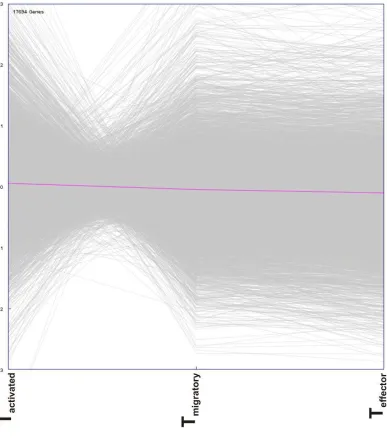
Figure 5. 2 Microarray dataset viewed as expression plot.
Annotated genes (17694 genes) from the microarray dataset were plotted with fold values on ordinate and TMBP-GFP cell states on abscissa. An imaginary line drawn in magenta indicates
zero fold value. The transcriptomes of three T cell states viz, Tactivated, Tmigratory and Teffector were
investigated. Tactivated transcriptome was represented as gene expression fold change values,
obtained by dividing gene expression values of Tblast by Tresting. Tmigratory transcriptome was
represented as gene expression fold change values, obtained by dividing gene expression values of Tspleen by Tblast whereas Teffector transcriptome was represented as gene expression fold
change values, obtained by dividing gene expression values of TCNS by Tblast. Genes that were
Figure 5. 3 Heat Map representation of cluster analysis of annotated genes.
Average linkage hierarchical clustering of annotated genes is depicted as a heat map with dendrogram. Three T cell states viz., Tactivated, Tmigratory and Teffector were investigated. Tactivated
transcriptome was represented as gene expression fold change values, obtained by dividing gene expression values of Tblast by Tresting. Tmigratory transcriptome was represented as gene
expression fold change values, obtained by dividing gene expression values of Tspleen by Tblast
whereas Teffector transcriptome was represented as gene expression fold change values,
obtained by dividing gene expression values of TCNS by Tblast. Scale for colour code is shown
Figure 5. 4 Depiction of clusters A-F.
Figure 5. 5 Pie chart analysis of clusters A to F.
Figure 5. 6 Cell cycle genes and chemokine receptors are clustered.
A part of cluster E depicts clustering of differentially regulated cell cycle genes in Tactivated,
Tmigratory and Teffector transcriptomes. A part of cluster D depicting clustering of differentially
regulated inflammatory chemokine receptors in Tactivated, Tmigratory and Teffector transcriptomes.
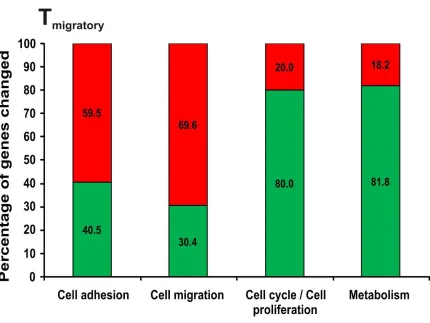
Figure 5. 7 Differential regulation of cell migration and cell cycle processes.
This graph depicts the percentage of annotated genes differentially regulated in four biological processes, viz. cell adhesion, cell migration, cell cycle and metabolism in the Tmigratory state
5.3
Gene Ontology based analysis of microarray expression data
GO consortium classifies genes into molecular functions, biological processes and cellular components which is particularly useful for getting an overview of quantitative changes pertaining to each category.
All genes that were differentially regulated were chosen for GO analysis. The clustered genes were assigned the GO annotation and subsequently were plotted in pie charts. In clusters B to F, a major proportion of regulated genes did not belong to any of the biological processes such as apoptosis, signal transduction, cell growth, immune response, metabolism and transport (Figure 5. 5).
Most of the upregulated genes in a Tmigratory, state in GO, belonged either to the
plasma membrane (28%) or the gene ontology group of secreted proteins (10%) which was in contrast to Tactivated cell transcriptome where nuclear (38%) and cytoplasmic
(30%) proteins predominated (Table 5. 3). Membrane factors upregulated in a Tactivated
state were involved in auxiliary transport activity for e.g. (solute carrier family 7, member 1, SLC7A1), solute carrier family 16, member 1, SLC16A1, transferrin receptor ,TFRC) (31%), GTPase activity (guanine nucleotide binding protein alpha inhibiting activity polypeptide 1, GNAI, member RAS oncogene family RAB34, RAB34) (12%) or protein binding (phospholipid scramblase 1, PLSCR1) (6%) (Table 5. 2) (Appendix 1). In a Tmigratory state this group of regulated genes rather belonged to
membrane receptor activity (CD44, ITGβ1, killer cell lectin-like receptor subfamily D, member 1, KLRD1, tumour necrosis factor receptor superfamily, member 1B, TNFRSF1B) (35%), calcium ion binding activity (pleckstrin, PLEK, S100 calcium binding protein A4, S100A4, S100 calcium binding protein A9, S100A9) (13%) or fell into the category of undefined molecular functions (GLIPR1, synaptotagmin-like 1, SYTL1) (11%) (Appendix 2). Clearly, membrane molecules in a Tmigratory state are
involved in cell migration machinery.
Biological processes such as cell adhesion, cell migration, cell communication, immune response and signal transduction were the prominently upregulated processes in a Tmigratory state whereas processes such as metabolism and cell cycle/proliferation
Cell adhesion molecules such as CD44, ITGβ1 and SELL play a crucial role in T lymphocyte adhesion on the luminal side of blood vessels and were all upregulated in Tspleen compared to Tblast. In particular, studies involving blocking anti-bodies revealed
that both CD44 and ITGβ1 contribute to clinical disease in EAE by inhibiting leukocyte extravasation to the CNS (53). In Tspleen compared to Tblast in addition to
well-known cell adhesion genes, several novel cell adhesion genes were also upregulated, namely, EMP1, CD97 antigen (CD97), and NRP1 (Table 5. 1) (Appendix 2). The majority of cell adhesion genes were downregulated in the Tactivated state (69%
downregulated; 31% upregulated) whereas in the Tmigratory state 55% of cell adhesion
genes that underwent change were upregulated (Table 5. 4, Table 5. 5).
GO biological process that underwent significant change in both Tactivated and
Tmigratory states were similar such as cell metabolism (Tactivated; 348 genes, Tmigratory; 297
genes), cell communication (Tactivated; 145 genes, Tmigratory; 159 genes), biological
processes unknown (Tactivated; 56 genes, Tmigratory; 47 genes) and transport (Tactivated; 53
genes, Tmigratory; 46 genes). However, the number of cell migration genes that
underwent changes in the Tmigratory state was higher than that of the Tactivated state
(Tactivated; 10 genes, Tmigratory; 23 genes) and most of them were upregulated in the
Tmigratory state, implying an apparent migratory genotype acquired by Tspleen 3.5 days
GO: Molecular Class Numbers of genes changed
Upregulated in Tactivated state
Downregulated in Tactivated state
Centrosome 12 11 1
Cytoplasm 182 114 68
Cytoskeleton 1 0 1
Endoplasmic
Reticulum 26 13 13
Extracellular 20 10 10
Golgi apparatus 18 2 16
Kinetochore 1 1 0
Lysosome 10 2 8
Microtubule 3 2 1
Mitochondrion 3 2 1
Nucleus 217 144 73
Perinuclear region 1 0 1
Peroxisome 7 5 2
Plasma membrane 103 28 75
Ribosome 3 3 0
Table 5. 2 GO: Molecular Class based annotations of differentially regulated transcripts in Tactivated transcriptome.
GO: Molecular Class Numbers of genes changed
Upregulated in Tmigratory state
Downregulated in Tmigratory state
Centrosome 7 1 6
Cytoplasm 84 53 31
Cytoskeleton 1 1 0
Endoplasmic
Reticulum 25 7 18
Extracellular 36 20 16
Golgi apparatus 11 8 3
Intermediate filament 1 1 0
Lysosome 5 3 2
Microsome 3 1 2
Mitochondrion 56 4 52
Nucleus 207 49 158
Perinuclear region 1 1 0
Peroxisome 5 0 5
Plasma membrane 87 59 28
Ribosome 2 0 2
GO: Biological Process
Numbers of genes changed
Upregulated in Tactivated state
Downregulated in Tactivated state
Apoptosis 11 2 0
Process unknown 56 33 23
Cell adhesion 29 9 20
Cell migration 10 4 6
Cell
communication
145 56 89
Cell cycle 15 14 1
Cell growth 33 17 16
DNA repair 3 3 0
DNA replication 3 3 0
Energy pathways 1 0 1
Immune response 20 6 14
Metabolism 348 244 104
Protein folding 4 3 1
Signal transduction 13 2 11
Transport 53 28 25
Table 5. 4 GO: Biological Process based annotation of differentially regulated transcripts in Tactivated transcriptome.
GO: Biological Process
Number of genes changed
Upregulated in Tmigratory state
Downregulated in Tmigratory state
Apoptosis 9 5 4
Process unknown 47 15 32
Cell adhesion 37 22 15
Cell migration 23 16 7
Cell
communication
159 91 68
Cell cycle 15 3 12
Cell growth 43 19 24
DNA repair 3 0 3
DNA replication 3 0 3
Energy pathways 1 1 0
Immune response 25 20 5
Metabolism 297 54 243
Protein folding 3 0 3
Signal transduction 11 9 2
Transport 46 13 33
5.4
Pathway based analysis of microarray data
To determine signalling pathways implicated in T cell migration, GenMAPP was used for pathway-based analysis of the expression dataset of Tblast, Tresting and Tspleen cells.
The pathways that underwent major changes in activated Tblast cells compared to
Tresting cells (Tactivated) were the cholesterol biosynthetic (Figure 5. 8) and cell cycle
pathways (Figure 5. 10). Antigen-specific T cell activation resulted in cell cycle progression by upregulation of the CDC2 kinase which associates with cyclin A (CCNA1) and cyclin B (CCNB). Cyclins required for G1 to S phase transition such as cyclin E1 (CCNE1) and cyclin E2 (CCNE2) and cyclins important for G2 phase to M phase transition such as CCNA2, cyclin B1 (CCNB1) cyclin B2 (CCNB2) and cyclin F (CCNF) were all upregulated. Furthermore, v-myc myelocytomatosis viral oncogene homolog (MYC), a transcription factor driving the synthesis of DNA replication genes was upregulated and at the same time several transcription factors such as krüppel-like factor 2 (KLF2), krüppel-like factor 4 (KLF4), krüppel-like factor 9 (KLF9), B-cell translocation gene 1 (BTG1), and B-cell translocation gene 2 (BTG2) that inhibit the cell cycle progression were downregulated. Of the many signalling pathways involved in the activated phenotype of T cells, the prominent ones were cell division and cell metabolism. In the Tactivated state, one of the metabolic pathways, the cholesterol
biosynthetic pathway, was significantly upregulated (Figure 5. 8). Strikingly, 81% of all the genes involved in cholesterol biosynthesis were upregulated. Thirteen genes out of a total sixteen genes implicated in the cholesterol pathway were upregulated.
At the same time, these pathway specific changes were dramatically opposite in the Tmigratory state. Both the cell cycle pathway and the cholesterol biosynthetic
pathway were downregulated in Tspleen cells compared with Tblast cells (Figure 5. 9,
Figure 5. 8 Cholesterol biosynthetic pathway is upregulated in Tactivated
transcriptome.
Overlay of Tactivated transcriptome dataset on cholesterol biosynthetic pathway using
GenMAPP. Fold values of Tblast with respect to Tresting (Tactivated) is indicated on the right hand
Figure 5. 9 Cholesterol biosynthetic pathway is downregulated in Tmigratory
transcriptome.
Overlay of Tmigratory transcriptome dataset on cholesterol biosynthetic pathway using
GenMAPP.Fold values of Tspleen with respect to Tblast (Tmigratory) is indicated on the right hand
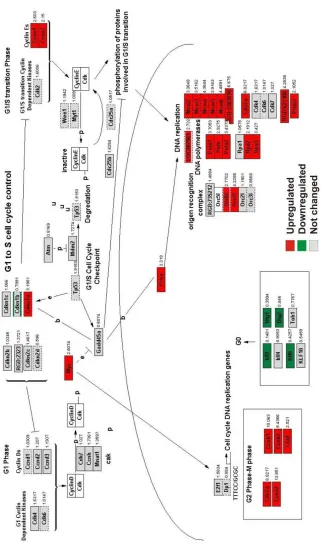
Figure 5. 10 Cell cycle pathway is upregulated in Tactivated transcriptome.
Overlay of Tactivated transcriptome dataset on cell cycle pathway using GenMAPP. Fold values
of Tblast with respect to Tresting (Tactivated) are indicated on the right hand side of the gene. Red
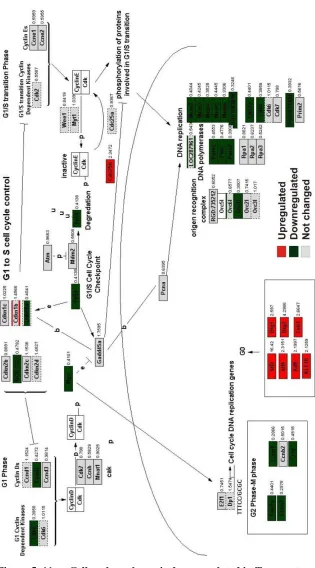
Figure 5. 11 Cell cycle pathway is downregulated in Tmigratory transcriptome.
Overlay of Tmigratory transcriptome dataset on cell cycle pathway using GenMAPP. Fold values
of Tspleen with respect to Tresting (Tmigratory) are indicated on the right hand side of the gene. Red
qPCR Microarray
GENE Tmigratory Teffector Tmigratory Teffector
Btg1 2.34 1.70 2.60 2.00
Btg2 1.88 1.12 4.30 3.50
Egr1 0.72 7.59 1.79 2.72
Egr2 2.70 45.42 1.61 2.46
Egr3 1.28 11.99 1.69 3.10
Klf4 6.54 20.18 2.32 1.71
Tob1 5.00 13.17 2.66 1.72
Table 5. 6 qPCR and microarray data indicating up regulation of quiescence factors.
This table shows quantitative PCR fold values and microarray fold values for ex-vivo sorted TMBP-GFP cells from spleen and CNS compared with in vitro activated T cell blasts. Values are
from an average of three independent measurements.
However, cell quiescence inducing transcription factors such as KLF2, KLF4, KLF9, krüppel-like factor 10 (KLF10), BTG1 and BTG2 crucial for inhibiting cell cycle progression were all upregulated in both the Tmigratory state and the Teffector states This
was confirmed by quantitative PCR analyses (Table 5. 6).
A cell migration signalling pathway was generated with the GenMapp program (Figure 5. 11). In this pathway almost all the genes important for the migratory signalling pathway were upregulated in the Tmigratory state. Genes related to IL2R
integrin dependent manner to promote cell spreading and migration. Moreover, FHL2 has been reported to inhibit cell proliferation by directly inhibiting mitogen-activated protein kinase 2 (ERK2) (54).
In addition, ZYX, a regulator of actin filament assembly, inhibits mitotic progression by interacting with large tumour suppressor, homolog 1 (LATS1) tumour suppressor (55). Many molecular mediators of cell migration apparently seem to play a role in inhibiting signals for cell proliferation. The well-studied cell cycle progression inhibitor KLF2, expressed in naïve T cells, was recently reported to be involved in controlling cell migration in naïve T cells by directly regulating thymic egress receptor sphingosine-1-phosphate receptor 1 (S1P1) and lymph node homing receptors, SELL and CC-chemokine receptor (CCR7) (56). KLF4, a zinc finger containing transcription factor that inhibits cell proliferation by inhibiting G1/S progression of cell cycle, was upregulated more than 2 fold in Tspleen compared to
Tblast. Moreover, KLF4 expression in TMBP-GFP cells in different milieus such as spleen,
blood and CNS coincide with cell cycle progression as measured by propidium iodide staining, providing functional evidence of cell cycle inhibition in Tmigratory and Teffector
state (Figure 5. 13, Figure 5. 15).
These transcriptome analyses reveal a surprisingly reciprocal relationship between cell division and cell migration pathways between the Tactivation and Tmigratory
Figure 5. 12 Cell migration pathway is upregulated in Tmigratory transcriptome.
Overlay of Tmigratory transcriptome dataset on cell migration pathway generated using
GenMAPP. Fold values of Tspleen with respect to Tresting (Tmigratory) are indicated on the right
hand side of the gene. Red colour = upregulated; Green colour = downregulated; Grey colour = not changed and No colour = gene not present in microarray.
Figure 5. 13 Intracellular propidium iodide staining of DNA for cell cycle analysis by flow cytometry.
In vitro activated Tblast cells, and spleen homogenate cells, gradient purified blood leukocytes