Clinical Ophthalmology
Dove
press
O r i g i n a l r e s e a r C h
open access to scientific and medical research
Open access Full Text article
applanation tonometry: a comparison
of the Perkins handheld and goldmann slit
lamp-mounted methods
r arora1
h Bellamy2
MW austin2
1University hospital of southampton,
southampton, hampshire, 2singleton
hospital, abertawe Bro Morgannwg University health Board, swansea, Wales, UK
Correspondence: MW austin Department of Ophthalmology, singleton hospital, sketty lane, swansea, sa2 8Qa, Wales, UK Tel +44 1792 285036 Fax +44 1792 285839
email [email protected]
Purpose: To compare intraocular pressure (IOP) measurements, taken using Perkins applanation tonometry (PAT) and Goldmann applanation tonometry (GAT).
Methods: 100 eyes of 100 patients underwent Perkins and Goldmann applanation tonometry, with a randomized order of modality, performed by a masked observer. The right eye was measured, for all subjects, and the data used in statistical analysis. The comparability of results given by the two instruments was evaluated using the Bland–Altman method.
Results: IOP measurements for 100 eyes were obtained (range: 10–44 mmHg). The mean GAT reading was 21.63 mmHg, with standard deviation (SD) 5.69 mmHg. The mean PAT reading was 21.40 mmHg, with SD 5.67 mmHg. The mean difference between readings from Goldmann versus Perkins tonometry was 0.22 mmHg (SD: 0.44 mmHg). The limits of agreement were calculated to be −0.64–+1.08 mmHg (1.96 SD either side of the bias).
Conclusion: The Perkins applanation tonometer yields IOP measurements that are closely comparable with GAT. Therefore, PAT may be used in routine clinical practice, as part of the implementation of national guidelines, or preferred practice patterns, for glaucoma and ocular hypertension.
Keywords: glaucoma, intraocular pressure, ocular tonometry, Perkins applanation tonometry, Goldmann applanation tonometry
Introduction
Intraocular pressure (IOP) measurement is an integral part of any comprehensive ophthalmic examination, and is especially important for individuals who are at risk with respect to glaucoma and ocular hypertension, as IOP is the most important risk factor for development of glaucomatous optic neuropathy, and is the best evidenced target for management.1–6 Slit lamp-mounted Goldmann applanation tonometry (GAT)
is regarded as the optimum modality for the measurement of IOP;7 as such, it is
recom-mended as part of the UK National Institute for Health and Clinical Excellence (NICE) guidelines for chronic open angle glaucoma and ocular hypertension.8 However, these
guidelines do not similarly endorse Perkins handheld applanation tonometry (PAT),9
and state: “Hand-held methods of tonometry such as Perkins may be useful in a case finding/screening scenario where a person may have difficulty being examined on a slit lamp (for example with curvature of the spine). However there is no evidence to suggest that these methods are equivalent to slit lamp mounted GAT.”8 This is due to a
lack of comparable published evidence in Europeans, using what would be considered appropriate statistical methods (for modern standards). As PAT is in widespread use in primary care optometric practice (the source of the majority of glaucoma referrals
Clinical Ophthalmology downloaded from https://www.dovepress.com/ by 118.70.13.36 on 21-Aug-2020
For personal use only.
Number of times this article has been viewed
This article was published in the following Dove Press journal: Clinical Ophthalmology
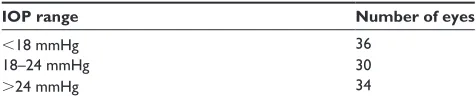
Table 1 numbers of eyes having iOP within each sub-range of isO draft standard on tonometers
IOP range Number of eyes
,18 mmhg 36
18–24 mmhg 30
.24 mmhg 34
Abbreviations: iOP, intraocular pressure; isO, international Organization for standardization.
Dovepress
arora et al
to the Hospital Eye Service in the UK), it is timely to assess comparability of the two methods. Therefore, the purpose of our study was to compare PAT with GAT across a wide range of IOP, and to present and analyze the results, applying suitable statistical techniques.
Patients and methods
One hundred subjects were enrolled into the study, by invita-tion, during their attendance at routine HES clinics, at which they were due to undergo IOP measurement. Adult subjects with capacity were chosen, for ease of explanation and the gaining of informed consent. The subjects were generally fit, with mild systemic disease (typical of American Society of Anaesthesiologists grade 2; they were attending the hospital for ambulatory day case cataract surgery). None was morbidly obese. The ability to tolerate corneal applanation under topical anaesthesia was included, for the sake of completeness. During the study, no potential patient failed this inclusion criterion. The International Standardization Organization (ISO) draft standard for tonometers subdivides IOP measurements into four defined ranges, to better describe and confirm fitness for purpose of tonometers, at all levels of IOP likely to be met in clinical situations. Therefore, we recruited subjects into groups, according to these IOP ranges, as shown in Table 1.
We chose to exclude patients with significant corneal astigmatism (.3 D), so as to eliminate the requirement for alteration of the orientation of the tonometer prism from the convention of the horizontal meridian.10 Refractive cylinder
has been used as a surrogate for corneal astigmatism. Astig-matism of 3D cylinder would be associated with a potential for “error” of 1–2 mmHg,10 thus, it may be taken as a limit
of the same order of magnitude as the level of accuracy used in recording measurements of IOP.
Other exclusion criteria were related to physical dif-ficulty in performing applanation (infirmity preventing suitable positioning at a slit lamp, or inability to cooperate with eye opening), pathology of the cornea that could affect biomechanics and, thus, the size and appearance of the tear meniscus semicircles, like keratoconus, corneal scarring, previous corneal surgery, corneal infection, microphthalmos,
buphthalmos, nystagmus, and blepharospasm. Ocular patho-logic changes, other than glaucoma, mild nuclear sclerosis, and rare drusen, were also excluded.
Consecutive patients were considered against the inclu-sion and excluinclu-sion criteria until sufficient subjects had been allocated to each of the following intraocular pressure range groups: ,18 mmHg, 18–24 mmHg, and $24 mmHg, in accordance with the ISO guidelines for ocular tonometry.11
The local research ethics committee was consulted regarding our study design, and confirmation was given that formal ethics approval was not required. As the patients were having GAT as part of their general ophthalmic assessment; the taking of additional IOP measurements by PAT was not considered as requiring formal institutional ethics review. Nevertheless, we are able to certify that all applicable insti-tutional regulations concerning the ethical use of human volunteers were followed during this study, consistent with the tenets of the Declaration of Helsinki. Informed patient consent was gained for the additional IOP readings.
The same Goldmann tonometer (Haag-Streit, Koeniz, Switzerland) and Perkins Mk2 tonometer (Haag-Streit) were used for all IOP measurements. The calibration of each instru-ment was checked at the beginning of each session, according to the manufacturers’ instructions.12 The patients were
random-ized into two groups: Group A (where GAT was used first, followed by PAT) and Group B (where PAT was used first, then GAT). A standard technique for IOP measurement was followed. Topical anesthesia was applied (proxymetacaine with fluorescein) (Bausch + Lomb Pharmaceuticals, Tampa, FL, USA), and the eyes were dabbed, to remove excess fluid from the ocular surface. Applanation was performed by the same masked investigator. Prior to each applanation, the tonometer was set to an IOP value of 10 mmHg. Then, the knob was turned until the applanation visual endpoint was reached. IOP values were recorded by a second observer (a member of the nursing or technical staff, who had received specific training in applanation methods), who then reset the tonometer knob, unobserved by the applanator.
All measurements were taken with the patient in a sitting position. For GAT, the face was in a vertical plane. For PAT, the head was inclined slightly backward, through a degree of neck extension, typically in the order of 30 degrees.
Reusable tonometer prisms were used. These were cleaned and disinfected between uses, in accordance with the manufacturer’s recommendations.
IOP may vary significantly, as a consequence of pulsatile ocular blood flow during the cardiac cycle. Therefore, during applanation, the tear meniscus semicircles may appear to
Clinical Ophthalmology downloaded from https://www.dovepress.com/ by 118.70.13.36 on 21-Aug-2020
Dovepress applanation tonometry: Perkins versus goldmann
change size to such an extent as to make it difficult to choose a value for the IOP reading. To eliminate this potential for variation not arising from any systemic bias associated with the tonometer type, we elected to include only those eyes with an IOP pulse variation of #2 mmHg (one graduated interval on the tonometer measuring wheel).
IOP in the right eye was measured first, for all subjects, and these values were used in statistical analysis. A set of three measurements for each applanation technique was obtained, for each study eye, so that a mean value could be used in the analysis of results. All of the measurements for each patient were taken within a single period of examination, and were completed within 15 minutes. A Bland–Altman plot13 was constructed, to show the differences between
IOP-G and IOP-P, against their means, for each pair of values. The mean of the differences between pairs of values was calculated (ie, the bias), as also were the limits of agree-ment, defined as the bias ±1.96 times the standard deviation (SD) of the differences between pairs of values.
Results
From 141 consecutive potential subjects, 100 satisfied the inclusion and exclusion criteria; 31 subjects were excluded for inter-reading variation of .2 mmHg, and 10 subjects were excluded for frequent blinking.
Thus, 100 eyes of 100 subjects were included. IOP values (GAT taken as giving the definitive value) for each eye ranged between 10–44 mmHg, with an even distribution (minimum of 20 eyes). The numbers of eyes having IOP values within the three specified ranges are shown in Table 1.
A possible source of overstatement of agreement might have come from our resetting the tonometer to a value of 10 mmHg, rather than to a random level, between applanations. However, we feel that this is not likely to have been of clinical significance – it was of less importance than the simplicity of the method we chose, given the use of non-clinical assistants for resetting.
Only one eye of each subject was included for analysis. As a standard, we used the first eye to be tested, which was the right eye for each subject. The mean of the GAT readings was 21.63 mmHg, with SD of 5.69 mm Hg. The mean of the PAT readings was 21.40 mmHg, with SD of 5.67 mmHg. The mean difference between readings, by Goldmann or Perkins tonometry, was 0.22 mmHg (SD: 0.44 mmHg).
In the ,18 mmHg IOP group, the mean difference was 0.27 mmHg; in the 18–24 mmHg group, the mean difference was 0.08 mmHg; and in the .24 mmHg group, the mean difference was 0.28 mmHg.
The patients were randomized into two groups: Group A (where GAT was used first, followed by PAT) and Group B (where PAT was used first, then GAT). In Group A, the mean Goldmann reading was 21.58 mmHg (SD: 5.71 mmHg), and the mean Perkins reading was 21.77 mmHg (SD: 5.95 mmHg). In Group B (where PAT was used first), the mean Goldmann reading was 21.35 mmHg (SD: 5.72 mmHg), and the mean Perkins reading was 21.49 mmHg (SD: 5.92 mmHg). The mean difference between readings in Group A was 0.21 mmHg (SD: 0.29 mmHg), and in Group B, was 0.32 mmHg (SD: 0.35 mmHg).
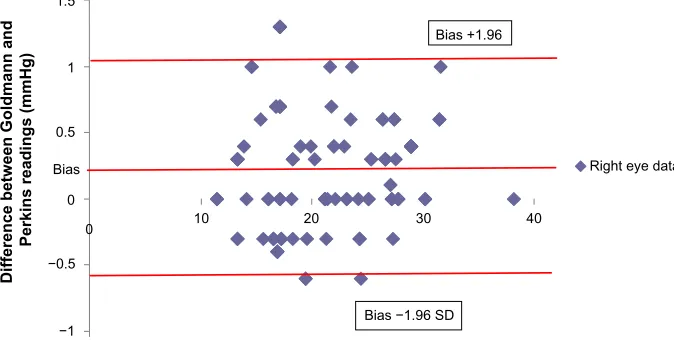
The data were entered into a Microsoft Excel 2009 spreadsheet (Microsoft Corp, Redmond, WA, USA), and Bland–Altman graphs were generated, according to the authors’ formula, as shown on the chart.
The Bland–Altman plot (Figure 1) shows the difference between pairs of (averaged) values for GAT and PAT, plot-ted against their mean. The mean difference (bias) between Goldmann and Perkins IOP readings was 0.22 mmHg (SD: 0.44 mmHg). The limits of agreement were calculated as −0.64 to +1.08 mmHg (1.96 SD either side of the bias).
A clear correlation between GAT and PAT was found (r=0.85; P,0.001).
Discussion
Precision in the measurement of IOP is a prerequisite for any glaucoma care pathway. The “landmark” glau-coma studies have emphasized the importance of IOP in clinical decision making and management.2–6 GAT is
still the method most commonly used by the majority of ophthalmologists. This is because it has proved to be accurate, precise, easy to incorporate into routine slit lamp eye examination, and shows low intra- and interobserver variability.14 Corneal factors, like astigmatism, corneal
curvature, and central corneal thickness, affect the accu-racy of applanation tonometers. Studies have shown that there was a positive correlation between corneal curvature and tonometer readings. For each 3-D increase in corneal power in this sample, the average IOP increased 1 mmHg.10
The thickness of the cornea also affects most noninvasive methods, by varying resistance to the tonometer probe. A thick cornea gives rise to a greater probability of an IOP being overestimated, and a thin cornea can lead to IOP being underestimated.15–17
Given that there is a degree of variability in the values obtained for each eye, by each method in our study, we rec-ommend the practice of using more than one IOP value in a patient’s clinical record (eg, two or three).
Clinical Ophthalmology downloaded from https://www.dovepress.com/ by 118.70.13.36 on 21-Aug-2020
−1 −0.5 0 0.5 1 1.5
0 10 30 40
Right eye data Bias +1.96
Bias
Mean of Goldmann and Perkins (mmHg)
Difference between Goldmann and
Perkins readings (mmHg)
Bias −1.96 SD 20
Figure 1 Bland–altman plot of the difference between iOP-g and iOP-P, versus the mean of each pair of values: (iOP-g + iOP-P)/2.
Note: anaverage of three readings per eye were made using each method.
Abbreviations: sD,standard deviation; iOP, intraocular pressure.
Dovepress
arora et al
The Perkins tonometer was devised as a portable hand-held applanation tonometer, for use in children, patients unable to cooperate for slit lamp examination, and anesthe-tized and bedridden patients. PAT is currently in widespread use in the primary care setting. One reason may be historical, from a time when optometrists did not routinely use slit lamp microscopes, relying on handheld direct ophthalmoscopy for ocular examinations.
The accuracy and compatibility of PAT in animals is sup-ported by several studies.18–23 Andrade et al reported a strong
correlation between the IOP values obtained by direct ocular manometry and PAT in horses and cattle.20 However, limited
data in humans is available. Having the same physical prin-ciples and similar basic instrument construction, PAT should be comparable with GAT. Previous comparison reports24–31
have either used small numbers of subjects (thus, providing relatively weak evidence) or used only correlation coefficients in their statistical analyses. Such an approach does not infer or confirm comparability, nor provide sufficient evidence to allow for interchangeability between techniques. Therefore, there is a need for a more robust evidence base for using PAT in routine human ophthalmic practice. The Bland–Altman Plot13 has become the universally-adopted statistical method
technique for comparison of measurement methods. Limits of agreement are defined as two standard deviations either side of the mean difference between values given by each method.
Ours is a simple study to answer a simple question, addressing a small but significant gap in the tonometry
literature, namely: “Is Perkins an acceptable alternative to Goldmann?” Our results show a suitably compact grouping of difference values, not just within the defined Bland–Altman limits of agreement, but also well within the tolerance limits given in the ISO standard for a tonometer.11 Our report shows
that the Perkins applanation tonometer measures IOP to a much closer level of comparability than other tonometer types.32–34 This is to be expected, given the physical
proper-ties of the applanating prisms, visual endpoints, and internal workings of the instruments. Our low value of 1.5 mmHg, for the spread of 95% of difference values between the tech-niques, could arise (in part) both as a result of our use of the mean of three IOP readings for each tonometer, for each eye (suggesting limited usefulness for common clinical practice), and due to our exclusion of any eye with a wide amplitude of pulse-induced intraocular pulse variation (.2 mmHg) (Table 1). We consider the former cause unlikely, as similar results were achieved when using just one IOP value per eye, and the latter issue of limited relevance, considering the demonstrable lack of any systematic bias in the tonometric modalities.
Perkins handheld tonometry would appear to be com-parable with the “gold standard” of slit lamp-mounted Goldmann applanation tonometry, for eyes satisfying the inclusion and exclusion criteria. Therefore, we consider it to be acceptable for routine clinical practice, not merely to be considered as a “second best”, for when slit lamp-mounted GAT is not possible. We would suggest that PAT may be permissible for IOP measurement, as part of care pathways
Clinical Ophthalmology downloaded from https://www.dovepress.com/ by 118.70.13.36 on 21-Aug-2020
Dovepress applanation tonometry: Perkins versus goldmann
for open angle glaucoma and ocular hypertension. In the UK, this should include modification of the 2009 NICE guidelines. But corroborative evidence from others would be required to confirm this.
Summary
What was known before?
• Goldmann applanation tonometry (slit lamp-mounted) is the accepted “gold standard” method for IOP measurement.
• Perkins applanation tonometry (handheld) is in wide-spread use, particularly in the primary care setting, but evidence of comparability with Goldmann applanation tonometry is not substantial.
What this study adds
• Measurements of IOP by Perkins applanation tonometry are sufficiently comparable with Goldmann tonometry to be acceptable for routine clinical practice.
Acknowledgment
The authors are grateful to the staff of the Ophthalmology Outpatient and Cataract Preassessment Clinics of Singleton Hospital, for their assistance in the taking of IOP measure-ments and ensuring patient wellbeing.
Disclosure
The authors declare they have no conflict of interest in this work.
References
1. Medeiros FA, Brandt J, Liu J, Sehi M, Weinreb RN, Susanna R. IOP as a risk factor for glaucoma development and progression. In: Weinreb RN, Brandt JD, Garway-Heath DF, Medeiros FA, editors. Intraocular Pressure:Reports and Consensus Statements of the 4th Global AIGS Consensus Meeting on Intraocular Pressure. Amsterdam (Netherlands): Kugler; 2007:59–74.
2. Gordon MO, Kass MA. The Ocular Hypertension Treatment Study: design and baseline description of the participants. Arch Ophthalmol. 1999;117(5):573–583.
3. Collaborative Normal-Tension Glaucoma Study Group. The effective-ness of intraocular pressure reduction in the treatment of normal-tension glaucoma. Am J Ophthalmol. Oct 1998;126(4):498–505.
4. Mills RP, Janz NK, Wren PA, Guire KE. Correlation of visual field with quality-of-life measures at diagnosis in the Collaborative Ini-tial Glaucoma Treatment Study (CIGTS). J Glaucoma. 2001;10(3): 192–198.
5. Heijl A, Leske MC, Bengtsson B, et al. Early Manifest Glaucoma Trial Group. Reduction of intraocular pressure and glaucoma progression: results from the Early Manifest Glaucoma Trial. Arch Ophthalmol. 2002;120(10):1268–1279.
6. The Advanced Glaucoma Intervention Study Investigators. Advanced Glaucoma Intervention Study. 2. Visual field test scoring and reliability.
Ophthalmology. 1994;101(6):1445–1455.
7. Garway-Heath DF, Kotecha A, Lerner F, et al. Measurement of intraocular pressure. In: Weinreb RN, Brandt JD, Garway-Heath DF, Medeiros FA, editors. Intraocular Pressure:Reports and Consensus Statements of the 4th Global AIGS Consensus Meeting on Intraocular Pressure. Amsterdam (Netherlands): Kugler; 2007:17–21.
8. National Institute for Health and Clinical Evidence. NICE Clinical Guidelines Cg85. Glaucoma:Diagnosis and Management of Chronic Open Angle Glaucoma and Ocular Hypertension. London: National Institute for Health and Clinical Evidence; 2009. Available from http:// www.nice.org.uk/CG85. Accessed September 25, 2013.
9. Perkins ES. Hand-held applanation tonometer. Br J Ophthalmol. 1965; 49(11):591–593.
10. Mark HH, Mark TL. Corneal astigmatism in applanation tonometry.
Eye (Lond). 2003;17(5):617–618.
11. The British Standards Institution. BS EN ISO 8612:2009:Ophthalmic instruments. Tonometers. London: 2009. Available from http:// www.britishstandard.org/index.php?main_pag e=product_ info&cPath=1&products_id=1133. Accessed January 25, 2013. 12. Haag-Streit International. Applanation Tonometer:Instructions for use.
Koeniz (Switzerland). 2010:16. Available from: http://www.haagstreit. com/fileadmin/haagstreit_international/Documents/Manual/IFU%20 AT900_eng.pdf. Accessed January 25, 2013.
13. Bland MJ, Altman DG. Statistical methods for assessing agree-ment between two methods of clinical measureagree-ment. Lancet. 1986; 1(8476):307–310.
14. Goldmann H. Applanation Tonometry. In: Newell FW, editor. Glaucoma.
Transactions of the Second Conference. New York: Josiah Macy Jr Foundation. 1957:167–220.
15. Hansen FK, Ehlers N. Elevated tonometer readings caused by a thick cornea. Acta Ophthalmol (Copenh). 1971;49(5):775–778.
16. Ehlers N, Bramsen T, Sperling S. Applanation tonometry and central corneal thickness. Acta Ophthalmol (Copenh). 1975;53(1):34–43. 17. Doughty MJ, Zaman ML. Human corneal thickness and its impact on
intraocular pressure measures: a review and meta-analysis approach.
Surv Ophthalmol. 2000;44(5):367–408.
18. Schiøtz H. Ein neuer Tonometer. Arch Augenheilk. 1905;52:401. 19. Andrade SF, Cremonezi T, Zachi CA, et al. Evaluation of the
Perkins handheld applanation tonometer in the measurement of intraocular pressure in dogs and cats. Vet Ophthalmol. 2009;12(5): 277–284.
20. Andrade SF, Kupper DS, Pinho LF, et al. Evaluation of the Perkins handheld applanation tonometer in horses and cattle. J Vet Sci. 2011;12(2):171–176.
21. Hammond BR, Bhattacherjee P. Calibration of the Alcon applanation pneumatonograph and Perkins tonometer for use in rabbits and cats.
Curr Eye Res. 1984;3(9):1155–1158.
22. Kalesnykas G, Uusitalo H. Comparison of simultaneous readings of intraocular pressure in rabbits using Perkins handheld, Tono-Pen XL, and TonoVet tonometers. Graefes Arch Clin Exp Ophthalmol. 2007; 245(5):761–762.
23. Lim KS, Wickremasinghe SS, Cordeiro MF, Bunce C, Khaw PT. Accuracy of intraocular pressure measurements in new zealand white rabbits. Invest Ophthalmol Vis Sci. 2005;46:2419–2423.
24. Weinreb RN, Brandt JD, Garway-Heath DF, Medeiros FA, editors.
Intraocular Pressure: Reports and Consensus Statements of the 4th Global AIGS Consensus Meeting on Intraocular Pressure. Amsterdam (Netherlands): Kugler; 2007.
25. McMillan F, Forster RK. Comparison of MacKay-Marg, Goldmann, and Perkins tonometers in abnormal corneas. Arch Ophthalmol. 1975;93:420–424.
26. Krieglstein GK, Waller WK. Goldmann applanation versus hand-applanation and schiötz indentation tonometry. Albrecht Von Graefes Arch Klin Exp Ophthalmol. 1975;194(1):11–16.
27. Santos MG, Makk S, Berghold A, Eckhardt M, Haas A. Intraocular pressure difference in Goldmann applanation tonometry versus Perkins hand-held applanation tonometry in overweight patients.
Ophthalmology. 1998;105(12):2260–2263.
Clinical Ophthalmology downloaded from https://www.dovepress.com/ by 118.70.13.36 on 21-Aug-2020
Clinical Ophthalmology
Publish your work in this journal
Submit your manuscript here: http://www.dovepress.com/clinical-ophthalmology-journal
Clinical Ophthalmology is an international, peer-reviewed journal covering all subspecialties within ophthalmology. Key topics include: Optometry; Visual science; Pharmacology and drug therapy in eye diseases; Basic Sciences; Primary and Secondary eye care; Patient Safety and Quality of Care Improvements. This journal is indexed on
PubMed Central and CAS, and is the official journal of The Society of Clinical Ophthalmology (SCO). The manuscript management system is completely online and includes a very quick and fair peer-review system, which is all easy to use. Visit http://www.dovepress.com/ testimonials.php to read real quotes from published authors.
Dovepress
Dove
press
arora et al
28. Wallace J, Lovell HG. Perkins hand-held applanation tonometer: A clinical evaluation. Br J Ophthalmol. 1968;52(7):568–572. 29. Wingert TA, Bassi CJ, McAlister WH, Galanis JC. Clinical
evalu-ation of five portable tonometers. J Am Optom Assoc. 1995;66(11): 670–673.
30. Baskett JS, Goen TM, Terry JE. A comparison of Perkins and Goldmann applanation tonometry. J Am Optom Assoc. 1986;57(11): 832–834.
31. Wessels IF, Oh Y. Tonometer utilization, accuracy and calibration under field conditions. Arch Ophthalmol. 1990;108(12):1709–1712.
32. Tonnu P-A, Ho T, Sharma K, White E, Bunce C, Garway-Heath D. A comparison of four methods of tonometry: method agreement and interobserver variability. Br J Ophthalmol. 2005;89(7):847–850. 33. Parker VA, Herrtage J, Sarkies NJ. Clinical comparison of the Keeler
Pulsair 3000 with Goldmann applanation tonometry. Br J Ophthalmol. 2001;85(11):1303–1304.
34. Vandewalle E, Vandenbroeck S, Stalmans I, Zeyen T. Comparison of ICare, dynamic contour tonometer, and ocular response analyzer with Goldmann applanation tonometer in patients with glaucoma. Eur J Ophthalmol. 2009;19(5):783–789.
Clinical Ophthalmology downloaded from https://www.dovepress.com/ by 118.70.13.36 on 21-Aug-2020