51
DNA Binding and Cleavage Activity of Three New Copper (II) Complexes of
Chiral N-salicyl-
β
-amino Alcohol Schiff Bases
Turgay Tunç*
1, Nadir Demirel
2, Mahmut Emir
2, Aslıhan Günel
2, Mehmet Çolak
3, Nurcan Karacan
41 Department of Chemistry Engineering and Process, Faculty of Engineering, University of Ahi Evran, Kırsehir.; 40100, Turkey
2Department of Chemistry, Faculty of Science & Art, University of Ahi Evran, Kırsehir.; 40100; Turkey 3Department of Chemistry.; Faculty of Science.; University of Dicle.; Diyarbakır.; 21280.; Turkey 4Department of Chemistry.; Faculty of Science.; University of Gazi.; Ankara.;06500.; Turkey
* Corresponding author: Tel.: +90 0386 22 00; fax: +90 0386 280 38 01, e-mail: [email protected]
Received December 6th, 2017; Accepted May 16th, 2018.
DOI: http://dx.doi.org/10.29356/jmcs.v62i3.424
Abstract. Three new copper(II) complexes (1-3) with general formula [Cu(HL)CH3COO] of N-salicyl-β
-amino alcohol Schiff bases containing, (S)-(+)-phenyl glycinol, (1S, 2R)-2-amino-1, 2-diphenylethanol and 1, 1, 3-triphenyl-(R)-(+)-2-amino propanol, were synthesized. Their structures were characterized by FTIR, LCMS, magnetic moment, molar conductance and elemental analysis data. DFT calculations proposed
distorted square planar geometries for the complexes. The calculated IR spectra are in good agreement with
the experimental IR spectra, confirming the proposed structures. Their interactions with calf thymus DNA
were investigated and their binding constants Kb were found. Gel electrophoresis reveals that all complexes display significant nuclease activity against supercoiled pentry/d-topo plasmid DNA.
Keywords: Copper (II) complexes; DFT calculations; DNA binding; DNA cleavage; Schiff base complexes.
Resumen. Tres nuevos complejos de cobre (II) (1-3) con la fórmula general [Cu (HL) CH3COO] de
N-salicil-β-amino alcohol Schiff bases que contienen, (S) - (+) - fenilglicinol, (1S, 2R).Se sintetizaron -amino-1, 2-difeniletanol y 1, 1, 3-trifenil- (R) - (+) - 2-amino propanol. Sus estructuras se caracterizaron por FTIR, LCMS, momento magnético, conductancia molar y datos de análisis elemental. Los cálculos de DFT
propusieron geometrías planas cuadradas distorsionadas para los complejos. Los espectros de IR calculados están en buena concordancia con los espectros de IR experimentales, confirmando las estructuras propuestas.
Se investigaron sus interacciones con el ADN del timo de ternera y se encontraron sus constantes de unión
Kb. La electroforesis en gel revela que todos los complejos muestran una actividad nucleasa significativa contra el ADN plasmídico pentry / d-topo superenrollado.
Palabras clave: Complejos de Cobre (II); Cálculos DFT; unión al ADN; ruptura de DNA; Complejos de base de Schiff.
Introduction
Chiral complexes have important applications in many fields such as enantioselective catalysts, material sciences, metallo-supramolecular chemistry and bio-inorganic modeling studies [1]. They catalyze
various asymmetric organic transformations giving high enantioselectivity [2, 3]. In recent years, Schiff-bases derived from chiral amino alcohols and their transition metal complexes have been reported to catalyze the
52
Cu(II) are well known to be a redox-active metal whose complexes can generate reactive oxygen species (ROS) which trigger DNA degradation and apoptosis of cancer [7-9]. Schiff bases copper(II) complexes have been extensively studied as encouraging alternatives to cisplatin and anticancer drugs [10-12]. Several copper complexes have been started pre-clinical research as antitumor drug candidates, which demonstrated relatively lower side effects compared with some platinum drugs [13].
The synthesis and design of chiral metal complexes have attracted a considerable amount of attention because they can bind to DNA, and changes their photophysical properties [1]. In previous work, DNA binding and cleavage studies of chiral copper complexes have been broadly investigated [14–19]; however, study on Schiff bases copper complexes with chiral amino-alcohols have rarely been reported [20- 23].
In this paper, we synthesized new copper(II) complexes of Schiff bases derived from (S)-(+)-phenyl glycinol (1), (1S, 2R)-2-amino-1, 2-diphenylethanol (2) and 1,1,3-triphenyl-(R)-(+)-2-amino propanol (3). Their interactions with CT-DNA were investigated. DNA cleavage activity with supercoiled pentry/d-topo
plasmid DNA has also been carried out.
Scheme 1. Synthesis route and proposed structure of the copper (II) complexes.2. Experimental
Materials and Physical Measurements
All reagents s and solvent were purchased from Sigma Aldrich and used without further purification.
Elemental analyses for C, H and N were carried out with a LECO CHNS-932 auto elemental analyzer. The copper analysis was carried out by Varian Atomic Absorption spectrophotometer (AAS) model-AA55B. Mass
spectra were recorded with Thermo Scientific TSQ Quantum Access Max LC-MS spectrometers in
53
susceptibility was carried out using a Sherwood Scientific instrument at room temperature. The molecular
conductivities of the copper(II) complexes were measured with a WTW Cond 330i conductivity meter. All measurements were carried out at room temperature with freshly prepared solutions. Melting points were measured using a Thermo Fisher Scientific Electrothermal 9100 apparatus.
Synthesis of the Cu(II) complexes
Chiral amino alcohol Schiff bases (H2L) are synthesized according to the reported procedure [24].
An ethanol solution of (25 mL) of (18 mmol) was added to an ethanol solution of o-hydroxybenzaldehyde (15 mmol). The mixture was refluxed for 16 h. After the reaction completed, mixture evaporated to dryness. The pale yellow solid was crystallized from ethyl acetate.
All complexes were synthesized using the following general procedure (Scheme 1). A methanol solution (10 mL) of the chiral Schiff bases (0.064 mmol) was added dropwise to a methanol solution (10 mL) of copper (II) acetate (0.064 mmol, 11.7 mg). The mixture was then refluxed for two hours at 60 oC. After the reaction
completed, the mixture was allowed to cool and waited for 2 days at room temperature. The green solid was collected by vacuum filtration and washed twice with 3–5 mL aliquots of ice-cold methanol and dried under
vacuum.
[Cu(HL
1)CH
3
COO] (1).
C17H17CuNO4 : Anal. Calcd. C, 56.27; H, 4.72; N,3.86, Cu:17.51. Found: C, 56.35; H, 4.62; N, 3.79, Cu: 17.49. LC-MS (m/z): 380.91[Cu(HL1)CH3COO+NH4+], 334.95 [MH4 -OH-CH3+], 242.05 (H3L+) Λmº: 12.11 ohm-1cm2mol-1 in DMF. μeff:1.84 BM. Yield: 0.031 g (88.9%), m.p:104-106 oC.
[Cu(HL2)CH3COO] (2). C23H21CuNO4: Anal. Calc.: C, 62.93; H, 4.82; N, 3.19. Cu: 14.48, Found:
C, 63.30; H, 5.17; N, 3.16, Cu:13.89. LC-MS (m/z): 456.97[Cu(HL2)CH3COO+NH4+], 424.96[MH-CH3+],
410.99 [MH4-OH-CH3], 396.93[MH-CO.CH3], 318.06 (H3L+). Λmº: 11.25 ohm-1cm2mol-1in DMF. μeff: 1.85 BM. Yield: 0.036 g (82.9%), mp: 122-124 oC.
[CuHL
3CH
3COO] (3).
C30H27CuNO4: Anal. Calc C, 68.10; H, 5.14; N, 2.65. Cu: 12.01, Found:C, 68.41; H, 6.52; N, 2.39, Cu: 11.30. LC-MS (m/z+): 547.01 [CuHL3CH3COO+NH4]+, 515.02 [MH-CH3]+,
501.04 [MH4-OH-CH3]+, 408.06 [M-CH3CO-Ph]+. Λmº: 14.45 ohm-1cm2mol-1in DMF. μeff: 1.83 BM. Yield: 0.042 g (79.4%), mp: 123-125 oC.
Computational method
Theoretical calculations were performed with Gaussian 03W(B.04) software [25] and visualized using GVW (Rev 2.1) [26]. Since we were not able to obtain the single crystals of the complexes, the experimental data of starting geometries were taken from the earlier published studies [27, 28]. Geometry optimization of complexes were carried out using several DFT methods such as CAM-B3LYP/6-31G(d,p),
CAM-B3LYP/6-311G(d,p), B3LYP/6-31G(d,p), B3LYP/6-311G(d,p) and B3LYP/6-311G+(d,p) for all
atoms. Harmonic vibrational frequencies and IR intensities of the normal modes were calculated at the same
level, and no imaginary frequencies were found, confirming that the structures correspond to minimum
energy. The calculated frequencies were scaled by 0.97-0.98. Vibrational frequency assignments were made with GVW software to display the vibrations.
DNA Binding Studies
Interaction of the complexes with CT-DNA was conducted in Tris buffer (5 mM, pH 7.1). A solution
of the CT-DNA in the buffer solution give a ratio of UV-Vis absorbance at 260 and 280 nm of about 1.9:1
indicating that the DNA was free from proteins [29]. DNA concentration was determined by the molar extinction coefficient (6600 M-1 cm-1) at 260 nm [30]. Absorption spectral titration experiments were performed by maintaining a constant concentration of the complex and varying the CT-DNA concentration. While measuring the absorbance, recorded after consecutive additions of CT-DNA, CT-DNA was added to
54
[DNA]/ (εa - εf) = [DNA]/ (εb - εf) + 1/Kb (εb - εf)
where [DNA] represents the concentration of DNA in base pairs; εa, εf, and εb correspond to the apparent
extinction coefficient (Aobs/[M]), the extinction coefficient of the free metal and the extinction coefficient of the complex bound to DNA, respectively. The plot of [DNA]/ (εa - εf) vs [DNA] gave a straight line with a slope of 1/(εb - εf) and an intercept of 1/Kb(εb - εf). Kb was determined from the ratio of the slope to intercept.
DNA Cleavage Experiment
Native super coiled pentry/d-topo plasmid DNA was purified using Perfect Prep Endo Free Plasmid Maxi Kit according to manufacturer instructions. Solution of plasmid DNA gave a ratio of UV absorbance at 260 and 280 nm, A260/A280 of ca.180 and 1.90, indicating that the DNA was free from protein contamination. A stock solution of complexes were prepared at a concentration of 500 µM. Plasmid DNA (22
µL) in a final volume of 50 µL were treated with varying concentration of complexes (20-150 µM) and incubated in the dark for 12 h at 37 oC. 20 µL of each sample and 10 µL of the loading dye were loaded onto 1% agarose gel in 1X TAE buffer (Tris–Acetate–EDTA. Agarose gel electrophoresis was performed at 75 V for 90 min. Later gel was stained with ethidium bromide solution (10 mg/mL) and the bands were observed under UV gel documentation system (Gene Tools image analysis software from Syngene). This software
provides comparison of tracks in agarose gel according to their band numbers and/or band densities. (This evaluation was performed by comparing the either volume of bands in the lanes or calculating the volume of newly formed bands with control plasmid DNA).
Results and discussion
Synthesis and general characterization
The copper(II) complexes (1-3) were synthesized by the reaction of cupric acetate with chiral N -salicyl-β-amino alcohol Schiff bases prepared by condensation reaction of o-hydroxybenzaldehyde with
S)-(+)-phenyl glycinol (H2L1), (1S, 2R)-2-amino-1, 2-diphenylethanol(H2L2) and 1,1,3-triphenyl-(R)-(+)-2-amino
propanol (H2L3) in an equimolar ratio. Their crystals were unsuitable for single-crystal X-ray structural determination. Their elemental analysis data indicate that the metal to ligand ratio is 1:1 in all the complexes.
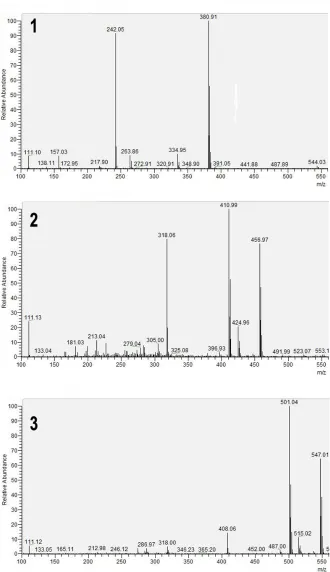
Their molar conductivities (Λm) in DMF solution (1x10⁻³ M) at 25 °C were in the range of 12 – 16 Ohm -1cm2mole-1, indicating that all complexes are non-electrolytes. LC-MS spectra of the complexes were depicted in Fig.1. The positive ion electrospray mass spectra have exhibited [M+ NH4]+molecular ion peaks at 380.91 for 1, 456.97 for 2 and 547.01 for 3. Adduct ion as [M+NH4]+ is reported in literature to be frequently
observed in ESI analysis [32]. Demetallation fragment (H3L+) gave a base peak at 242.05 for 1 and 318.06 for 2. Other fragments correspond to the homolytic cleavage of OH and/or CH3groups. Based on these results,
the structures of the complexes were suggested to be as shown in Scheme 1. Similarly, copper (II)- Schiff
56
Geometry optimization of the complexes
Geometry optimization gives more information about atomic arrangement, without crystal data, and also provides the most stable structure. It is well-known that acetate group behaves as both terminal and bridging, and both monodentate and bidentate ligand [33-36]. We attempt to optimize the monomeric
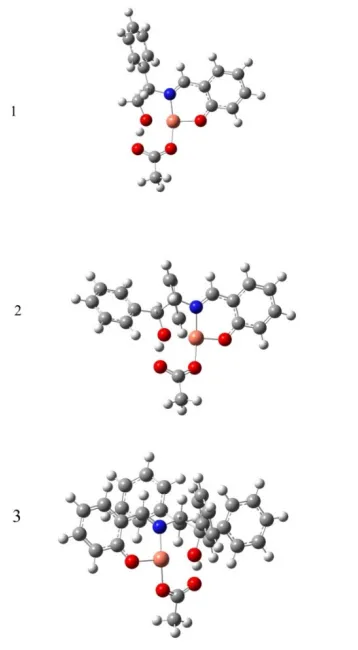
[Cu(HL)(η1-acetato)] and [Cu(HL)(η2-acetato)] complexes. Geometry optimization results clearly indicated that the acetate group coordinated in a monodentate mode to make hydrogen bonding with alcohol group. The ground state geometry optimized at DFT/B3LYP/6-311G+(d,p) level in gas phase of the complexes (1-3) are
shown in Fig. 2. Except for substituent differences, the overall structures of the (1–3) are very similar. The
geometry around the copper is a distorted square-planar geometry with tridentate ligand (ONO) and
monodentate acetate ligand. In each structure, monoanionic ligand coordinates to copper atom through the alcoholic-O, the imine-N and the phenolic-O atoms forming six-membered and five-membered chelate rings.
One O atom of the acetate ligand completes a distorted N2O2 square-plane around the metal center. Intra
-molecular hydrogen bond in the complexes (O-H….Oac) is formed between alcoholic-H and second oxygen
atom of the acetateligand and stabilize the molecular conformation. The trans-N– Cu–O(acetato) and trans-O– Cu–O bond angles deviate significantly from the true square planar 180° angles and are calculated to be 163.4(±0.3)° and 168.5(±0.3)°, respectively in all complexes, and are similar to those found in related
structures [23, 33]. Calculated Cu-O (acetate) bond lengths are 1.93(±0.01) Å, which is comparable with the values reported before [33,37]; whereas, the calculated distances between the copper atom and the other O
-atom of the acetate ligand are 2.43(±0.01) Å in all complexes, indicating that there is no covalent bond between them, and acetate group behaves as monodentate ligand.
Fig. 2. The optimized molecular geometries of the copper (II) complexes, calculated by DFT/B3LYP/6
57
IR spectra of the complexes
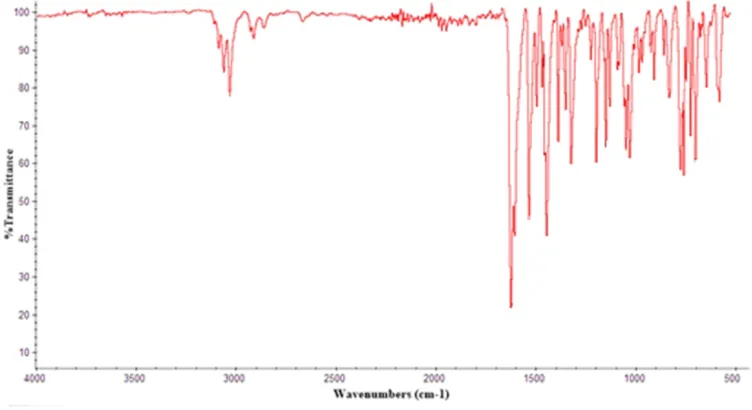
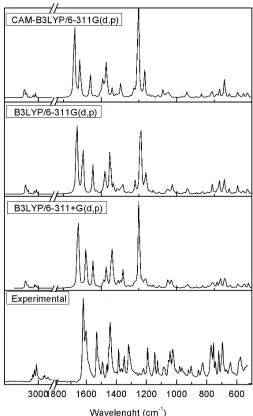
Observed FTIR spectra of the complexes were illustrated in Figs 3-5, which are very similar to each
other. Their harmonic vibrational frequencies were calculated with three different basis set, CAM-B3LYP/6
-31G(d,p), B3LYP/6-311G(d,p) and B3LYP/6-311+G(d,p) in gas phase. For comparison, calculate and
experimental spectra were given for 2 in Fig.6. As seen in Fig 6, theoretical vibrational frequencies computed with B3LYP/6-311+G(d,p) showed good agreement with experimental results. Similarity between the spectral
patterns theoretical and experimental IR spectra were confirmed the proposed structures. The
calculated-observed agreement is satisfactory. Little deviations can be attributed to two factors: crystal packing effects
and the negligence of anharmonicity. The average error in frequencies calculated by B3LYP method is reported to be of the order of 40-50 cm-1 [38].Because the DFT/B3LYP methods overcalculate normal mode
frequencies due to a combination of basis set deficiencies and electron correlation effects. Therefore, calculated frequencies were corrected with scaling factors of 0.98-0.96 to obtain better agreement with
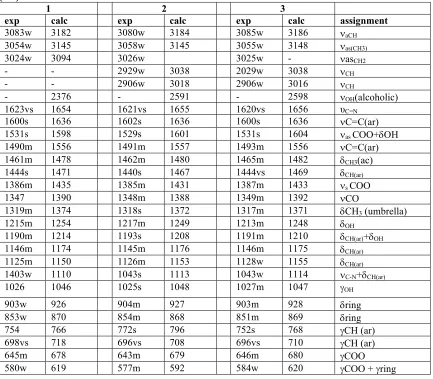
experimental and calculated frequencies. The observed frequencies have been assigned with the calculated peak intensities and scaled peak frequencies. Experimental and calculated frequencies of selected vibrational
modes for the complexes were given in Table 1.
58
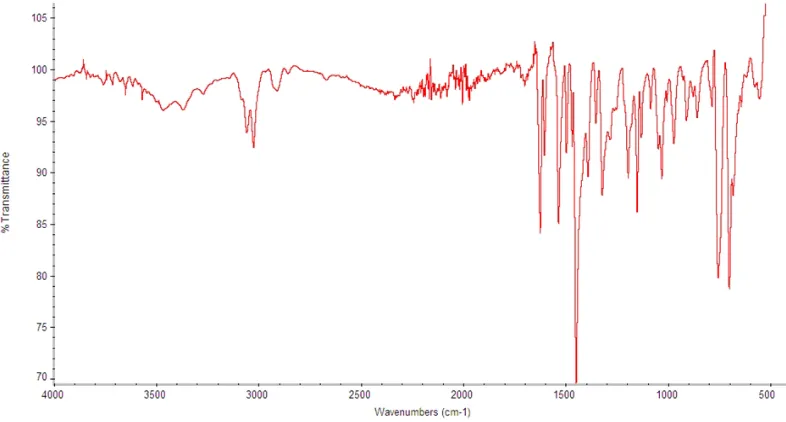
Fig. 4. IR spectrum of the 2.59
Table 1. Experimental and calculated (no scale) wavenumbers of selected vibrational modes of the complexes(1-3).
1 2 3
exp calc exp calc exp calc assignment
3083w 3182 3080w 3184 3085w 3186 νaCH
3054w 3145 3058w 3145 3055w 3148 νas(CH3)
3024w 3094 3026w 3025w - νasCH2
- - 2929w 3038 2029w 3038 νCH
- - 2906w 3018 2906w 3016 νCH
- 2376 - 2591 - 2598 νOH(alcoholic)
1623vs 1654 1621vs 1655 1620vs 1656 υC=N
1600s 1636 1602s 1636 1600s 1636 νC=C(ar)
1531s 1598 1529s 1601 1531s 1604 νas COO+δOH
1490m 1556 1491m 1557 1493m 1556 νC=C(ar)
1461m 1478 1462m 1480 1465m 1482 δCH3(ac)
1444s 1471 1440s 1467 1444vs 1469 δCH(ar)
1386m 1435 1385m 1431 1387m 1433 νs COO
1347 1390 1348m 1388 1349m 1392 νCO
1319m 1374 1318s 1372 1317m 1371 δCH3(umbrella)
1215m 1254 1217m 1249 1213m 1248 δOH
1190m 1214 1193s 1208 1191m 1210 δCH(ar)+δOH
1146m 1174 1145m 1176 1146m 1175 δCH(ar)
1125m 1150 1126m 1153 1128w 1155 δCH(ar)
1403w 1110 1043s 1113 1043w 1114 νC-N+δCH(ar)
1026 1046 1025s 1048 1027m 1047 γOH
903w 926 904m 927 903m 928 δring
853w 870 854m 868 851m 869 δring
754 766 772s 796 752s 768 γCH (ar)
698vs 718 696vs 708 696vs 710 γCH (ar)
645m 678 643m 679 646m 680 γCOO
580w 619 577m 592 584w 620 γCOO + γring
Aromatic C-H stretching vibrations were calculated in the range 3200 - 3000 cm-1 and assigned in the
range 3100-3000 cm-1. The characteristic imine (–HC=N–) stretching vibration was computed around 1655 cm-1and observed as a strong band around at 1623-1620 cm-1 in the complexes. Besides, a medium band near 1460 cm-l was also assigned to the CH3asymmetric deformation vibrations of the acetate group [39]. In all
three complexes, phenolic C-O vibrations shifted to higher wavenumber due to coordination were observed as
a medium to high-intensity band around 1348 cm-1.
The theoretical asymmetric stretching νas(COO-) and symmetric stretching νs(COO) frequencies of
the acetate ligands in the complexes were computed around 1600 and 1530 cm-1 respectively; in their experimental IR spectra, these vibrations were observed as strong intensity bands around 1530 and 1385 cm-1, respectively. The difference between asymmetric and symmetric stretching vibrations (∆) were found to be
145 cm-1. It is claimed that ∆ values gives information about bonding mode of the carboxylate group. Generally, the monodentate acetate ligands have ∆ > 200 cm-1. However, some complexes possesing crystal
structures, with unidentate acetate ligands such as Zn(ac)2(SC(NH2)2)2 (∆:152 cm-1), Ni(ac)2(H2O)4 (∆:125
cm-1) and Ni(ac2(H2O)2(py)2 (138 cm-1) were reported ∆ values less than 200 cm-1 [39x]. In this case, the
acetate oxygen not coordinated to the metal is hydrogen bonded to other ligands (thiourea or water), giving
rise to a “pseudo-bridging” arrangement [40, 41]. On the other hand, [Cu(ac)NH((CH2)3NH2)2]ClO4 (∆: 150
cm-1), [Cu(ac)2(H2O)]2 (∆: 175 or 200 cm-1) with bridging acetate ligand , and Cu(ac)(PPh3)2 (∆: 131 or 160
60
indicative of monodentate acetato groups; however, structures have not been proposed precisely on the basis
of ∆ values lower than 200 cm-1.
A broad band at about 3300 cm-1 was assigned to the intra-molecular hydrogen-bonded OH group [39]. This band is generally displaced to 2840-2960 cm-1 due to internal hydrogen bridge OH…NC [42]. As the hydrogen bond becomes stronger, the bandwidth increases, and this band sometimes cannot be detected [43]. The relatively planar ligands favors intramolecular hydrogen bond formation. For our complexes, the disappearance of this band is expected due to strong intramolecular hydrogen bond between OH group of
ligand and free oxygen atom of the acetate group (Fig 2). This expectation is supported by DFTcalculation, and OH stretching vibration were computed in the region 2376-2598 cm-1. C–H..O or C-H...N intermolecular interactions may also contribute this disappearances. On the other hand, in-plane and out-of plane bending vibrations of OH groups were assigned as medium bands in the region 1217-1213 cm-1and strong bands near
1025 cm-1, respectively.
61
DNA Binding Studies
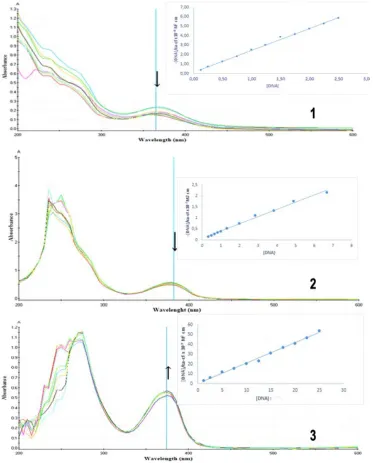
The potential binding ability of the copper (II) complexes (1-3) to CT-DNA was studied using UV absorption spectrometry. The absorption spectra of the titration of the copper(II) complexes (100 µM) with CT-DNA from 0 to 250 µMare shown in Fig. 7. Absorption band in the range 350-450 nm in the buffer solution correspond to π → π* transition of the aromatic rings of the copper(II) complexes. As seen in Fig.7, the band height at 360 nm gradually decreases for 1 and 2, but increases for 3. On titration with CT-DNA, complex 1 exhibits slight hypochromic (6.34 %) and narrow bathochromic (+9 nm) effects; whereas, complex
2 displays significant hypochromic (14.42 %) and large bathochromic(+12 nm) effects; moreover, complex 3 shows slight hyperchromic (18.25 %) and narrow hypochromic (-18 nm) effects.
Fig. 7. Electronic absorption spectra of the complexes (1-3) (1x10⁻⁴M) in the absence and presence of
62
Hypochromism is caused by parallel stacking of base pairs in a double helix and refer to the presence of intercalation or at last partial intercalation for (2) and (1). Intercalation result from the contraction of DNA in the helix axis due to a strong stacking interaction between an aromatic chromophore and the base pairs of
DNA, consequently the energy level of the π-π∗electron transition decreases, which causes a redshift in UV absorption spectra. The extent of the hypochromic is usually proportional to the strength of the interaction.
Whereas, hyperchromism is an indication of the reduction in the amount of parallel stacking in double helix
resulting from 1,2-intrastrand crosslinking. The extent of the hyperchromism is indicative of the partial or non-intercalative binding modes [43, 45]. On the other hand, cis-platin and analogs were reported to have
hyperchromic and bathochromic shifts [46].
In order to compare the DNA-binding strengths of these complexes, the intrinsic binding constant Kb
was determined from the changes in absorbance. The values of Kb were 4.15×10⁴ (1), 1.80×10⁵ (2) and 2.39×10⁶ (3), respectively. Compound (2) contain one more phenyl group than (1), resulting in greater Kb value and higher hypochromic effect. It was expected result that the more aromatic group increases the
non-covalent complex/DNA interaction (intercalation). However, (3) has one more benzyl group than (2),
resulting in greater Kb value but hyperchromic effect. This indicates non-intercalative interaction.It may be assumed that increase in molecular volume prevents the intercalation. In literature, chiral alkanol amine Schiff
base copper(II) complexes having [Cu8]8+ and [Cu4]8+units are reported to exhibit hyperchromism [39].
DNA cleavage activity
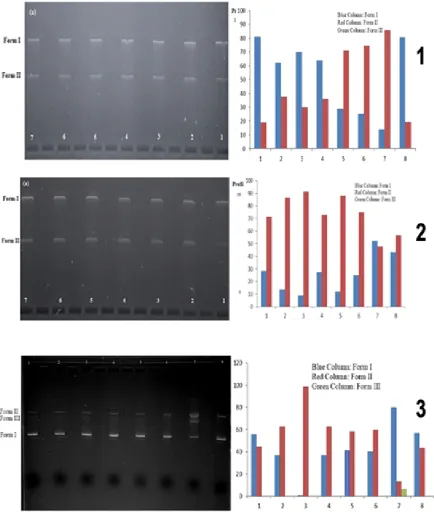
The DNA cleavage activity of the complexes for supercoiled pentry/d-topo plasmid DNA was
investigated by gel electrophoresis. When supercoiled DNA is subject to electrophoresis, relative migration will be observed for the intact supercoiled form (Form I). If cutting occurs on one strand (nicking), the
supercoiled form will relax and generate a slower-moving singly nicked form (Form II). If both strands are cleaved, a double nicked linear form (Form III) that migrates between Form I and Form II will be generated.
Plasmid DNA electropherogram traces of the complexes (1-3) with increasing concentration (5-200 µM) were given in Fig 8.
As shown in Fig. 6-8, with the increase of the concentrations of the complex 1, the supercoiled DNA decreases and nicked form gradually increases up to 150 µM (line 7). However, DNA cleavage activity of the
complex 2 is not concentration dependent; maximum conversion of SC DNA into NC DNA was observed at 10 µM (line 3) for complex 2. When the concentrationis added to 150 µM, the linear form (Form III) begins
to appear for complex 3. The results indicate the following increasing order of cleavage activity: 3 > 2 > 1.
64
Conclusions
Three new chiral copper(II) complexes containing chiral Schiff bases derived from chiral ethanolamines, (S)-(+)-phenyl glycinol (1), (1S, 2R)-2-amino-1, 2-diphenylethanol (2) and 1,1,3-triphenyl-(R)-(+)-2-amino propanol (3) have been synthesized and characterized with analytic and spectrophotometric method. DFT calculation proposed that complexes (1-3) have a distorted square-planar geometry with one
Schiff base (ONO) and one acetato ligand. In each structure, Schiff bases behave as monoanionic tridentate ligands with the alcoholic-O, the imine-N and the phenolic-O atoms forming six-membered and five
-membered chelate rings: however, acetate behaves as monodentate ligand with one O atom. Its other oxygen
atom makes intra-molecular hydrogen bond with alcoholic-H atom of the Schiff base and stabilizes the molecular conformation.
The complex 1 and 2 interact with CT-DNA most likely through the intercalative mode. On increasing the concentration of CT-DNA, hypochromism of 6.34 % and redshift of 9 nm for 1, and hypochromism of 14.42 % and redshift of 12 nm for 2 are observed. Hypochromism with redshift is pointed out interaction of DNA via ligand intercalation [47]. This kind of findings were observed in another cupper -scorpian like ligands [48] However, complex 3 shows hyperchromic effect (18.25 %).The binding constants
Kb of the complexes were observed in the following order 3 > 2 > 1.In other words, the more aromatic rings increase, the higher the binding constants of the complexes. As Magnitudes of binding constants of metal ligand complexes are taken into consideration complex 2 and complex 3 might bind to grooves of DNA double helix since the Kb of known major groove binder methyl green is order of
106 M-1[49]. All the complexes were found to exhibit nuclease activity. Super coiled pentry/d-topo plasmid
DNA cleavage activity studies show that complex 3 has best nuclease activity. DNA cleavage activity of the complexes is concentration dependent except complex 2
Acknowledgments
This study was supported by Ahi Evran University Scientific Research Foundation under grant No FEF.A3.16.015
References
1. Sharma, S.; Chauhan, M.; Jamsheera, A.; Tabassum, S.; Arjmand, F. Inorg. Chim. Acta. 2017, 458,
8-27.DOI: 10.1016/j.ica.2016.12.011
2. Chinnaraja, E.; Arunachalam, R.; Choudhary, M.K.; Kureshy, R.I.;d Subramanian, P.S. Appl. Organomet. Chem. 2016, 30, 95-101.DOI: 10.1002/aoc.3404
3. Kumari, P.; Jakhar, A.; Khan, N.H.; Tak, R; Kureshy, R.I.; Abdi, S.H.R.; Bajaj, H.C. Catal. Commun.
2015, 69, 138-142. DOI: 10.1016/j.catcom.2015.06.002
4. Gao, Y-G.; Chen, N.; Wu, H-J.; Li, X-S Russ. J. Org. Chem. 2007, 43,1754-1756. DOI: 10.1134/S1070428007120020.
5. Hsieh, S-H.; Kuo, Y-P; Gau, H-M. Dalton Trans. 2007, 97-106. DOI:10.1039/b613212j
6. Tak, R.; Kumar, M.; Kureshy, R.I.; Choudhary, M. K.; Khan, N.H., Abdi, S.H.R.; Bajaj, H.C. RSC Adv.
2016, 6, 7693-7700. DOI: 10.1039/C5RA23600B
7. Santini, C.; Pellei, M.; Gandin, V.; Porchia, M.; Tisato,F.; Marzano, C. Chem. Rev. 2014, 815-862. DOI: 10.1021/cr400135x.
8. Tisato, F.; Marzano, C.; Porchia, M.; Pellei, M; Santini, C. Med. Res. Rev. 2010, 30,708-749.DOI: 10.1002/med.20174
9. Brissos, R. F.; Torrents, E; Mariana dos Santos Mello, F.; Carvalho Pires, W.; de Paula Silveira-Lacerda,
65
6, 1853-1868. DOI:10.1039/C4MT00152D.10. Lian, W-J.; Wang, X-T.; Xie, C-Z.; Tian, H.; Song, X-Q.; Pan, H-T.; Qiao, X; Xu, J-Y. Dalton Trans.
2016, 45, 9073-9087. DOI: 10.1039/C6DT00461J
11. Shokohi-pour, Z.; Chiniforoshan, H.; Momtazi-borojeni, A.A.; Notash, B. J. Photochem. Photobiol. B Biol. 2016, 162, 34-44. DOI: 10.1016/j.jphotobiol.2016.06.022
12. Yu, H.; Yang, Y.; Li, Q.; Ma,T.; Xu, J.; Zhu, T.; Xie, J.; Zhu, W.; Cao, Z.; Dong, K.; Huang, J.; Jia, L.
Chem Biol Drug Des 2016, 87, 398-408. DOI 10.1111/cbdd.12669
13. Zhang, Z.; Gou, Y.; Wang, J.; Yang, K.;Qi, J.; Zhou, Z.; Liang, S.; Liang, H.; Yang, F. Eur. J. Med. Chem. 2016, 121, 399-409. DOI: 10.1111/cbdd.12669
14. Arjmand, F.; Muddassir, M.; Yousuf, I. J. Photochem. Photobiol. B Biol. 2014,136, 62-71. DOI: 10.1016/j.jphotobiol.2014.04.024
15. da Silveira, V.C.; Luz, J.S.; Oliveira, C.C.; Graziani, I.; Ciriolo, M.R.; da Costa Ferreira, A.M. J. Inorg. Biochem. 2008, 102, 1090-1103. DOI:10.1016/j.jinorgbio.2007.12.033
16. Dezhahang, Z.; Poopari, M.R.; Cheramy, J.; Xu, Y. Inorg. Chem. 2015, 54, 4539-4549.DOI: 10.1021/acs.inorgchem.5b00386
17. Ng, C. H. ; Chan, C.W.; Lai, J.W.; Ooi, I. H.; Chong, K. V.; Maah, M. J.; Seng, H. L. J. Inorg. Biochem.
2016, 160, 1-11. DOI: 10.1016/j.jinorgbio.2016.04.003.
18. Zhang, W.C.; Tang, X.; Lu, X. J. Inorg. Biochem. 2016, 156, 105-112. DOI: 10.1016/j.jinorgbio.2016.01.007
19. Zhou, X-Q; Li, Y.; Zhang, D-Y; Nie, Y; Li, Z-J.; Gu, W.; Liu, X.; Tian, J-L.; Yan, S-P. Eur. J. Med. Chem. 2016, 114, 244-256. DOI: 10.1016/j.ejmech.2016.02.055.
20. Arjmand, F.; Sayeed, F.; Muddassir, M. J. Photochem. Photobiol. B Biol. 2011, 103, 166-179. DOI: 10.1016/j.jphotobiol.2011.03.001
21. Amjad, M.; Sumrra, S.H.; Akram, M.S.; Chohan, Z.H. J. Enzyme Inhib. Med. Chem. 2016, 31, 88-97. DOI: 10.1080/14756366.2016.1220375
22. Yan, H.; Yang, L.; Chang, G-L.;Li, X.; Niu, M-J. Chinese J. Struct. Chem. 2016, 35, 465-471. DOI: 10.14102/j.cnki.0254-5861.2011-0989
23. Niu, M.; Li, Z.; Li, H.; Li, X.; Dou, J.; Wang, S. RSC Adv. 2015, 5, 37085-37095. DOI: 10.1039/C5RA00623F.
24. Çolak, M.; Demirel, N. Tetrahedron: Asymm. 2008, 19, 635-639.DOI: 10.1016/j.tetasy.2008.02.005. 25. Frisch, M.J. Gaussian 03W (Revision B.04). Gaussian.Inc. 2003.
26. Dennington, R. GaussView.W (Rev 2.1). Gaussian. Inc. 2000.
27. Chumakov, Y.M.; Antosyak, B.Y.; Tsapkov, V.I.; Bocelli, G.; Gulya, A.P. Russ. J. Coord. Chem. 2004, 30, 486-490.
28. Dey, M.; Rao, C.P.; Saarenketo P.; Rissanen, K.; Kolehmainen, E. Eur. J. Inorg. Chem. 2002
2207-2215.
29. Marmur, J. J. Mol. Biol.1961, 3, 208-218. DOI: 10.1016/S0022-2836(61)80047-8
30. Reichmann, M.E.; Rice, S.A.; Thomas, C.A.; Doty, P. J. Am. Chem. Soc., 1954, 76, 3047-3053. DOI: 10.1021/ja01640a067
31. Chen, F-J.; Xu, M.; Xi, P-X.;Liu, H-Y.; Zeng, Z-Z. Spectrochim. Acta - Part A Mol. Biomol. Spectrosc.
2011, 81, 21-27. DOI: 10.1016/j.saa.2011.05.020
32. Keller, B.O.; Sui, J.; Young, A.B.; Whittal, R.M.Anal. Chim. Acta, 2008, 627, 71-81. DOI: 10.1016/j.aca.2008.04.043
33. Kozlyuk, N.; Lopez, T.; Roth, P.; Acquaye, H. Inorg. Chim. Acta. 2015, 428, 176-184.DOI: 10.1016/j.ica.2014.12.034
66
35. Maloth, S.; Pal, S. Polyhedron. 2010, 29, 3257-3261. DOI: 10.1016/j.poly.2010.09.003. 36. Mansour, A.M. Inorg. Chim. Acta. 2013, 408, 186-192. DOI: 10.1016/j.ica.2014.12.034 37. Vafazadeh, R.; Hayeri, V.; Willis, A.C. Polyhedron, 2010, 29, 1810-1814. DOI:
10.1016/j.poly.2010.02.030.
38. Bytheway, I.; Wong, M.W. Chem. Phys. Lett. 1998, 282, 219-226. DOI: 10.1016/S0009
-2614(97)01281-5
39. Socrates, G. Infrared and Raman characteristic group frequencies, John Wiley & Sons,Chichester,
2004.
40. 40. Deacon, G.B.; Phillips, R.J. Coord.Chem.Rev. 2008, 33, 227-250.
41. Maslejova, A.; Boca, R.; Dlhhan, L; Papankova, B.; Svoboda, I.; Fuess, H. Chem.Phys.Lett. 2001, 347, 397-402.
42. Faniran, J.A; Patel, K.S., Baliar, J. Inorg. Nucl. Chem. 1974, 36, 1547-1551. DOI:10.1016/0022
-1902(74)80621-4.
43. P.E. Aranha, M.P. dos Santos, S. Romera, E.R. Dockal, Polyhedron 26 (2007) 1373.
44. Rehman, S.U.; Sarwar, T.; Husain, M.A.; Ishqi, H.M.; Tabish, M. Arch. Biochem. Biophys. 2015, 576, 49-60.DOI: 10.1016/j.abb.2015.03.024
45. Sirajuddin, M.; Ali, S.; Badshah, A. J. Photochem. Photobiol. B Biol. 2013, 124, 1-19. DOI: 10.1016/j.jphotobiol.2013.03.013
46. Nakamoto, K.; Tsuboi, M.; Strahan, G.D. Drug-DNA Interactions, John Wiley & Sons, Hoboken, New Jersey,2008.
47. Brissos, R.F.; Torrents, E.; dosSantos Mello, F.M.; Pires, W.C.; de Paula Silveira-Lacerda, E.;
Metallomics 2014, 1853-1868.
48. Inclan, M.; Albelda, M. T.; Frias, J. C.; Blasco, S.; Verdejo, B.; Serena, C.; Canela-Salat, C.; Diaz, M. D.; Garcia-Espana, A.; Garcia-Espana, E., J. Am. Chem. Soc. 2012, 134, 9644−9656
![1 (1 Hydroxyethyl) 7, 8 dihydroindolo [2, 3 a] pyridine [3, 4 g] quinolizin 5 (13H) one (angustoline) monohydrate from Nauclea subdita (Rubiaceae)](data:image/gif;base64,R0lGODlhAQABAIAAAP///wAAACH5BAEAAAAALAAAAAABAAEAAAICRAEAOw==)