P R O C E E D I N G S
Open Access
Interrogating population structure and its impact
on association tests
Huaizhen Qin, Robert C Elston, Xiaofeng Zhu
*From
Genetic Analysis Workshop 17
Boston, MA, USA. 13-16 October 2010
Abstract
We found from our analysis of the Genetic Analysis Workshop 17 data that the population structure of the 697 unrelated individuals was an important confounding factor for association studies, even if it was not explicitly considered when simulating the phenotypes. We uncovered structures beyond the reported ethnicities and found ample evidence of phenotype–population structure associations. The first 10 principal components of the
genotype data of the 697 individuals demonstrated much stronger associations with Q1, Q2, and the disease than did the individuals’ethnicities. In addition, we observed that population structure was a confounding factor for the Q1-gene association when identifying the significant genes both with and without adjusting for the causal single-nucleotide polymorphisms, the ethnicities, and the principal components. Many false discoveries remained after adjusting for the causal single-nucleotide polymorphisms. Adjusting for the principal components appeared more effective than did adjusting for ethnicity in terms of preventing false discoveries. This analysis was performed with knowledge of the causal loci.
Background
The 697 unrelated individuals in the Genetic Analysis Workshop 17 (GAW17) data set were from seven popula-tions [1] (see the file unrelateds.ped). No population struc-ture effect was directly incorporated into the simulation models to generate the three quantitative traits and the disease status. However, it was unclear whether population structure should be a concern for the analysis of this data set. Intuitively, the principal components (PCs) of the gen-otype scores and the reported individual ethnicities may capture different proportions of any overall population structure. We observed substantial additional structures within the populations by PC analyses of the population-specific and overall genotype data among the 697 indivi-duals. We observed ample evidence for Q1–, Q2–, and disease–population structure associations by linear and logistic regression on the individual ethnicities and on the first 10 PCs of the genotype data of all 697 individuals. The PCs showed much stronger associations with the
three phenotypes than did the ethnicities. We investigated confounding of the population structure on the Q1-gene association by contrasting the gene discoveries with and without adjusting for the 39 causal single-nucleotide poly-morphisms (SNPs), ethnicities, and various numbers of PCs. Abundant false discoveries remained even after adjusting for the causal SNPs. In terms of preventing false discoveries, adjusting for the PCs appeared to be more effective than adjusting for ethnicity. In conclusion, it is necessary to adjust for population structure in association studies.
Methods
Interrogating hidden sample structures
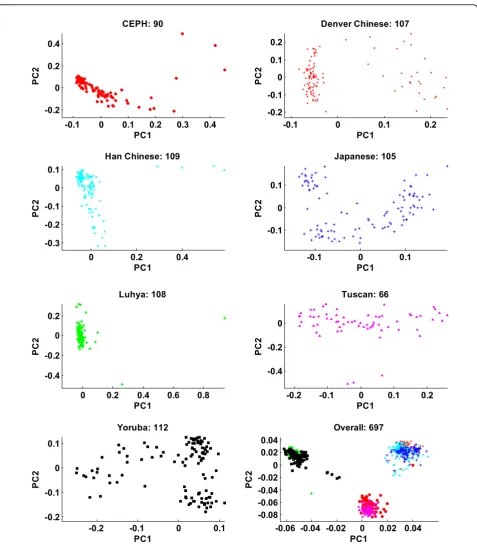
The file unrelateds.ped [1] indicates that the 697 unrelated individuals in the GAW17 data set are from seven popula-tions: Centre d’Etude du Polymorphisme Humain (CEPH)-, Denver Chinese, Han Chinese, Japanese, Luhya, Tuscans, and Yoruba (indexed by 1,…, 7, respectively, from now on). We performed population-specific and whole-sample PC analyses to uncover hidden population structures. For example, for the whole-sample PC analysis (PCA), letG= (gij)n×Mbe the matrix of centered genotype * Correspondence: [email protected]
Case Western Reserve University School of Medicine, Cleveland, OH 44106, USA
scores (n= 697, M= 24,487); that is,g1j+...+gnj= 0 for eachjÎ{1,…,M}. We inspected the eigenvectors ofGG′ to classify individuals.
Uncovering phenotype–population structure associations For individuali, letti= (ti,1,…,ti,10) be the first 10 PCs
computed fromGG′, and letzi= (zi,1,…,zi,6) represent
the 6 ethnicity contrasts defined by the seven populations (PS7);zi,p= 1 ifiis from populationpand 0 otherwise.
Let Sexi, Agei, and Smokei be standardized covariate
scores, and letxi= [1, Sexi, Agei, Agei2, Smokei]. For
each of Q1, Q2, and Q4, we testedg= 0 under the model
yi=xib+zig+εiandδ= 0 under the modelyi=xib+
tiδ+εiwhereyiis the trait value,εiis random noise,b=
(b0,…,b4)′,g= (g1,…,g6)′, andδ= (δ1,…,δ10)′are vec-tors of regression coefficients. For disease, we testedg= 0 under the model logit[Pr(yi= 1)] =xib+zigandδ= 0
under the model logit[Pr(yi= 1)] =xib+tiδ. All the tests
were conducted using the R functions lm(.), glm(.), and anova(.).
Finding Q1-gene association
For individuali, letsi= (si,1,…,si,39) andgi= (gi,1,…,gim)
be the vectors of genotypic scores of the 39 causal SNPs and a testing gene of mSNPs, and let yi be the trait
value. We testedh= 0 under the linear regression mod-elsyi=xib+gih+εi,yi=xib+siθ+gih+εi,yi=xib+
zig+gih+εi, andyi=xib+tiδ+gih+εi, whereθ= (θ1,
…,θ39)′and h= (h1,…, hm)′ are vectors of regression
coefficients. We settito be the first 10, 15, 100, and 200
PCs. All the tests were conducted using the R functions lm(.) and anova(.).
Results
Population structure
To better understand the population structure of the 697 individuals, we first performed a population-specific PCA (Figure 1). Each of the seven populations had a specific within-population structure, as manifested by the first two population-specific PCs. Denver Chinese, Japanese, and Yoruba showed clear structures; Tuscan, CEPH, Han Chinese, and Luhya showed weak struc-tures. The PS7 vector would not be able to capture such subpopulation structures. The PCA of the genotypes of all 697 individuals uncovered additional structures.
Phenotype–population structure associations
Phenotypes Q1, Q2, and the disease demonstrated clear associations with PS7 and demonstrated even stronger associations with the first 10 PCs (Figures 2a, b, d). For example, the Q-Q plot of the Q1-PS7 asso-ciation was outside the 95% confidence band, and the genomic inflation factor of the 200 replicates was
l= − =
the test score for thejth replicate. TheQ-Qplot of the Q1-PC association was even further away from the diagonal, withl= 22.8708. Accordingly, the PCs better captured the population structure of the 697 indivi-duals than did PS7. No clear evidence of Q4– popula-tion structure associapopula-tion was observed: TheQ-Q plots of the Q4-PS7 and Q4-PC associations concentrated around the diagonal (Figure 2c). This result would be consistent with the fact that in the simulation Q4 was not influenced by any of the exonic SNPs.
Q1-gene association
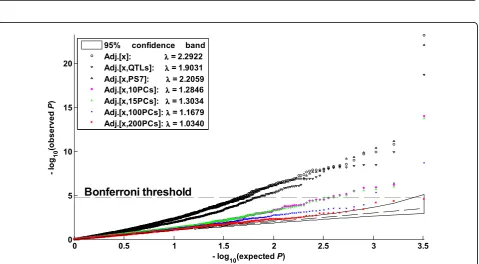
The output of replicate 10 is presented in Figure 3. For each adjustment, we identified as significant those genes withp-values less than 0.05/3,205. In the simulated data for Q1,FLT1andKDRhad the largest effects of all nine causal genes;FLT1consisted of 11 causal SNPs and 24 random SNPs, andKDRconsisted of 10 causal SNPs and 6 random SNPs. We identifiedFLT1andKDRas the two most significant genes with all the adjustments discussed here except for that of 200 PCs. After adjusting for envir-onmental covariates only, we identified 65 false discov-eries, 42 of which remained even after adjusting for the 39 causal SNPs. This observation would explain the apparent Q1–population structure associations. After adjusting for ethnicity and environmental covariates, we identified 57 false discoveries. As anticipated, the number of false discoveries decreased as more PCs were used for adjusting. For example, we identified 8 (2), 7 (2), and 3 (2) significant genes (causal genes) after adjusting for the first 10, 15, and 100 PCs, respectively. However, the sta-tistical power would be reduced if too many PCs were used for adjusting. For example, after adjusting for the first 200 PCs, we did not identify any genes as significant.
Discussion
Using PCA of the 697 unrelated individuals in the GAW17 data set, we uncovered population structures in addition to their ethnicities and found ample evidence by linear and logistic regression analyses of phenotype– population structure associations and population struc-ture confounding with phenotype-gene associations. The first 10 PCs of the genotype matrix of the 697 individuals showed much stronger associations with Q1, Q2, and the disease than did their ethnicities; and the PC adjustments appeared more effective than did the ethnicity adjust-ment in terms of preventing false discoveries. We still need to determine how to choose the optimal number of PCs, and what they are, for use in the adjustment.
2wayIX kernels (see [2-5] for details of LSKMs). All the results (not shown here) were similar to those in Figure 2. One remaining task is to find out why population structure has an effect here, because it was not explicitly
put into the simulation models. Population history deter-mines population structure, and population structure in turn affects the distribution of genotypes. We speculate that in the GAW17 data set the population history of
-0.1 0 0.1 0.2 0.3 0.4
-0.2 0 0.2 0.4
CEPH: 90
PC1
PC
2
-0.1 0 0.1 0.2
-0.2 -0.1 0 0.1 0.2
Denver Chinese: 107
PC1
PC
2
0 0.2 0.4
-0.3 -0.2 -0.1 0 0.1
Han Chinese: 109
PC1
PC2
-0.1 0 0.1
-0.1 0 0.1
Japanese: 105
PC1
PC2
0 0.2 0.4 0.6 0.8
-0.4 -0.2 0 0.2
Luhya: 108
PC1
PC
2
-0.2 -0.1 0 0.1 0.2
-0.4 -0.2 0
Tuscan: 66
PC1
PC
2
-0.2 -0.1 0 0.1
-0.2 -0.1 0 0.1
Yoruba: 112
PC1
PC
2
-0.06 -0.04 -0.02 0 0.02 0.04 -0.08
-0.06 -0.04 -0.02 0 0.02 0.04
Overall: 697
PC1
PC
2
0 0.5 1 1.5 2 95% confidence band PCs: λλλλ = 1.0333
d. Disease-PS association
95% confidence band PCs: λλλλ = 4.1131 PS7: λλλλ = 1.4506Figure 2Q-Qplots of phenotype–population structure associations.In each panel a–d, each point was computed from one of the 200 replicates. Phenotypes Q1, Q2, and the disease demonstrate clear associations with the individual ethnicities and demonstrate even stronger associations with the first 10 principal components. No clear evidence of Q4–population structure (PS) association was observed.
0 0.5 1 1.5 2 2.5 3 3.5
many genes is similar to that of the true causal genes. This supposition could be verified by examining the canonical correlations between the PCs of the causal genes and the whole-sample PCs.
Conclusions
Our analysis discovered that the population structure of the GAW17 unrelated individuals data is an important confounding factor, even though it was not explicitly involved as an independent predictor when simulating the phenotypes. It is thus necessary to adjust for any popula-tion structure, known or unknown, in associapopula-tion studies.
Acknowledgments
The Genetic Analysis Workshop was supported by National Institutes of Health grant R01 GM031575 from the National Institute of General Medical Sciences. This work was supported by National Center for Research Resource grant P41 RR03655, National Cancer Institute grant P30 CAD43703, and National Heart, Lung and Blood Institute grants HL074166, HL086718, and the National Human Genome Research Institute HG003054 and HG005854. We thank the other members in XZ’s lab for their critiques and comments. This article has been published as part ofBMC ProceedingsVolume 5 Supplement 9, 2011: Genetic Analysis Workshop 17. The full contents of the supplement are available online at http://www.biomedcentral.com/1753-6561/5?issue=S9.
Authors’contributions
HQ conceived the project, analyzed the data and wrote the manuscript. RCE and XZ criticized and edited the manuscript. All authors read and approved the final manuscript.
Competing interests
The authors declare that there are no competing interests.
Published: 29 November 2011
References
1. Almasy L, Dyer TD, Peralta JM, Kent JW Jr., Charlesworth JC, Curran JE, Blangero J:Genetic Analysis Workshop 17 mini-exome simulation.BMC Proc2011,5(Suppl 9):S2.
2. Kwee LC, Liu D, Lin X, Ghosh D, Epstein MP:A powerful and flexible multilocus association test for quantitative traits.Am J Hum Genet2008, 82:386-397.
3. Wu MC, Kraft P, Epstein MP, Taylor DM, Chanock SJ, Hunter DJ, Lin X: Powerful SNP-set analysis for case-control genome-wide association studies.Am J Hum Genet2010,86:929-942.
4. Liu D, Lin X, Ghosh D: Semiparametric regression of multidimensional genetic pathway data: least-squares kernel machines and linear mixed models.Biometrics2007,63:1079-1088.
5. Wang X, Qin H, Morris NJ, Zhu X, Elston RC:Testing gene-environment interactions in gene-based association studies.BMC Proc2011,5(Suppl 9):S26.
doi:10.1186/1753-6561-5-S9-S25
Cite this article as:Qinet al.:Interrogating population structure and its impact on association tests.BMC Proceedings20115(Suppl 9):S25.
Submit your next manuscript to BioMed Central and take full advantage of:
• Convenient online submission
• Thorough peer review
• No space constraints or color figure charges
• Immediate publication on acceptance
• Inclusion in PubMed, CAS, Scopus and Google Scholar
• Research which is freely available for redistribution