Proceedings
Comparison between single-marker analysis using Merlin and
multi-marker analysis using LASSO for Framingham simulated
data
Yun Ju Sung*
1,2, Treva K Rice
1,2, Gang Shi
1, C Charles Gu
1,3and DC Rao
1,2,3Addresses:1Division of Biostatistics, Washington University School of Medicine, 660 South Euclid Avenue, Box 8067, St. Louis, Missouri 63110-1093, USA,2Department of Psychiatry, Washington University School of Medicine, 660 South Euclid Avenue, Box 8067, St. Louis, Missouri 63110-1093, USA and3Department of Genetics, Washington University School of Medicine, 660 South Euclid Avenue, Box 8067, St. Louis, Missouri 63110-1093, USA
E-mail: Yun Ju Sung* - [email protected]; Treva K Rice - [email protected]; Gang Shi - [email protected]; C Charles Gu - [email protected]; DC Rao - [email protected]
*Corresponding author
fromGenetic Analysis Workshop 16 St Louis, MO, USA 17-20 September 2009
Published: 15 December 2009
BMC Proceedings2009,3(Suppl 7):S27 doi: 10.1186/1753-6561-3-S7-S27
This article is available from: http://www.biomedcentral.com/1753-6561/3/S7/S27 ©2009 Sung et al; licensee BioMed Central Ltd.
This is an open access article distributed under the terms of the Creative Commons Attribution License (http://creativecommons.org/licenses/by/2.0), which permits unrestricted use, distribution, and reproduction in any medium, provided the original work is properly cited.
Abstract
We compared family-based single-marker association analysis using Merlin and multi-marker analysis using LASSO (least absolute shrinkage and selection operator) for the low-density lipoprotein phenotype at the first visit for all 200 replicates of the Genetic Analysis Workshop 16 Framingham simulated data sets. Using “answers,” we selected single-nucleotide polymorphisms (SNPs) on chromosome 22 for comparison of results between single-marker and multi-marker analyses. For the major causal SNP rs2294207 on chromosome 22, both single-marker and multi-marker analyses provided similar results, indicating the importance of this SNP. For the 12 polygenic SNPs on the same chromosome, both single-marker and multi-marker analyses failed to provide statistically significant associations, indicating that their effects were too weak to be detected by either method. The main difference between the two methods was that for the 14 SNPs near the causal SNPs,p-values from Merlin were the next smallest, whereas LASSO often excluded these non-causal neighboring SNPs entirely from the first 10,000 models.
Background
Association analysis is often performed using single markers or haplotype analysis of multiple single-nucleo-tide polymorphisms (SNPs) within adjoining short regions or candidate genes. However, analysis that simultaneously uses multiple markers may be more
powerful for detecting several causal genes and, hence, may be more appropriate for complex diseases [1].
The least absolute shrinkage and selection operator (LASSO) is a penalized least squares method imposing the L1-penalty on the regression coefficients [2]. Because
this penalty induces shrinkage, prediction using LASSO is more reproducible than the regular multiple linear regression, in the case when there are more predictors than individuals (small n large p). Compared with a regular multiple linear regression (ordinary least squares), LASSO can handle the multicollinearity result-ing from the highly correlated markers. Moreover, due to the nature of the L1-penalty, many regression coefficients are exactly zero. Hence, LASSO does both shrinkage and automatic variable selection simultaneously, a form of parsimonious model selection.
Our main goal in this paper was to explore the performance of LASSO for SNP selection in association analysis. In particular, we compared the relative impor-tance (ranks) of SNPs provided by LASSO to that of SNPs inferred by single-marker analysis.
Methods
Phenotypes and genotypes
We used the low-density lipoprotein (LDL) phenotype at the first visit for all 200 replicates of the Genetic Analysis Workshop 16 (GAW16) Framingham simulated data sets. This phenotype was adjusted for age, smoking, and diet separately for both sexes and then corrected for medication (HMG-CoA reductase inhibitors) [3]. Because the GAW16 data set only contained individuals with genotypes, we created records for untyped parents as founder individuals. Because their actual relationship with other members in the same family ID was not provided, one extended family was often divided into multiple families: 1129 families with size ranging from 1 to 470 became 1920 families with size ranging from 1 to 72. Chromosome 22 included one major causal SNP and 12 polygenic SNPs that influenced the simulated LDL phenotype [4]. To reduce the number of SNPs, we chose 5011 SNPs located between 23.28 Mb and 49.10 Mb, 0.1 Mb in each direction past the left and right influencing SNPs. We excluded SNPs with minor allele frequency (MAF) less than or equal to 0.003 (we wanted to include one polygenic SNP with MAF 0.004). The final data set for analysis consisted of 4589 SNPs and 6857 individuals.
Single-marker analysis using Merlin
For single marker analysis, we used Merlin [5,6]. The family-based association test provided by Merlin has two advantages. First, missing genotypes (1.5% of all genotypes) were imputed, using flanking markers and family relationships, and incorporated in the association test. Second, unlike most family-based linkage and association programs, which do not provide results for data sets with mendelian inconsistent genotypes, the Merlin association test does provide results by ignoring families with mendelian inconsistent genotypes. Even
though this may not be an optimal way to handle genotype errors, it bypasses removing genotype errors, which can be tedious for data sets with large number of SNPs and large families. Linkage disequilibrium (LD) between the major causal SNP and other SNPs (mea-sured byr2) was computed using R package genetics.
Multi-marker analysis using LASSO
For covariate-adjusted phenotypeyiand SNPsxi1,...,xipof
ith
individual, LASSO minimizes (yj j ijx ) j
∑
. The LASSO solution path provides a sequence of models, from the simplest model including only an intercept (when t = 0) to the most complex model including all SNPs as predictors (whent is very large). If a particular SNP becomes a predictor in theithmodel, then that SNP tends to stay as a predictor for all bigger models, but this does not always happen. For ranking SNPs, we used this “entry” number that indicates when a particular SNP becomes a predictor in the LASSO solution path. For our analysis, we evaluated the first 10,000 models in the LASSO solution path, using R package lars [7]. We used Merlin to impute missing SNPs because lars requires each individual to have values for all predictors: removing individuals with partially missing SNPs would make use of only one-tenth of the data. This also makes the data set more consistent with single-marker analysis.Results
Single-marker analysis using Merlin
Figure 1A shows association test results for Replicate 1 of 200 simulated LDL phenotypes: results were consistent across all 200 Replicates (Table 1). The major causal SNP rs2294207 provided statistically significant association with p-value 4.5 × 10⁻¹⁹ for Replicate 1: for all 200 replicates, this SNP ranked 1.1 on average (Table 1) with p-values ranging from 6.9 × 10⁻¹³ to 1.6 × 10⁻²⁹. In Replicate 1, 14 SNPs near the major causal SNP (10 SNPs around 30.91 and 4 SNPs around 30.95) had p-values ranging from 3.0 × 10⁻⁸to 3.8 × 10⁻¹⁹(Figure 1A): these SNPs provided significant association across all 200 replicates (Table 1). Ranks of these neighboring SNPs were almost in the order of LD between them and the causal SNP. Out of 12 polygenic SNPs, the most significantly associated SNP was rs5765113 (p-value 3.5 × 10⁻⁵ ranking 20 for Replicate 1): for all 200 replicates, this SNP ranked 35.8 on average (Table 1) with p-values ranging from 5.7 × 10⁻²to 7.9 × 10⁻⁸.
Multi-marker analysis using LASSO
Figure 1
Association tests of 4589 SNPs on chromosome 22 for Replicate 1 of the simulated LDL phenotype. A,p-values
from single-marker analysis using Merlin; B, entry numbers from multi-marker analysis using LASSO; C, comparison of ranks from Merlin and LASSO (correlation = 0.08). Red dots indicate 1 major causal SNP and 12 polygenic SNPs. Cyan points in A indicate 960 SNPs that were not in any of the first 10,000 models from LASSO.
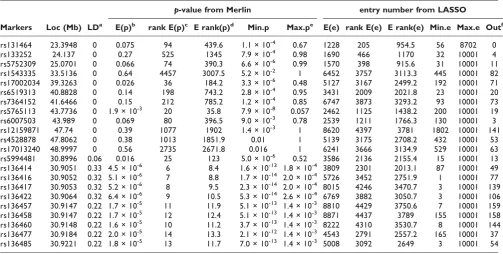
Table 1: Summary statistics, based on Replicates 1 through 200, for 12 polygenic SNPs and SNPs near the major causal SNP rs2294207 (shown in red) in chromosome 22
p-value from Merlin entry number from LASSO
Markers Loc (Mb) LDa E(p)b rank E(p)c E rank(p)d Min.p Max.pe E(e) rank E(e) E rank(e) Min.e Max.e Outf
rs131464 23.3948 0 0.075 94 439.6 1.1 × 10⁻⁴ 0.67 1228 205 954.5 56 8702 0
rs133252 24.137 0 0.27 525 1345 7.9 × 10⁻⁴ 0.98 1690 466 1170 32 10001 4
rs5752309 25.0701 0 0.066 74 390.3 6.6 × 10⁻⁶ 0.99 1570 398 915.6 31 10001 11
rs1543335 33.5136 0 0.64 4457 3007.5 5.2 × 10⁻² 1 6452 3757 3113.3 445 10001 82
rs17002034 39.3263 0 0.026 36 184.2 3.3 × 10⁻⁶ 0.48 5127 3167 2499.2 192 10001 71
rs6519313 40.8828 0 0.14 198 743.2 2.8 × 10⁻⁴ 0.95 3431 2009 2021.8 23 10001 20
rs7364152 41.6466 0 0.15 212 785.2 1.2 × 10⁻⁴ 0.85 6747 3873 3293.2 93 10001 73
rs5765113 43.7736 0 1.9 × 10⁻³ 20 35.8 7.9 × 10⁻⁸ 0.057 2462 1125 1438.2 200 10001 19
rs6007503 43.989 0 0.069 80 396.5 9.0 × 10⁻³ 0.78 2539 1211 1766.3 130 10001 3
rs12159871 47.74 0 0.39 1077 1902 1.4 × 10⁻³ 1 8620 4397 3781 1802 10001 141
rs4528878 47.8062 0 0.38 1013 1851.9 0.01 1 5139 3175 2708.2 432 10001 53
rs17013240 48.9997 0 0.56 2735 2671.8 0.016 1 6241 3666 3134.9 529 10001 63
rs5994481 30.8996 0.06 0.016 25 123 5.0 × 10⁻⁶ 0.52 3586 2136 2155.4 15 10001 13
rs136414 30.9051 0.33 4.5 × 10⁻⁶ 6 8.4 1.6 × 10⁻¹³ 1.8 × 10⁻⁴ 3809 2301 2013.1 87 10001 49
rs136416 30.9052 0.32 5.1 × 10⁻⁶ 7 8.8 1.7 × 10⁻¹⁴ 2.0 × 10⁻⁴ 5726 3452 2751.9 1 10001 77
rs136417 30.9053 0.32 5.2 × 10⁻⁶ 8 9.5 2.3 × 10⁻¹⁴ 2.0 × 10⁻⁴ 8015 4246 3470.7 3 10001 139 rs136422 30.9064 0.32 6.4 × 10⁻⁶ 9 10.5 5.3 × 10⁻¹⁴ 2.6 × 10⁻⁴ 6769 3882 3050.7 3 10001 106 rs136457 30.9147 0.22 1.7 × 10⁻⁵ 11 11.9 5.1 × 10⁻¹³ 1.4 × 10⁻³ 8810 4429 3750.6 7 10001 159 rs136458 30.9147 0.22 1.7 × 10⁻⁵ 12 12.4 5.1 × 10⁻¹³ 1.4 × 10⁻³ 8871 4437 3789 155 10001 158
rs136460 30.9148 0.22 1.6 × 10⁻⁵ 10 11.2 3.7 × 10⁻¹³ 1.4 × 10⁻³ 8222 4310 3530.7 8 10001 144
rs136477 30.9184 0.22 2.0 × 10⁻⁵ 14 13.3 2.1 × 10⁻¹² 1.4 × 10⁻³ 4543 2791 2557.2 165 10001 37 rs136485 30.9221 0.22 1.8 × 10⁻⁵ 13 11.7 7.0 × 10⁻¹³ 1.4 × 10⁻³ 5008 3092 2649 3 10001 54
a
LD, linkage disequilibrium between the major causal SNP and other SNPs (measured byr2).
bE(p), averagedp-value over 200 replications. c
rank E(p), rank of the averagedp-value over 200 replications.
d
E rank(p), averaged rank ofp-values (similarly for entry number).
e
Max.e, 10001 if the SNP was not in any of the first 10000 models.
f
solution path, which happened in 114 out of 200 replicates. In 84 out of the remaining 86 replicates, one of three nearby SNPs entered first: rs8137034 (42 times), rs2294208 (34 times), and rs5998330 (8 times). Ranks of these four SNPs including the major causal SNP were 5.3, 57.2, 334.1, 1174 on average for 200 replicates (Table 1). Because these nearby SNPs were highly correlated with the causal SNP, once they were included as predictors the causal SNP became a predictor much later (with average rank 5.3). In contrast to single-marker analysis in which the top 15 SNPs with smallestp-values were all near the major causal SNP, only 3 SNPs out of these top 15 SNPs were near the major causal SNP and the remaining 12 SNPs were more or less uniformly located (Figure 1B). For Replicate 1 (Figure 1A), 960 SNPs that were excluded from the LASSO analysis (cyan points) included these neighboring SNPs. This was consistent across all 200 replicates: all 14 neighboring SNPs were sometimes excluded from the LASSO solution path. For example, SNP rs136457 was excluded from the LASSO path in 159 out of 200 replicates even though its average rank from single-marker analysis was 11.9 (Table 1). Overall, we have not found much consistency between ranks from Merlin and those from LASSO (correlation = 0.07 across all 200 replicates and correlation = 0.08 in replicate 1, shown in Figure 1C).
Conclusion
In this paper, we applied single-marker analysis using Merlin and multi-marker analysis using LASSO to the simulated LDL phenotype data on chromosome 22. Single-marker analysis using Merlin correctly provided statistically significant association of the major causal SNP rs2294207 withp-value less than 6.9 × 10⁻¹³for all 200 replicates. Multi-marker analysis using LASSO also included this causal SNP as the first predictor in 114 out of 200 replicates, indicating the importance of this SNP. When the causal SNP was not included as the first predictor, one of its three neighboring SNPs was included as the first predictor. Merlin declared statisti-cally significant 14 non-causal neighboring SNPs, whereas the first 10,000 models in the LASSO solution paths often excluded these 14 SNPs. The 12 polygenic SNPs were less statistically significant than these neighboring 14 SNPs by both Merlin and LASSO analyses, indicating that their effects were too small to be detected. Overall, there was little consistency between the rank orders of the 4589 SNPs provided by Merlin and LASSO.
Our results indicate that Merlin and LASSO analyses provide different results. We observe that LASSO typically included 3 SNPs near the causal SNPs out of the 15 SNPs that showed very strong association from
Merlin and excluded the remaining SNPs from the LASSO path (up to the first 10,000 models). This may be useful because these neighboring SNPs are not causal. We expected that LASSO would provide better results for the 12 polygenic SNPs. However, this may not have occurred because the strength of their effects was much smaller than the effect of the major causal SNP; thus, for this data set the phenotype appears to be influenced by a single SNP, in which case single-marker analysis will perform better than multi-marker analysis. Hence, our results are inconclusive in terms whether the LASSO analysis provides additional information.
The relative advantage of multi-marker analyses over single-marker will depend on the underlying disease model. Other penalized least-squares methods may provide results more similar to single-marker analysis than LASSO. Ridge regression (penalized regression with L2 penalty) shrinks the coefficients of correlated pre-dictors toward each other, so they borrow strength from each other. In the extreme case ofkidentical predictors, they each get identical coefficients with 1/kththe size that any single one would get if fit alone. On the other hand, LASSO (with L1 penalty) is somewhat indifferent to very correlated predictors and will tend to pick one and ignore the rest. The elastic net regression (penalized regression with a convex combination of both penalties) can have the advantages of both ridge and LASSO [8]. We suspect that LASSO may provide better inference for diseases with multiple causal SNPs that are not in LD. For other cases (i.e., diseases with multiple causal SNPs in LD), ridge, elastic net, or haplotype analysis may provide better inference. Further investigation is needed.
List of abbreviations used
GAW16: Genetic Analysis Workshop 16; LASSO: Least absolute shrinkage and selection operator; LD: Linkage disequilibrium; LDL: Low-density lipoprotein; MAF: Minor allele frequency; SNP: Single-nucleotide poly-morphism.
Competing interests
The authors declare that they have no competing interests.
Authors
’
contributions
and revised the manuscript. All authors read and approved the final manuscript.
Acknowledgements
We thank two anonymous reviewers for their constructive and insightful comments on improving the manuscript. The work was sponsored by GM28719 from the National Institute of General Medical Sciences and also by HL54473, HL45670, HL72507, and HL86694 from the National Institutes of Health. The Genetic Analysis Workshops are supported by NIH grant R01 GM031575 from the National Institute of General Medical Sciences.
This article has been published as part of BMC Proceedings Volume 3 Supplement 7, 2009: Genetic Analysis Workshop 16. The full contents of the supplement are available online at http://www.biomedcentral.com/ 1753-6561/3?issue=S7.
References
1. Malo N, Libiger O and Schork NJ: Accommodating linkage disequilibrium in genetic-association analyses via ridge regression.Am J Hum Genet2008,82:375–385.
2. Tibshirani R:Regression shrinkage and selection via the Lasso.
J Roy Stat Soc Ser B1996,58:267–288.
3. Rice T, Sung YJ, Shi G, Gu C and Rao DC: Genome-wide association analysis of Framingham Heart Study data for the Genetic Analysis Workshop 16: effects due to medication use.BMC Proc2009,3(suppl 7):S52.
4. Kraja AT, Culverhouse R, Daw EW, Wu J, Van Brunt A, Province MA and Borecki IB:The Genetic Analysis Workshop 16 Problem 3: simulation of heritable longitudinal cardio-vascular phenotypes based on actual genome-wide single-nucleotide polymorphisms in the Framingham Heart Study.
BMC Proc2009,3(suppl 7):S4.
5. Abecasis GR, Cherny SS, Cookson WO and Cardon LR: Merlin-rapid analysis of dense genetic maps using sparse gene flow trees.Nat Genet2002,30:97–101.
6. Chen WM and Abecasis GR:Family-based association tests for genomewide association scans. Am J Hum Genet 2007,
81:913–926.
7. Efron B, Hastie T, Johnstone I and Tibshirani R: Least angle regression.Ann Stat2004,32:407–499.
8. Zou H and Hastie T:Regularization and variable selection via the elastic net.J R Statist Soc B2005,67:301–320.
Publish with BioMed Central and every scientist can read your work free of charge
"BioMed Central will be the most significant development for disseminating the results of biomedical researc h in our lifetime."
Sir Paul Nurse, Cancer Research UK
Your research papers will be:
available free of charge to the entire biomedical community
peer reviewed and published immediately upon acceptance
cited in PubMed and archived on PubMed Central
yours — you keep the copyright