Comparative Analysis of Clustering by using
Optimization Algorithms
Poonam Kataria1, Navpreet Rupal 2, Rahul Sharma3
1 & 2 Department of CSE, SUSCET, Tangori, Distt.Mohali, Punjab ,India 3Department of Information Technology, GNDEC, Ludhiana
Abstract — Data-Mining (DM) has become one of the most valuable tools for extracting and manipulating data and for establishing patterns in order to produce useful information for decision-making. Clustering is a data mining technique for finding important patterns in unorganized and huge data collections. This likelihood approach of clustering technique is quite often used by many researchers for classifications due to its’ being simple and easy to implement. In this work, we first use the Expectation-Maximization (EM) algorithm for sampling on the medical data obtained from Pima Indian Diabetes (PID) data set. This work is also based on comparative study of GA, ACO & PSO based Data Clustering methods. To Compare the results we use different metrics such as weighted arithmetic mean, standard deviation, Normalized absolute error & Precision value that measured the performance to compare and analyze the results. The results prove that the accuracy generated by using particle swarm optimization is more as compare to other optimization algorithms named as genetic algorithm and ant colony optimization algorithm in classification process. So, this work shows that the particle swarm optimization techniques results as the best optimization technique to handle the process.
Keywords— Data Mining; Clustering; EM; GA; ACO; PSO
I. INTRODUCTION
As with time data mining becomes most valuable tool for extraction and manipulation of data and also helps to provide useful information based on which decisions are taken. Most of the system fails because they don’t have the right tools which tackle most of the uncertainties. The industrial persons use these data mining tools to create more values from their system by optimizing the processes. Data mining becoming a powerful tool which evaluates and provides the best results or decisions based on the previous records. Data mining becomes the demand of the companies with strong consumer focus like finance, retail, communication and marketing. By using this retailer uses records related to customer purchases based on their history which helps in developing the products and promote them according to specific customers.
Data mining refers to as a field which deals with the search and research on the data. Mining is a term which means fetching or extraction of data from a large data set or we called as a huge data repositories. Data mining basically categorized into two types Classification and Clustering. Both terms are different in nature from each other. In Classification there is a set of predefined classes and then find out the objects belongs to which class whereas in
clustering firstly groups of objects can be prepared and then find out whether they relate with each other or not.
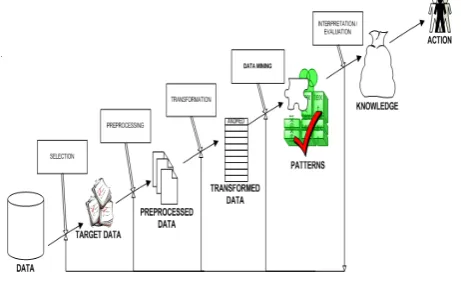
Data mining is the step in the process of knowledge discovery in the databases which inputs the cleaned data, transform it, search the data by using some algorithms and produce the output patterns. It is also the relationship to the evaluation steps of the whole knowledge discovery in the databases process. Data mining is a new discipline lying at the interface of statistics, pattern recognition, database technology, machine learning and other areas. Figure 1 shows the whole process of data mining.
Figure 1: Process of Data Mining
II. PROPOSED METHODOLOGY
It has been already explained that the data-mining (DM) has become one of the most valuable tools for extracting and manipulating data and for establishing patterns in order to produce useful information for decision-making. Classification is the supervised learning technique of data mining which is used to extract hidden useful knowledge over a large volume of databases by predicting the class values based on the predicting attribute values.
A Number of Techniques were used for classification process like probabilistic model, decision tree and evolutionary algorithms. Clustering is a data mining technique for finding important patterns in unorganized and huge data collections. This likelihood approach of clustering technique is quite often used by many researchers for classifications due to its’ being simple and easy to implement. It uses Expectation-Maximization (EM) algorithm for sampling.
The study of classification of diabetic patients was main focus of this research work. Medical data for Diabetic patients were classified by data mining techniques. The first problem is study of classification based on three techniques of EM Algorithm, h-means+ clustering and Genetic Algorithm (GA) and then enhancement will be made by using Particle Swarm Optimization (PSO) instead of GA. In the proposed work, comparison is done for the classification process by using GA, PSO and ACO algorithms. The performance is measured on the basis of mean, standard deviation and normalized absolute error (NAE). The purpose of work is to enhance the classification process and to compare it with the previous implemented results.
• To enhance the classification process using Artificial Intelligence based Technique Particle Swarm Optimization.
• To Implement PSO for the same purpose and to optimize the results.
• Comparison of results with the GA and ACO.
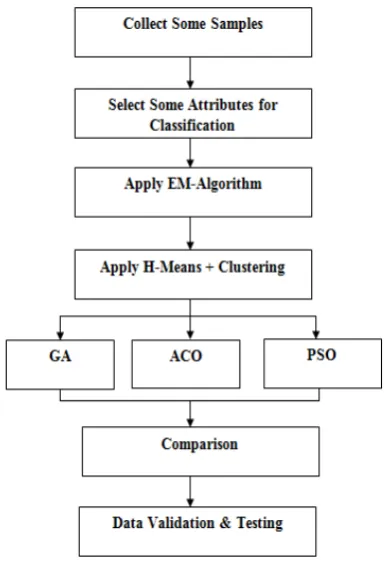
The proposed model focuses on the above objectives which are helpful in improving the classification parameters and are practically implemented using MATLAB 7.11.0 environment. In this proposed work, we used Particle Swarm Optimization algorithm to enhance the classification process. This algorithm provides better results as compare to previous techniques. The data set chosen for the experimental simulation test were obtained from the UCI Repository of Machine Learning Databases. Pima Indian population was chosen as target patients. There has been extensive research on diabetes among Pima Indians. For processing data for patients’ classification, some of the related and important parametric attributes are chosen. These attributes are considered to be strongly correlated with the diabetes. The work is proposed to be completed in following stages which have to be preceded in parallel fashion, as described below in Figure 2:
Figure 2: Basic Design of the System
2.1 Database used for mining • Samples
The data set chosen for the experimental simulation test were obtained from the UCI Repository of Machine Learning Databases. Pima Indian population was chosen as target patients. There has been extensive research on diabetes among Pima Indians.
• Attributes
For processing data for patients’ classification, some of the related and important parametric attributes are chosen. These attributes are considered to be strongly correlated with the diabetes.
Table 1: Tested Attributes
Att.
No. Testing Attribute Symbols 1 Plasma Glucose tolerance test at 2 hrs Plas
2 Diastolic blood pressure (mm Hg) Pres 3 Triceps skin fold thickness (mm) Skin 4 2-Hour serum insulin (mu U/ml) Insu
5 Body mass index Mass
6 Diabetes pedigree function Pedi
III.CLUSTERING BY USING EXPECTATION
MAXIMIZATION ALGORITHM
An expectation–maximization (EM) algorithm is an iterative method for finding maximum likelihood or maximum posteriori (MAP) estimates of parameters in statistical models where the model depends on unobserved latent variables. EM iteration alternates between performing an expectation (E) step which creates a function for the expectation of the log-likelihood evaluated using the current estimate for the parameters and maximization (M) step which computes parameters maximizing the expected log-likelihood found on the E step. The parameter-estimates are then used to determine the distribution of the latent variables in the next E step.The EM algorithm proceeds from the observation that the following is a way to solve these two sets of equations. One can simply pick arbitrary values for one of the two sets of unknowns use them to estimate the second set then use these new values to find a better estimate of the first set and then keep alternating between the two until the resulting values both converge to fixed points. It is not obvious that this will work at all but in fact it can be proven that in this particular context it does and that the derivative of the likelihood is (arbitrarily close to) zero at that point which in turn means that the point is either a maximum or a saddle point. In general there may be multiple maxima and no guarantee that the global maximum will be found. Some likelihood also has singularities in them i.e. nonsensical maxima. Example is, one of the "solutions" that may be found by EM in a mixture model involves setting one of the components to have zero variance and the mean parameter
for the same component to be equal to one of the data points.
This EM algorithm consists of two steps. The first step is determination of expectation and the second step is to maximization expectation in successive iteration cycles. The expectation involves choosing of a model and then it estimates missing labels [13]. The maximization step involves choosing labels and then mapping of suitable models to labels so that it maximizes the expected log-likelihood of the data. The execution sequence may be listed in 3 steps.
Step 1: The expectation step that determines mean value, denoted by μ and infers the values of ‘a’ and ‘b’ such that a = (0.5) / (0.5 + μ) * h. and b = (μ / 0.5 + μ) * h with conditions of a / b = 0.5 / μ and h = a + b.
Step 2: The maximization step that determines fractions of a and b and then computes the maximum likelihood of μ at first.
Step 3: It involves repeating of steps 1 and 2 for next cycle.
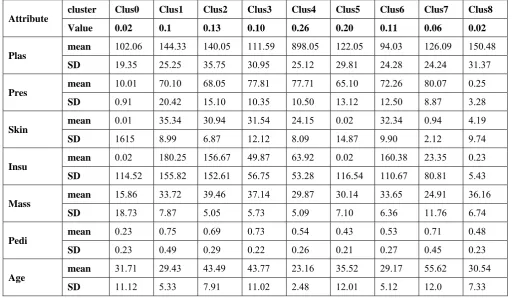
Table 2 shows clusters formed by EM algorithm. Here, 7 attributes with 768 instances, were tested for mean and standard deviation for 8 different clusters. For this, the data sets used were a mixture of PID data and data collected from other local hospitals.
Table 2: Clusters Formed for EM Algorithm
Attribute cluster Clus0 Clus1 Clus2 Clus3 Clus4 Clus5 Clus6 Clus7 Clus8 Value 0.02 0.1 0.13 0.10 0.26 0.20 0.11 0.06 0.02
Plas mean 102.06 144.33 140.05 111.59 898.05 122.05 94.03 126.09 150.48
SD 19.35 25.25 35.75 30.95 25.12 29.81 24.28 24.24 31.37
Pres mean 10.01 70.10 68.05 77.81 77.71 65.10 72.26 80.07 0.25
SD 0.91 20.42 15.10 10.35 10.50 13.12 12.50 8.87 3.28
Skin mean
0.01 35.34 30.94 31.54 24.15 0.02 32.34 0.94 4.19
SD 1615 8.99 6.87 12.12 8.09 14.87 9.90 2.12 9.74
Insu mean 0.02 180.25 156.67 49.87 63.92 0.02 160.38 23.35 0.23 SD 114.52 155.82 152.61 56.75 53.28 116.54 110.67 80.81 5.43
Mass mean 15.86 33.72 39.46 37.14 29.87 30.14 33.65 24.91 36.16
SD 18.73 7.87 5.05 5.73 5.09 7.10 6.36 11.76 6.74
Pedi mean 0.23 0.75 0.69 0.73 0.54 0.43 0.53 0.71 0.48
SD 0.23 0.49 0.29 0.22 0.26 0.21 0.27 0.45 0.23
Age mean 31.71 29.43 43.49 43.77 23.16 35.52 29.17 55.62 30.54
IV.OPTIMIZATION BASED CLUSTERING
This work deals with the implementation of the clustering by using different optimization algorithms that are Genetic Algorithm, Ant Colony Optimization Algorithm and Particle Swarm Optimization Algorithms then we compare the results of clustering and find the best optimization algorithm with high percentage of accuracy.
4.1 Genetic Algorithm
Genetic algorithms can be considered as a search technique whose algorithm is based on the mechanics of natural selection and genetics. It has been used in realms as diverse as search optimization and machine learning problems since they are not restricted by problem specific assumptions such as continuity or unimodality. In rough terms a genetic algorithm creates a collection of possible solutions to a specific problem. Initially the solutions are typically randomly generated solutions so their initial performance is normally poor. No matters how bad, there will be small segments of our collection of solutions that will be nearby our desired solution that is partially correct answers. Genetic Algorithms exploit this characteristic by recombination and progressively creating better solutions so that by the end of the run one have achieved one solution that is at least nearly optimal.
The flow steps of genetic algorithm for finding a solution of a given problem may be summarised as follows.
Step 1: Initialize population for possible solution
Step 2: Generate chromosomes of a population with 0’s and 1’s randomly
Step 3: If the solution is satisfied then terminate else jump to next step
Step 4: Compute population fitness value Step 5: Initialize number of generation
Step 6: While number of generation * 2 ≤ termination condition; do
Step 7: Select all the genetic solutions which can propagate to next generation
Step 8: Increment number of generation Step 9: Identify each bit in genetic solution
Step 10: Perform crossover operation up to until 50% of bits are crossed
Step 11: end while
Step 12: if the solution is efficient then terminate else perform mutation operation up to 0.05%
A genetic algorithm searches best solution within a collection of large number of solutions of a problem being solved. Figure 3 shows the cluster forming by using Genetic Algorithm.
Figure 3: GA Clustering
4.2 Ant Colony Optimization
ACO algorithm was inspired by the behavior of ant colonies. Ants are social insects being interested mainly in the colony survival rather than individual survival. The interest of ants is the ability to find the shortest path from their nest to food. This idea was the source of the proposed algorithms inspired from ants’ behavior. When searching for food ants initially explore the area surrounding their nest in a random manner and then while ants move it may leave a chemical pheromone trail on the ground. These ants are guided by pheromone smell. It tend to choose the paths marked by the strongest pheromone concentration .When an ant finds a food source then it evaluates the quantity and the quality of the food and carries some of it back to the nest. While ants returns the quantity of pheromone that an ant leaves on the ground may depend on the quantity and quality of the food. This pheromone trails will guide other ants to the food source. This type of indirect communication between the ants via pheromone trails enables them to find shortest paths between their nest and food sources. Figure 4 shows the cluster forming by using Ant Colony Optimization Algorithm.
Figure 4: ACO Clustering 4.3 Particle Swarm Optimization
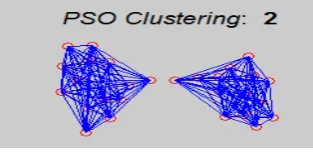
PSO is an efficient and effective global optimization algorithm which has been widely applied to nonlinear function optimization neural network training and pattern recognition. In PSO a swarm consists of N particles moving around in D dimensional search space. Position of the ith particle at the iteration is represented by X(t) i=(xi1,xi2,...,xiD) that are used to evaluate the quality of the particle. During the search process the particle successively adjusts its position toward the global optimum according to the two factors: the best position encountered by itself is denoted by Pi=(pi1,pi2,...,piD) and the best position encountered by the whole swarm (gbest) denoted as Pg=(pg1,pg2,...,pgD). Its velocity at the t th iteration is represented by V(t)i=(vi1,vi2,...,viD). The position at next iteration is calculated according to the equations. If an element of velocities exceeds the threshold or , it is set equal to the corresponding threshold. PSO learns from the scenario and uses it to solve the optimization problems. Figure 5 shows the cluster forming by using Particle Swarm Optimization Algorithm.
V. RESULTS ANALYSIS BASED ON PARAMETERS
In the proposed work, comparison is done for the classification process by using GA, PSO and ACO algorithms. The performance is measured on the basis of mean, standard deviation and normalized absolute error (NAE).
Arithmetic Mean is calculated to measure the central tendency of data. The most common and effective numeric measure of the “center” of the data is arithmetic mean. Figure 6 shows the calculated weighted arithmetic mean values by using three optimization algorithms Genetic, Ant Colony Optimization and Particle Swarm Optimization Algorithm respectively. Central tendency defines the tendency of quantitative data to cluster around some central value. It helps to judge whether data has a strong or a weak central tendency.
Figure 6: Weighted Arithmetic Mean
The standard deviation (σ) shows how much variation or dispersion from the average exists. The low standard deviation indicates that the data points tend to be very close to the mean (also called expected value); a high standard deviation indicates that the data points are spread out over a large range of values. Standard Deviation is calculated to measure the dispersion of data. Figure 7 shows the calculated standard deviation values by using three optimization algorithms Genetic, Ant Colony Optimization and Particle Swarm Optimization Algorithm respectively.
Figure 7: Standard Deviation
Normalization is the process of isolating statistical error in repeated measured data. Normalization is sometimes based on a property. The Quintile normalization for instance is normalization based on the magnitude (quintile) of the
measures. In another usage in statistics the normalization refers to the division of multiple sets of data by a common variable in order to negate that variable's effect on the data thus allowing underlying characteristics of the data sets to be compared: this allows data on different scales to be compared by bringing them to a common scale. These ratios only make sense for ratio measurements in terms of levels of measurement.
= , − ′, ,
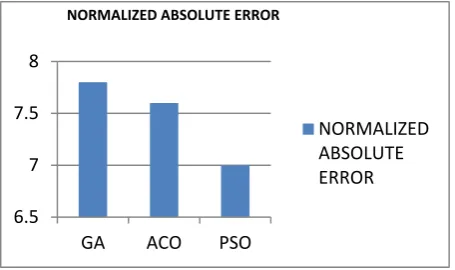
Figure 8 shows the calculated normalized absolute error values by using three optimization algorithms Genetic Algorithm, Ant Colony Optimization and Particle Swarm Optimization Algorithm respectively.
Figure 8: Normalized Absolute Error
Figure 9 defines percentage of precision using genetic, Ant Colony and Paticle Swarm Optimization Algorithms. In the graph shown below, x-axis represents the ‘number of person’ having database be selected and y-axis represents the percentage accuracy. At some point of time GA has a constant precision value while dataset value has been increased. This means GA doesn’t give the good results with large datasets. At some point of time ACO has 100% accuracy but it has decreased while dataset value has been increased. This means ACO doesn’t give the good results with large datasets. But PSO has high accuracy with large datasets. This means PSO give the good results with large datasets.
Figure 9: Precision Graph 38
39 40 41 42 43
GA ACO PSO
WEIGHTED ARITHMETIC MEAN
WEIGHTED ARITHMETIC MEAN
0 0.2 0.4 0.6 0.8
GA ACO PSO
STANDARD DEVIATION
STANDARD DEVIATION
6.5 7 7.5 8
GA ACO PSO
NORMALIZED ABSOLUTE ERROR
VI.CONCLUSION &FUTURE WORK
A result from a comparative study of GA, ACO & PSO based Data classification method is presented. The method uses different metrics such as weighted arithmetic mean, standard deviation, Normalized absolute error & Precision value that measured the performance to compare and analyze the results. To evaluate the comparisons of performance of classification techniques is the difficult task unless same performance measures are used. The aim of classification is to achieve better classification using data set of diabetic patients for detection of diabetes. The proposed method is implemented using UCI Repository of Machine Learning Databases.
The results prove that the accuracy generated by using particle swarm optimization is more as compare to other optimization algorithms named as genetic algorithm and ant colony optimization algorithm in classification process. So, this work shows that the particle swarm optimization techniques results as the best optimization technique to handle the classification process.
In the present work we have implemented the PSO based classification quite successfully using UCI Repository of Machine Learning Databases. Still there is some hope of improvement. If we can use more than two optimization algorithms together with large data sets for the classification, the results could have been better as compare to single optimization algorithm. So, future work could go on the direction of hybrid systems using more than one algorithm together.
REFERENCES
[1] Lyman, P., and Hal R. Varian, "How much storage is enough?" Storage, 1:4 (2003).
[2] Way, Jay, and E. A. Smith,"Evolution of Synthetic Aperture Radar Systems and Their Progression to the EOS SAR," IEEE Trans. Geoscience and Remote Sensing, 29:6 (1991), pp. 962-985.
[3] Usama, M. Fayyad, "Data-Mining and Knowledge Discovery: Making Sense Out of Data," Microsoft Research IEEE Expert, 11:5. (1996), pp. 20-25.
[4] Berson, A., K. Thearling, and J. Stephen, Building Data Mining Applications for CRM, USA, McGraw-Hill (1999).
[5] Berry, Michael J. A. et al., Data-Mining Techniques for Marketing, Sales and Customer Support. U.S.A: John Wiley and Sons (1997). [6] Weiss, Sholom M. et al., Predictive Data-Mining: A Practical Guide.
San Francisco, Morgan Kaufmann (1998).
[7] Giudici, P., Applied Data-Mining: Statistical Methods for Business and Industry. West Sussex, England: John Wiley and Sons (2003). [8] A.K. JAIN,M.N. MURTY AND P.J. FLYNN, “Data Clustering”,
ACM Computing Surveys, Vol.31, No. 3, September 1999.
[9] Enrico Minack, Gianluca Demartini, and Wolfgang Nejdl, “Current Approaches to Search Result Diversitication”,L3S Research Center, Leibniz Universität Hannover, 30167 Hannover, Germany.
[10] Basheer M. Al-Maqaleh and Hamid Shahbazkia, “A Genetic Algorithm for Discovering Classification Rules in Data Mining” International Journal of Computer Applications (0975 – 8887), Volume 41– No.18, March 2012.
[11] Vivekanandan , P., Dr. R. Nedunchezhian, “A New Incremental Genetic Algorithm Based Classification Model to Mine Data with Concept Drift” Journal of Theoretical and Applied Information Technology.
[12] Andy Tsai, William M. Wells, Simon K. Warfield, and Alan S. Willsky, “An EM algorithm for shape classification based on level sets” Medical Image Analysis, Elsevier, pp. 491-502.
[13] Kamal Nigam, Andrew Kachites Mccallum, Sebastian Thrun, and Tom Mitchell, “Text Classification from Labeled and Unlabeled Documents using EM” Machine Learning, pp. 1-34.
[14]Bhanumathi, S., and Sakthivel., “A New Model for Privacy Preserving Multiparty Collaborative Data Mining”, 2013 International Conference on Circuits, Power and Computing Technologies [ICCPCT-2013].
[15] Ciubancan, Mihai., et al., “Data Mining preprocessing using GRID technologies”, 2013 11th Roedunet International Conference (RoEduNet), pp. 1-3.
[16]Velu, C.M., and Kashwan, K.R., “Visual Data Mining Techniques for Classification of Diabetic Patients”, 3rd International Advance Computing Conference (IACC), pp. 1070-1075, 2013 IEEE. [17] Ming-Hsien Hiesh; Lam, Y.-Y.A. ; Chia-Ping Shen ; and Wei Chen,
“Classification of schizophrenia using Genetic Algorithm-Support Vector Machine (GA-SVM)” 2013 35th Annual International Conference of the IEEE Engineering in Medicine and Biology Society (EMBC), pp. 6047 – 6050.
[18] Feng-Seng Lin ; Chia-Ping Shen ; Hsiao-Ya Sung ; and Yan-Yu Lam, “A High performance cloud computing platform for mRNA analysis” 2013 35th Annual International Conference of the IEEE Engineering in Medicine and Biology Society (EMBC), pp. 1510-1513.
[19] Saraswathi, S. ; Mahanand, B.S. ; Kloczkowski, A. ; and Suresh, S., “Detection of onset of Alzheimer's disease from MRI images using a GA-ELM-PSO classifier” 2013 IEEE Fourth International Workshop on Computational Intelligence in Medical Imaging (CIMI), pp. 42-48.
[20] Relan, D. ; MacGillivray, T. ; Ballerini, L. ; and Trucco, E., “Retinal vessel classification: Sorting arteries and veins” 2013 35th Annual International Conference of the IEEE Engineering in Medicine and Biology Society (EMBC), pp. 7396-7399.
[21] Samdin, S.B. ; Chee-Ming Ting ; Salleh, S.-H. ; and Ariff, A.K., “Linear dynamic models for classification of single-trial EEG” 2013 35th Annual International Conference of the IEEE Engineering in Medicine and Biology Society (EMBC), pp. 4827-4830.
[22] Vargas Cardona, H.D.; Orozco, A.A. ; and Alvarez, M.A., “Unsupervised learning applied in MER and ECG signals through Gaussians mixtures with the Expectation-Maximization algorithm and Variational Bayesian Inference” 2013 35th Annual
International Conference of the IEEE Engineering in Medicine and
Biology Society (EMBC), pp. 4326-4329.
[23] Keshavamurthy B. N, Asad Mohammed Khan & Durga Toshniwal, “Improved Genetic Algorithm Based Classification” International Journal of Computer Science and Informatics (IJCSI), Volume-1, Issue-3.