Copyright1999 by the Genetics Society of America
A Method for Estimating Nucleotide Diversity From AFLP Data
Hideki Innan,* Ryohei Terauchi,
†Gu
¨nter Kahl
†and Fumio Tajima*
*Department of Biological Sciences, Graduate School of Science, The University of Tokyo, Hongo 7-3-1, Tokyo 113-0033, Japan and †Plant Molecular Biology, Biocenter, University of Frankfurt, D-60439 Frankfurt am Main, Germany
Manuscript received July 16, 1998 Accepted for publication November 12, 1998
ABSTRACT
A method for estimating the nucleotide diversity from AFLP data is developed by using the relationship between the number of nucleotide changes and the proportion of shared bands. The estimation equation is based on the assumption that GC-content is 0.5. Computer simulations, however, show that this method gives a reasonably accurate estimate even when GC-content deviates from 0.5, as long as the number of nucleotide changes per site (nucleotide diversity) is small. As an example, the nucleotide diversity of the wild yam, Dioscorea tokoro, was estimated. The estimated nucleotide diversity is 0.0055, which is larger than estimations from nucleotide sequence data for Adh and Pgi.
T
HE amplified fragment length polymorphism ate a distance matrix, and further to reconstruct phylo-genetic trees, although they do not increase linearly (AFLP) technique, developed byVoset al. (1995),is a powerful tool for DNA fingerprinting of organismal with divergence time. To our knowledge, no attempt has been made to date to use AFLP data for estimating genomes. In principle, it is a combination of RFLP and
PCR techniques. Briefly, DNA is digested with two re- the number of nucleotide changes per site between the striction enzymes (EcoRI and MseI in the original proto- genomes of two individuals.
col), and double-stranded oligonucleotide adapters are Here, we report the application of the AFLP technique ligated to the restriction sites. PCR primers complemen- for estimating the nucleotide diversity (p), defined as tary to the adapters and restriction sites are used for the average number of pairwise nucleotide changes per the amplification of fragments that are flanked by the site (NeiandLi1979). To date, methods are available adapters. A subset of fragments is selectively amplified for estimating nucleotide diversity from DNA sequence by PCR primers that have 2- or 3-base extensions into (Nei and Tajima 1981; Tajima and Nei1984), RFLP the restriction fragments. Only those fragments that data (Nei and Li 1979; Nei and Tajima 1981), and perfectly match the primer sequences can be amplified RAPD data (ClarkandLanigan 1993), but not from by PCR. Therefore the complexity of PCR amplicons is AFLP data. The method for estimating the nucleotide reduced. In fact, DNA fingerprints consisting of 50 to diversity from AFLP data, reported here for the first 100 restriction fragments can be detected after separa- time, might be generally useful for genetic diversity tion in a denaturing polyacrylamide gel. Relative ease studies.
of implementation, large number of polymorphisms de-tected per gel, small amount of genomic DNA required,
ESTIMATION METHOD
and high reproducibility of DNA fingerprint patterns recommend AFLP as an attractive method to study DNA
For estimation of the nucleotide diversity from AFLP polymorphism in general.
data, we consider a random nucleotide sequence under Although AFLP has been increasingly applied to
link-the Jukes and Cantor model (JukesandCantor1969), age mapping of genomes in various organisms (Thomas
where the frequencies of four bases (G, A, T, and C) et al. 1995;Maheswaranet al. 1997), its application to
are equal (0.25). Following Nei and Li (1979) and population genetics and evolution is still limited (Hill
Clark and Lanigan (1993), we assume that changes
et al. 1996;Maughamet al. 1996;Sharmaet al. 1996). In
in DNA sequence are caused only by the nucleotide relevant studies, AFLP patterns were compared between
changes and we ignore the effect of other factors such as individuals, and their similarity was described by the
insertion and deletion. We denote the rate of nucleotide similarity index (percentage of shared fragments among
change per site per generation by m. We consider a the total fragments). These indices were used to
gener-model for a haploid genome here, although the AFLP technique is usually applied to diploid species. An appli-cation to a diploid genome is presented in the next Corresponding author: Fumio Tajima, Department of Biological Sci- section.
ences, Graduate School of Science, The University of Tokyo, Hongo
The nucleotide diversity (p) in a sample of n haploid
7-3-1, Bunkyo-ku, Tokyo 113-0033, Japan.
E-mail: [email protected] individuals can be estimated by averaging the estimated
numbers of nucleotide changes (d) over all the pairs in and L 2 4 1 1 possible 4-bp sequences. Then, using p91, p92, b1, and b2, we have Q1(L) and Q2(L), which are
the sample. Namely,pcan be estimated by
approximately given by
pˆ 5 2
n(n2 1)
o
i,jdˆij, (1)
Q1(L)5 p912(12 b1)L2611(12b2)L2411, (4)
and where dˆijis the estimated number of nucleotide changes
between the ith and jth haploid individuals. Note that Q2(L)5p91p92(12 b1)L2611(1 2b
2)L2411. (5)
the estimated value is presented with a circumflex.
Equations 4 and 5 are approximates because the events First, we consider the probability that a fragment is
during which a new restriction site appears are consid-conserved by time t. If we follow the original protocol,
ered to be independent for all the 6- or 4-bp sequences. in the AFLP technique, we have three classes of PCR
Apparently, these events are not independent. For ex-products: those flanked by EcoRI-adapters in both sides,
ample, if a new EcoRI site forms in a 6-bp sequence, say those flanked by EcoRI- and MseI-adapters, and those
the sequence between nucleotide positions x and x 1 flanked by MseI-adapters in both sides. As only
EcoRI-5 (x is the nucleotide position number from the EcoRI-59end primers are labeled, the first and second classes of
frag-of the fragment), a new EcoRI site never forms in the ments are visible on the autoradiograph. We call these
6-bp sequences that start with the position x2 5, x2 two classes of fragments type 1 and type 2 fragments,
4, . . . , x21, x11, . . . , x15. However, (4) and (5) respectively. Let Q1(L) and Q2(L) be the probabilities
can be good approximations (NeiandLi1979). that type 1 and type 2 fragments with L nucleotides are
Next, we consider the distribution of L. Assume that conserved by time t. Note that L is not the real length of
L is restricted within a range between Lminand Lmax. Lmin
the amplified fragment, but L represents the nucleotide
and Lmaxmean the minimum and maximum nucleotide
length of the fragment excluding the length of the
lengths of the fragments, respectively, which can be adapter sequences. In other words, L is the length of
scored on the autoradiograph. Let G1(L) be the
distribu-sequence that originated from the genomic DNA. If no
tion of L of type 1 fragment and a91 be the probability
nucleotide change occurs at both primer sites and no
that a 61c1-bp sequence matches EcoRI-primer (a91 5
new restriction site appears between them, the fragment
0.2561c1). Then G
1(L) is given by
can be conserved. Let c1 and c2be the numbers of the
selected bases of EcoRI- and MseI-primers, respectively.
G1(L)5 g1(L)/
o
Lmax
L5Lmin
g1(L), (6)
Under the Jukes and Cantor model, the probability (p) that the nucleotide at a particular site is the same as
where g1(L) is approximately given by
that t generations ago is given by p5[113 exp(24mt/
3)]/4 (JukesandCantor1969). Therefore, the proba- g1(L)5 a91(12 a1)L2611(12 a
2)L2411. (7)
bility that the EcoRI-primer site (length of recognition
If we denote (12a1)(12a2) by A, (7) can be rewritten
sequence of EcoRI1c1bp) remains by time t, p91, is given
as by p262c1, and that for the MseI-primer site (length of
recognition sequence of MseI 1 c2bp), p92, is given by g1(L)5a91(1 2a1)25(12 a2)23AL, (8) p242c2. Denote by b
1 the probability that a new EcoRI
and (6) becomes restriction site appears in a given 6-bp nucleotide
se-quence that is not originally an EcoRI site. The
probabil-G1(L)5
(1 2A)AL2Lmin
12 ALmax2Lmin11. (9)
ity that one or more nucleotide substitutions occur by time t in this 6-bp sequence is 12p1512p6, and the
In the same way, we can obtain G2(L), the distribution
probability that a new EcoRI site forms, a1, is 0.256. Then,
of L of type 2 fragment. Let a92 be the probability that
following Nei and Li (1979) and Nei and Tajima
a 4 1 c2-bp sequence matches MseI-primer (a92 5
(1983), b1 is given by
0.2541c2). Then, we have b15a1(12 p1). (2)
G2(L)5 g2(L)/
o
Lmax
L5Lmin
g2(L), (10)
In the same way, the probability that a new MseI site appears in a given 4-bp sequence, b2, is also obtained.
where g2(L) is approximately given by
Because the probability that one or more nucleotide
substitutions occur in this 4-bp sequence by time t is g
2(L)5a92(12 a1)25(12a2)23AL. (11)
12p2512p4, b2 becomes
After some calculations, (10) becomes b25 a2(12p2), (3)
G2(L)5
(1 2A)AL2Lmin
12 ALmax2Lmin11, (12)
where a2is the probability that a new MseI site forms in
the 4-bp sequence (a2 5 0.254). In a fragment with L
fragments follow the same geometric distribution in the Rm, the remaining (12 R)m bands have a possibility to be shared by chance. The probability that a band interval between Lmin and Lmax.
Finally, we consider the relationship between the with length L is shared by chance is G1(L) {5 G2(L)},
and the distribution of L also follows G1(L). Hence, C
number of nucleotide changes (d) and the expected
proportion of shared bands (F) for a pair of haploid is given by individuals. Denote by R1the average probability that a
type 1 fragment is conserved by time t in both lineages C5 (12R)m
o
Lmax
L5Lmin
G1(L)2 5(12R)mG, (17)
of a pair of haploid individuals. When they diverged t
generations ago, the expectation of d is 2mt. Therefore, where R1is written as the average of Q1(L)2weighted by G1(L)
in the interval between Lmin and Lmax. Namely, G5
o
Lmax
L5Lmin
G1(L)2
R15
o
Lmax
L5Lmin
G1(L)Q1(L)2
5(12 A)[12A2(Lmax2Lmin11)]
(11A)(12 ALmax2Lmin11)2. (18)
5 (12A)p914(12b1)2Lmin210(12b2)2Lmin26
12 ALmax2Lmin11 From (16) and (17), we have
F5 R1(1 2R)mG. (19)
312[A(12 b1)2(12b2)2]Lmax2Lmin11
12A(12b1)2(1 2b2)2
. (13)
From the relationship between F and d (5 2mt), we can estimate d from F. Let n be the number of haploid In the same way, the average probability that a type 2
individuals investigated and Fˆijbe the estimated propor-fragment is conserved in both haploid individuals, R2,
tion of shared bands when the ith and jth haploid indi-is given by
viduals are compared. FollowingNeiandLi(1979), Fˆij is given by
R2 5
o
Lmax
L5Lmin
G2(L)Q2(L)2
Fˆij5 2mij/(mi1 mj), (20) 5(12 A)p912p922(12b1)2Lmin210(12 b2)2Lmin26
12 ALmax2Lmin11 where mi and mj are the observed numbers of bands
scored in the ith and jth haploid individuals and mijis the observed number of bands shared by both haploid 312[A(1 2b1)2(12 b2)2]Lmax2Lmin11
12 A(12 b1)2(12b2)2
. (14)
individuals. Because we can estimate dijfrom (19), the nucleotide diversity (p) is obtained by averaging dˆij as Because the expected ratio of the number of type 1 shown in (1).
fragments to that of type 2 fragments is a91/2a92, the There is another method for estimatingp, in which
probability that a fragment is conserved by both of hap- the average of Fˆ
ij(F˜) is used. Namely, we have loid individuals is given by
F˜5 2
o
i,jFˆijn(n21). (21a)
R5a91R112a92R2 a91 12a92
. (15)
If F˜ is substituted for F in (19), we can estimatepdirectly Here, let us consider the relationship between F and
(Nei andMiller 1990). Neiand Miller(1990)
sug-R. In RFLP analysis,NeiandLi(1979) used the
relation-gested thatpestimated by this method is virtually the ship F5 R. In AFLP analysis, a number of bands can
same value as that estimated by (1), whenpis relatively appear. In this case, when a pair of haploid individuals
small (NeiandMiller1990). Apparently, this method are compared, there is a possibility that both haploid
is more convenient because (19) is used only once in individuals share a particular band on an
autoradio-this case. Equation 19 is too complex to calculate by graph, but the band has not originated from the same
hand. A computer program for estimatingpis available region on the chromosome. This is because more than
on request. two fragments with the same length can appear from
F can be also estimated by the different regions. Namely, there may be some bands
that are shared by a pair of haploid individuals by F
≈52[Rn
i,jmij]/[n(n21)] [Rn
imi]/n
5 2R
n i,jmij (n2 1)Rn
imi
. (21b)
chance. Therefore we have F.R , and F is given by
F 5R1 C, (16)
This method uses the averages of mijand mito estimate
F. We can also estimatepfrom F≈. In the AFLP analysis, where C is the expected proportion of bands shared by
chance. Let m be the expected number of bands scored. ≈Fappears to be almost the same as F˜, because the num-bers of bands for all haploid individuals are relatively Because the expected number of bands that is conserved
COMPUTER SIMULATION
In the above equations we have made several assump-tions and approximaassump-tions. To know the accuracy of the present method, a computer simulation was conducted. The procedure of the simulation is as follows. A random ancestral sequence with the length of M million bp is constructed. The sequence consists of four nucleotides, A, T, G, and C with a given GC-content (g). On this sequence, random mutations are generated. The num-ber of mutations is determined by following the Poisson distribution with mean mt. As models of mutation, we used the equal-input and equal-output models in
TajimaandNei(1982). The mutation rates used in the
simulation are as follows, where we denote the mutation rate from nucleotide X to Y bymXY. In the equal-input
model with g5 0.33,mAT5 mTA5 mGA5 mGT5 mCA5
mCT 5 6m/13 and mAG 5 mAC 5 mTG 5 mTC 5 mGC 5
mCG53m/13. In the equal-input model with g50.67,
mAT 5 mTA 5 mGA 5 mGT 5 mCA 5 mCT 5 3m/13 and
mAG 5 mAC5 mTG5 mTC5 mGC5 mCG56m/13. In the
equal-output model with g5 0.33,mAT5 mAG5 mAC5
mTA 5 mTG 5 mTC 5 3m/4 and mGA 5 mGT 5 mGC 5
mCA 5 mCT 5 mCG 5 3m/2. In the equal-output model
with g 5 0.67,mAT5 mAG5 mAC5 mTA5 mTG 5 mTC5
3m/2 andmGA 5 mGT5 mGC5 mCA5 mCT5 mCG5 3m/
4. Apparently, all the mutation rates arem/4 when g5 0.5 in both models. This mutational process is carried out twice so that two descendant sequences are ob-tained. For these two sequences, the AFLP fragments are detected and the lengths of the fragments (L) are scored if Lmin # L # Lmax, and the proportion of the
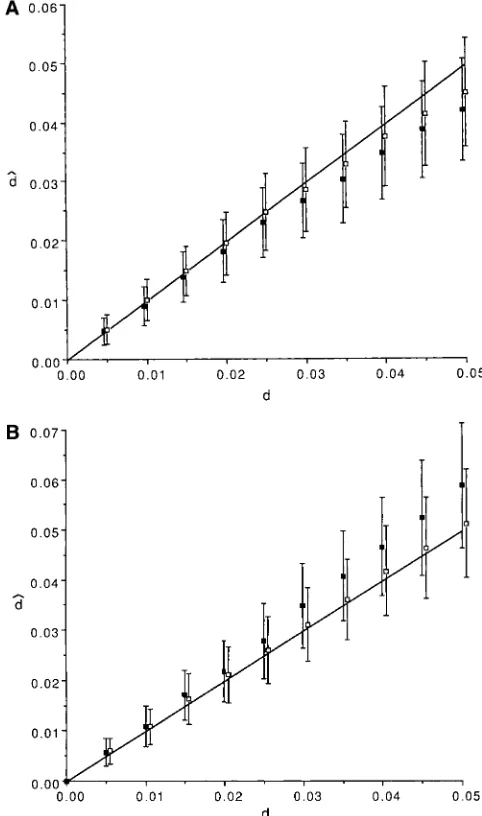
shared bands (fragments) is calculated by (20). The results of the simulation for M 5 1.6 and g 5 0.5 are shown in Figure 1. The selective base of EcoRI-primer was A and that of MseI-EcoRI-primer was G, so that
Figure 1.—The results of simulation where genome size c1 5 1 and c2 5 1. The number of replications for a (M )51.6 million bp and GC-content (g)50.5 are assumed.
given d was 1000. Note that the equal-input and equal- The average number of observed bands isz38. (A) The aver-output models result in the same model when g50.5. age of Fˆ is shown with SD. The solid line represents the ex-pectation of F calculated by (19). (B) dˆ obtained by (19) is
The average number of bands (m) that can be scored
shown with SD. The solid line represents the expectation of d.
was z38. Figure 1A shows the average of Fˆ with the theoretical expectation obtained by (19). It is shown
that the average of Fˆ is very close to the expected value. the true value (Figure 2A). On the other hand, dˆ is From Fˆ, d is estimated by (19), and the average of dˆ is larger than the true value when g5 0.67 (Figure 2B). plotted in Figure 1B. dˆ is very close to the true d. The The deviation of dˆ from true d is larger in the equal-variance of dˆ increases as d increases, although the vari- output model than in the equal-input model, indicating
ance of Fˆ is nearly constant. that the degree of the deviation of dˆ from true d
de-It is known that GC-content is not 0.5 in many organ- pended on the mutation model. However, if d,0.025, isms. By computer simulation, we investigated whether dˆ is very close to the true value in our simulation even the relationship between d and F presented by Equation when g50.33 and 0.67, suggesting that Equation 19 is 19 holds when GC-content deviates from 0.5. Note that quite useful in a range of GC-content between 0.33 and this formula assumes that GC-content is 0.5. Two values 0.67 when d is small.
of GC-content were investigated (g 5 0.33 and 0.67). Since GC-content affects the number of bands (m), the
APPLICATIONS
genome size (M ) was adjusted so that m≈38 (M51.3
11) and heterozygous (12) states of the fragments. Thus the combinations of the AFLP genotypes for DT5 and DT7 could be classified into eight classes. The num-ber of AFLP fragments (bands) detected for each primer combination ranged from 48 to 102, with a total of 897 fragments for 14 primer combinations. About 76% of bands were homozygous (11) for both individ-uals.
From Table 1, F≈was calculated as follows. Note that (21b) is not applicable because D. tokoro is a diploid. Because we have data of diploid individuals, it is neces-sary to consider the diploid individual as a unit of two haploid genomes. Fortunately, in this example, we know from F1 data whether the scored band is homozygous
or heterozygous (Table 1). Here, consider the banding patterns of n diploid individuals, which consist of a total of K types of bands. If we focus on a particular band (for example, the xth band), we know the number of haploid genomes that have this band on the autoradio-graph. Denote this number by Sx, where Sxranges from 1 to 2n. Let us consider the probability, Hx, that the band is shared by two haploid genomes randomly cho-sen from the sample. There are (2n
2) ways to choose a
pair of haploid genomes among the sample, of which (Sx
2) pairs share the band. Then, we have
Hˆx5
1
Sx 2
2
/1
2n 2
2
5Sx(Sx 21)
2n(2n2 1). (22)
Considering all the K types of bands, therefore, we can obtain the average proportion of the shared bands (F≈) for a pair of haploid genomes in the sample. Namely,
F
≈5
o
K x51Hˆxo
Kx51(Sx/2n)
, (23)
Figure 2.—The effect of GC-content (g) on the estimate
where the denominator of the right side is the average
of d (dˆ). dˆ obtained by (19) is shown with SD. The solid line
number of bands per haploid genome. From (19), then,
represents the expectation of d. The genome size is adjusted
for the number of bands (m) to bez38. (A) g5 0.33 and we can estimatepusing F≈.
M5 1.3. (B) g50.67 and M55.8. (h) The result of the In this case, F≈ was calculated to be 0.914. Then we equal-input model; (j) the result of the equal-output model.
havepˆ 50.0055 from (19). The sampling variance of pˆ was computed by the jackknife method (Efron1982) following Nei and Miller (1990), which was 1.19 3 Asia. The AFLP data are unpublished results ofR.
Ter-1028.
auchi and G. Kahl. Two individuals [DT5 (female)
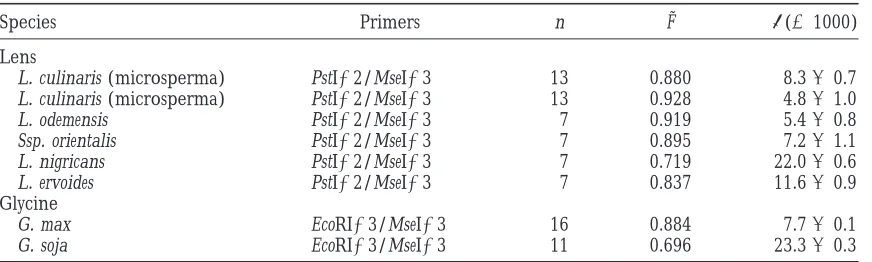
The nucleotide diversities of six Lens species were and DT7 (male)], collected from Wakayama Prefecture
calculated. The data are taken from Table 2 ofSharma
in Japan, were investigated. For linkage analysis, they
et al. (1996). As all the six species are selfing species, have segregation data of AFLP patterns in their F1
proge-we can directly calculate F˜ by averaging Fij. The obtained nies. In the present article, we estimate the nucleotide
F˜ is summarized in Table 2. From F˜ , the nucleotide diversity in these two individuals, DT5 and DT7
(corre-diversity was calculated by (19), and the results are also sponding to four haploid individuals) from the AFLP
shown in Table 2. The estimated nucleotide diversity data.
ranges from 0.0048 to 0.0220. The sampling variance Table 1 summarizes the results of AFLP detected
be-was also estimated by the jackknife method.Maugham
tween DT5 and DT7 for 14 primer combinations. PCR
et al. (1996) analyzed AFLP patterns in two species of primers complementary to EcoRI- and MseI-adapters
Glycine (soybean), where they used PstI (six-base recog-have two and three selective bases at their 39ends,
re-nition enzyme) instead of EcoRI. Because their PstI-spectively. As there are segregation data among progeny
primer has three selected bases, c15 3 and c2 53 are
(R. TerauchiandG. Kahl,unpublished results), it was
TABLE 1
Results of AFLP analysis of theD. tokorogenome
Selective bases of primersa
AG/ AG/ TT/ TT/ TT/ TG/ TG/ TC/ TC/ TC/ AG/ AG/ AG/ AG/ DT5 DT7 CAG CAC CTT CTG CAC CTC CAC CTG CTC CAG CTC CTG CAT CAC Total
11 11 41 34 86 46 41 45 45 57 63 45 36 44 59 36 678
11 12 0 1 1 2 2 2 3 2 3 2 4 1 2 1 26
12 11 1 1 2 2 0 3 3 5 0 2 0 2 2 0 23
11 22 0 2 0 1 0 2 0 1 1 1 0 0 0 2 10
22 11 2 0 0 0 2 0 1 1 1 2 1 0 0 1 11
12 12 1 3 5 5 6 1 3 3 2 3 1 2 4 4 43
12 22 3 4 4 5 6 7 3 2 6 5 3 1 3 4 56
22 12 6 3 4 4 2 3 0 4 4 5 3 3 5 4 50
Total 54 48 102 65 59 63 58 75 80 65 48 53 75 52 897
F
≈
(%)b 92.3 90.2 95.2 90.3 89.4 91.0 93.1 92.6 93.4 89.7 92.4 95.0 93.4 89.2 91.9
Data fromR. TerauchiandG. Kahl(unpublished results).
aThe selective bases of the primer pair are shown as those for the EcoRI-primer (2 bp) and
MseI-primer (3 bp).
b≈Fis obtained from (23) and shown in percentage.
Glycine max and G. soja are estimated to be 0.0077 and Using this relationship with Haldane’s correction ( Hal-dane1956), fxis estimated by
0.0233, respectively (Table 2).
In the case of D. tokoro, we know whether the scored
band is homozygous or heterozygous, because we have fˆx512
!
4(n2 Sx)11
4n11 . (25)
data of F1 progeny. If such data are not available, we
cannot use (23) for estimating F˜. In this case, we have
Let hx be the probability that the xth band is shared to use the frequency of the band in the population.
by two haploid genomes randomly chosen from the The following procedure is essentially the same as in
population, so that hxcorresponds to the homozygosity
Stephenset al. (1992). Denote the expected frequency
of the xth band (hx 5 fx2). From (24), hx can also be of the xth band by fx(1#x#K ), where K is the number
estimated by of types of scored bands. Consider that n diploid
individ-uals are sampled from a population, and assume that hˆx52fˆx2Sx/n, (26)
the population is in Hardy-Weinberg equilibrium. Let
where fˆxis given by (25). Therefore, F
≈
is given by Sxbe the number of (diploid) individuals that have the
xth band (1#Sx# n). Then, we have
F
≈5
o
K x51 hˆxo
K x51fˆx, (27)
E(Sx/n)5f2x1 2fx(1 2fx)5 2fx2 f2x. (24)
TABLE 2
Nucleotide diversity in Lens and Glycine
Species Primers n F˜ p(31000)
Lens
L. culinaris (microsperma) PstI12/MseI13 13 0.880 8.360.7
L. culinaris (microsperma) PstI12/MseI13 13 0.928 4.861.0
L. odemensis PstI12/MseI13 7 0.919 5.460.8
Ssp. orientalis PstI12/MseI13 7 0.895 7.261.1
L. nigricans PstI12/MseI13 7 0.719 22.060.6
L. ervoides PstI12/MseI13 7 0.837 11.660.9
Glycine
G. max EcoRI13/MseI13 16 0.884 7.760.1
G. soja EcoRI13/MseI13 11 0.696 23.360.3
Data for Lens and Glycine are from Table 2 ofSharmaet al. (1996) and Table 4 ofMaughamet al. (1996),
where the denominator of the right side is the expected ratio of the rate of indel to that of nucleotide substitu-number of bands per haploid genome. Using the above tion, which might vary among organisms. Unfortu-F
≈
, we can calculate the nucleotide diversity. nately, it is not always possible to know the ratio. When the ratio is not known, the present method should be used with caution.
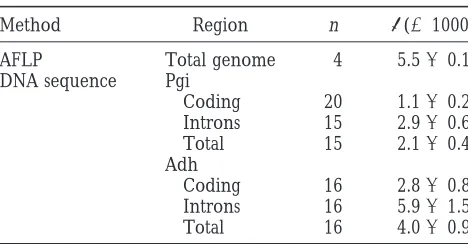
DISCUSSION To investigate the amount of intraspecific variation,
the AFLP pattern of D. tokoro was analyzed. As expected In this study, we developed a method for estimating
from the results with other plant species (Vos et al. nucleotide diversity (p) from AFLP data. Although
1995), on the average 55.8 bands per primer pair were Equation 19 is very complex to calculate, the computer
obtained for 14 primer combinations, indicating that simulation indicates that this equation gives a good
esti-this technique is very efficient for surveying a large num-mate of d as shown in Figure 1. The variance of the
ber of DNA fragments. Because a number of fragments estimate increases with d, indicating that the estimate
were analyzed simultaneously, the sampling variance of is not as reliable when d is large.
the estimated nucleotide diversity was relatively small, Our method was directly applied to the AFLP data
although the sample size is small. If the AFLP technology set from D. tokoro. The estimated value ofpwas 0.0055
is used for large-scale population surveys, it can provide 60.0001 (SD). This value was compared with those in
a reliable estimate of the amount of nucleotide varia-two gene regions of D. tokoro, which were estimated from
tion. DNA sequences byTerauchiet al. (1997). Table 3 shows
the estimated p from DNA sequences. The sampling The authors thank Naohiko Miyashita and Akira Kawabe for their variance of the estimatedpfrom DNA sequences is also comments and suggestions. This work was supported in part by a grant-in-aid from the Ministry of Education, Science, Sports, and Culture of
calculated by Equation 32 inTajima(1983). As shown
Japan.
in Table 3,pestimated from AFLP is larger thanpfrom DNA sequences, except for Adh introns. Apparently,p from AFLP represents the nucleotide diversity of the
total genome of D. tokoro. It is known that in eukaryote LITERATURE CITED
genomes many regions have little or no functions, and
Clark, A. G.,andC. M. S. Lanigan,1993 Prospects for estimating
that in such regions the selective constraint may be very nucleotide divergence with RAPDs. Mol. Biol. Evol. 10: 1096–
1111.
weak in comparison with functional regions (Kimura
Efron, B.,1982 The Jackknife, the Bootstrap, and Other Resampling Plans. 1983;Nei1987). Therefore, we can consider thatpfor
Society of Industrial and Applied Mathematics, Philadelphia.
the total genome may be larger than that for a specific Haldane, J. B. S.,1956 The estimation of viabilities. J. Genet. 54:
coding region. 294–296.
Hill, M., H. Witsenboer, M. Zabeau, P. Vos, R. Kesseli et al., Another explanation for the large value of p based
1996 PCR-based fingerprinting using AFLPs as a tool for studying
on AFLP data is the effect of insertions and deletions, genetic relationships in Lactuca ssp. Theor. Appl. Genet. 93: which are assumed to be very rare events and are ne- 1202–1210.
Jukes, T. H.,andD. R. Cantor,1969 Evolution of protein
mole-glected in this study. If insertion and deletion events
cules, pp. 21–132 in Mammalian Protein Metabolism, edited by
are not rare,pestimated by our method might be an H. N. Munro.Academic Press, New York.
overestimate. This problem also appears in estimation Kimura, M.,1983 The Neutral Theory of Molecular Evolution.
Cam-bridge University Press, CamCam-bridge, UK.
of p from RFLP data without a restriction map (Nei
Maheswaran, M., P. K. Subudhi, S. Nandi, J. C. Xu, A. Parcoetet andLi1979) and from RAPD data (ClarkandLanigan al., 1997 Polymorphism, distribution, and segregation of AFLP
1993). The degree of overestimation depends on the markers in a doubled haploid rice population. Theor. Appl. Genet. 94: 39–45.
Maugham, P. J., M. A. Saghai Maroof, G. R. BussandG. M. Huestis,
1996 Amplified fragment length polymorphism (AFLP) in
soy-TABLE 3 bean: species diversity, inheritance, and near-isogenic line
analy-sis. Theor. Appl. Genet. 93: 392–401.
Nucleotide diversity inD. tokoro
Nei, M.,1987 Molecular Evolutionary Genetics. Columbia University
Press, New York.
Method Region n p(31000) Nei, M.,andW.-H. Li,1979 Mathematical model for studying ge-netic variation in terms of restriction endonucleases. Proc. Natl.
AFLP Total genome 4 5.560.1 Acad. Sci. USA 76: 5296–5273.
DNA sequence Pgi Nei, M.,andJ. C. Miller, 1990 A simple method for estimating average number of nucleotide substitutions within and between
Coding 20 1.160.2
populations from restriction data. Genetics 125: 873–879.
Introns 15 2.960.6
Nei, M.,andF. Tajima, 1981 DNA polymorphism detectable by
Total 15 2.160.4
restriction endonucleases. Genetics 97: 145–163.
Adh Nei, M.,andF. Tajima,1983 Maximum likelihood estimation of Coding 16 2.860.8 the number of nucleotide substitutions from restriction sites data. Introns 16 5.961.5 Genetics 105: 207–217.
Total 16 4.060.9 Sharma, S. K., M. R. KnoxandT. H. N. Ellis,1996 AFLP analysis of the diversity and phylogeny of Lens and its comparison with
Data for Pgi and Adh are from Table 3 ofTerauchiet al. RAPD analysis. Theor. Appl. Genet. 93: 751–758.
Stephens, J. C., D. A. Gilbert, N. YuhkiandS. J. O’Brien,1992
Estimation of heterozygosity for single-probe multilocus DNA Thomas, C. M., P. Vos, M. Zabeau, D. A. Jones, K. A. Norcottet
Fingerprints. Mol. Biol. Evol. 9: 729–743. et al., 1995 Identification of amplified restriction fragment
poly-Tajima, F., 1983 Evolutionary relationship of DNA sequences in morphism (AFLP) markers tightly linked to the tomato Cf-9 gene finite populations. Genetics 105: 437–460. for resistance to Cladosporium fluvum. Plant. J. 8: 785–794.
Tajima, F.,andM. Nei,1982 Biases of the estimates of DNA diver- Vos, P., R. Hogers, M. Bleeker, M. Reijans, T. van de Leeet al.,
gence obtained by the restriction enzyme technique. J. Mol. Biol. 1995 AFLP: a new technique for DNA fingerprinting. Nucleic
18:115–120. Acids Res. 23: 4407–4414.
Tajima, F.,andM. Nei,1984 Estimation of evolutionary distance
between nucleotide sequences. Mol. Biol. Evol. 1: 269–285. Communicating editor:A. G. Clark Terauchi, R., T. TerachiandN. T. Miyashita,1997 DNA
polymor-phism at the Pgi locus of a wild yam, Dioscorea tokoro. Genetics