18th International Conference on Structural Mechanics in Reactor Technology (SMiRT 18) Beijing, China, August 7-12, 2005 SMiRT18-K10-4
STUDY ON 3-DIMENSIONAL BASE ISOLATION SYSTEM APPLYING
TO NEW TYPE POWER PLANT REACTOR: PART 2
(HYDRAULIC 3-DIMENSIONAL BASE-ISOLATION SYSTEM)
Takahiro Shimada
1, Shin-Nakahara-cho, Isogo-ku,
Yokohama, JAPAN
Phone: +81-45-759-2825, Fax: 2208
E-mail: [email protected]
Junji Suhara
2-3, Shibaura 1-chome, Minato-ku,
Tokyo, JAPAN
Phone: +81-3-5441-0859, Fax: 0370
[email protected]
Kenji Takahashi
4002 Narita, O-arai-machi, Ibaragi
Phone: +81-29-267-4141, Fax: +81-29-266-3675
E-mail: [email protected]
ABSTRACT
Three dimensional (3D) seismic isolation devices have been developed to use for the base isolation system of the heavy building like a nuclear reactor building. The developed seismic isolation system is composed of rolling seal type air springs and the hydraulic type springs with rocking suppression system for vertical base isolation device. In horizontal direction, the same laminated rubber bearings are used as horizontal isolation device for these systems.
The performances and the applicability have already been evaluated by the technical feasibility tests and performance tests for each system. In this study, it was evaluated that the performance of the 3D base isolation system with rolling seal type air springs combined with hydraulic rocking suppression devices. In this paper, the results of performance tests for hydraulic rocking suppression system will be reported.
A 1/7 scaled model of the 3D base isolation devices were manufactured and some performance test were executed for each device. For the hydraulic rocking suppression system, forced dynamic loading test was carried out in order to measure the frictional and oil flow resistance force on each cylinder.
And the vibration table tests were carried out with supported weight of 228 MN in order to evaluate and to confirm the horizontal and vertical isolation performance, rocking suppression performance, and the applicability of the this seismic isolation system as the combined system. 4 rolling seal type air springs and 4 hydraulic load-carrying cylinders with rocking suppression devices supported the weight.
As a result, the proposed system was verified that it could be applied to the actual nuclear power plant building to be target.
Keywords:Three Dimensional Base Isolation, Seismic Isolation, Hydraulic, Rocking
1. INTRODUCTION
three-dimensional seismic isolation has been realized for application to an each floor, but coverage of the entire building including the upper stories has been awaiting development. A structure or mechanism needed to be found that would, white carrying a load of several hundred tons, present a flexible property against vertical movement (e.g. possessing a natural frequency above 1 see). Another difficulty was suppression of rocking response to seismic movement.
As a means of overcoming the foregoing obstructions, the present authors have proposed two three-dimensional seismic isolation devices those are rolling seal type air springs and the rocking suppression devices incorporating hydraulic mechanism. So far, the forced dynamic loading tests on reduced-size rolling seal type air springs and shaking table tests on rocking suppression devices, together with modelized analysis [2, 3].
With the aim of approaching a step closer to practical application, the next step envisaged is to verify the performances of integrated three-dimensional seismic isolation system composed of air springs and hydraulic rocking suppression devices through further tests and analyses, and examination of design problems.
The present paper takes up the performance aspect of the system, with a description of experiments using models covering:
- The forced dynamic loading tests on hydraulic rocking suppression devices - The shaking table tests on the integrated system
2. DESIGN OF TEST MODEL
2.1.
Similarity LawThe scale ratio of the model to an actual prototype structure is 1/7 and both acceleration and density are equal to those of the prototype. The similarity law is shown in Table 1.
Table 1 Similarity Law
Parameter Similitude λ 7Length 1/λ 1/7
Velocity 1/√λ 1/2.7
Acceleration 1 1
Time 1/√λ 1/2.7
Mass 1/λ3 1/343
Stress 1/λ 1/7
density 1 1
2.2.
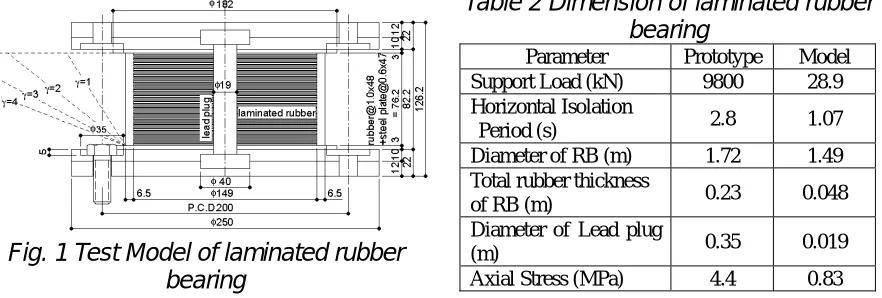
Test Model of Laminated Rubber BearingThe sectional view and specification of a model of the laminated rubber bearing with a lead plug are shown in Fig. 1 and Table 2. Since the similarity law, which suits the prototype by the model about density, is adopted, the shape of laminated rubber bearing model is more slender than the prototype.
Fig. 1 Test Model of laminated rubber
bearing
Table 2 Dimension of laminated rubber
bearing
Parameter Prototype Model Support Load (kN) 9800 28.9
Horizontal Isolation
Period (s) 2.8 1.07
Diameter of RB (m) 1.72 1.49 Total rubber thickness
of RB (m) 0.23 0.048
Diameter of Lead plug
(m) 0.35 0.019
2.3.
Test Model of Rocking Suppression DevicesRocking suppression system is composed of the load carrying cylinders, the rocking suppression cylinders, and the angle linkage cylinders. Each cylinder is connected with the pipe of 25mm in the inside diameter. The laminated rubber bearing set up in the upper part of the load carrying cylinder is the same as that of the air spring.The sectional view and specification of hydraulic rocking suppression device models are shown in Fig.2 and Table 3.
Laminated Rubber Bearing
Outer Cylinder
Rod
(a) Load Carrying Cylinder
Link pipe Link valve
Rod Cylinder (Piston)
(b) Rocking Suppression Cylinder
Rod
Rod Cylinder Piston
Link pipe
(c) Corner Linkage Cylinder
Table 3 Dimension of Rocking Suppression Devices
Device Parameter Prototype Model
Support Load (kN) 9800 28.6
Vertical Isolation Period (s) 2.0 0.76 Common
Pressure (MPa) 25 3.57
Diameter of Cylinder (mm) 720 100 Load Carrying
Cylinder Movable Stroke (mm) 350 50
Volume of N2 gas (Liter) 650 1.8
Accumulator unit
Volume Ratio of main-Tank to assist-Tank 1 : 2 1 : 2 Diameter of Piston (mm) 800 60
Diameter of Rod (mm) 500 36
Rocking Suppression
Cylinder Movable Stroke (mm) 1400 250
Diameter of Rod (mm) 800 60
Corner Cylinder
Movable Stroke (mm) 1400 250
3. TEST OF ROCKING SUPPRESSION DEVICES ALONE
3.1.
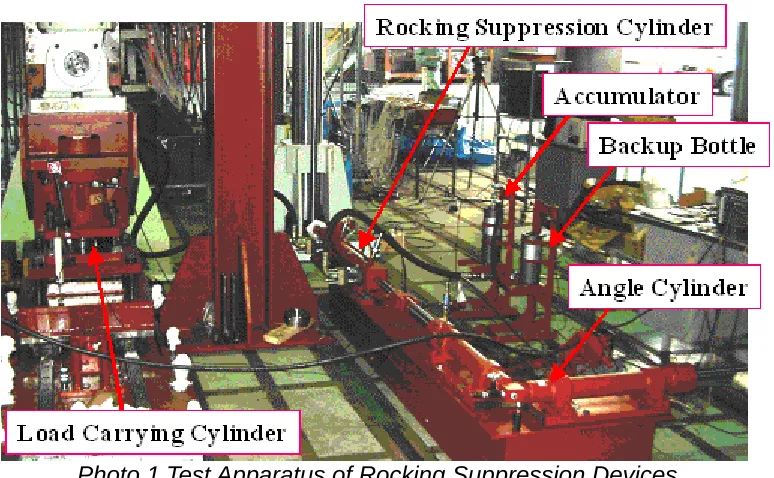
Outline of TestIn this test, one unit of four unit used by the shaking table test were taken out and the test was executed. Each cylinder (load carrying cylinder, rocking suppression cylinder, and corner cylinder) was connected with the pipe of 25mm in the inside diameter. Forced vibration displacement in the vertical direction was given to the load-carrying cylinder. The frictional resistance force generated from each cylinder and the damping force generated by the differential pressure before and behind the gas throttle installed between the accumulator and the backup bottle was measured.
To confirm the influence that a horizontal load gives to the frictional force in the vertical direction, the forced vibration test in the vertical direction was also executed under acting a horizontal static load.
The test apparatus is shown in Photo 1.
Photo 1 Test Apparatus of Rocking Suppression Devices
3.2.
Frictional Force Measurement-50 -40 -30 -20 -10 0 10 20 30 40 50
15
20
25
30
35
40
45
Dislacement [mm]
Vert
ic
al
Load
[kN]
LC+RC+CC LC+RC LC
Fig. 3 Vertical Hysteresis Loop
Table 4 Frictional Force
Cylinder Frictional Force (kN)LC 1.10 RC 1.15 CC 1.25
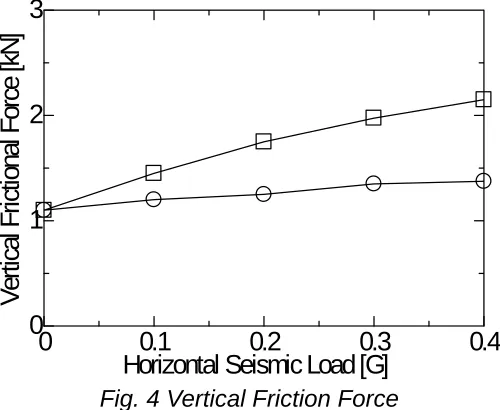
Figure 4 shows the change in the frictional force in the vertical direction generated by the magnitude of the horizontal load. When the swivel works effectively, the vertical friction force became as a curve of the round symbols show in Fig.4. When the swivel is fixed, vertical friction force became as the curve shown as the square symbols.
It is confirmed that the increment of the frictional force becomes small by the effect of the swivel as a result. However, the effect of the swivel is not so higher than frictional force generated by RC and CC.
0
0.1
0.2
0.3
0.4
0
1
2
3
Horizontal Seismic Load [G]
Ve
rti
cal
F
ric
tional
F
orc
e [k
N
]
Fig. 4 Vertical Friction Force
3.3.
Damping Force Measurement-20
-10
0
10
20
-1
-0.5
0
0.5
1
Vertical Displacement [mm]
Pressure Loss [MPa]
0.1 Hz
0.3 Hz
0.5 Hz
1.0 Hz
-20 -10
0
10
20
-1
-0.5
0
0.5
1
Vertical Displacement [mm]
Pressure Loss [MPa]
0.1 Hz
0.3 Hz
0.5 Hz
a. X
0=±10mm
b. X
0=±10mm
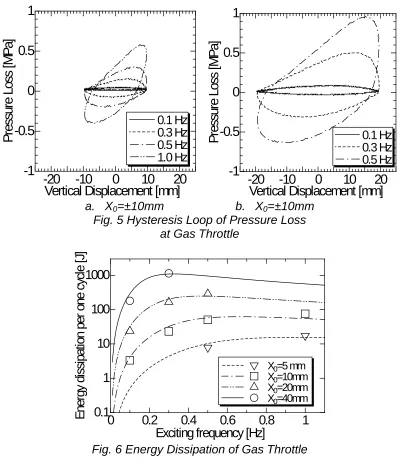
Fig. 5 Hysteresis Loop of Pressure Loss
at Gas Throttle
0
0.2
0.4
0.6
0.8
1
0.1
1
10
100
1000
Exciting frequency [Hz]
Energy dissipation per one cycle [J]
X0=5 mm
X0=10mm
X0=20mm
X0=40mm
Fig. 6 Energy Dissipation of Gas Throttle
Figure 6 shows the relationship between the excitation frequency and dissipated energy per a cycle for each amplitude of excitation vibration displacement. The plots show the value obtained by the experiment in this figure, and the curves are a theoretical value obtained by three-element model [3].
The experimental values show the good agreement with the theoretical curves, thus the validity of the theory for obtaining the damping force generated by the throttle valve is confirmed.
4. SHAKING TABLE TEST OF COMPOSED DEVICES
4.1.
Outline of Shaking Table TestThe model used for an shaking table test consists of four air springs and oil dampers, and four load carrying cylinders, rocking suppression cylinders, accumulator units and corner cylinders. Four air springs and four load carrying cylinders supported the building model of 248kN by eight points in total and 31kN was supported equally respectively.
X
Y
Load-Carrying Cylinder
Rocking Suppression Cylinder
Corner Cylinder
3.5m 4.2m
Accumulator Unit
Rolling Seal Type Air Spring
Oil Damper
Fig.7 Schematic Drawing of Shaking Table Test Model (Top View)
4.2.
Sine Wave Excitation TestThe sine wave excitation test was carried out in order to confirm the vertical damping characteristics of the air springs and of rocking suppression devices were suitable for the designed characteristics.
Figure 8 shows the hysteresis loop of reaction forces measured by the load-cells installed on the air springs and the load carrying cylinders of rocking suppression devices.
-30 -20 -10 0 10 20 30
15 20 25 30 35 40 45 Displacement [mm]
Reaction Force [kN]
-30 -20 -10 0 10 20 30
20 25 30 35 40 45 50 Displacement [mm]
Reaction Force [kN]
a. Air Spring b. Load Carrying Cylinder
Fig. 8 Hysteresis Loop of Reaction Force
The reaction force of air spring was similar to the test result of air springs only.The area of hysteresis loop of rocking suppression device is consists of the damping force generated by the gas throttle, the frictional force generated by cylinders, and the pressure loss of oil piping. These components can be calculated from reaction force and hydraulic pressures measured in the test as shown in Fig.9.
The equivalent damping factor calculated from the area of hysteresis is summarized in Table 5. For the air spring, the equivalent damping factor is suitable to designed value. For the rocking suppression device, the equivalent damping factor of gas throttle and piping is suitable to designed value, but that of frictional force is larger than designed value. But the influence of friction becomes 1/7 in a real size device, because the support pressure increases to seven times that of the model.
-30 -20 -10 0 10 20 30
-15 -10 -5 0 5 10 15 Displacement [mm] For ce [ kN]
gas throttle
-30 -20 -10 0 10 20 30
-15 -10 -5 0 5 10 15 Displacement [mm]
Reaction Force [kN]
friction
a. pressure loss of gas throttle b. friction of cylinders
-30 -20 -10 0 10 20 30
-15 -10 -5 0 5 10 15 Displacement [mm] For ce [ kN]
RC to
accumulator unit
-30 -20 -10 0 10 20 30
-15 -10 -5 0 5 10 15 Displacement [mm] Force [kN]
LC to RC
c. pressure loss of oil piping
Table 5 Equivalent Damping Factors
heq [%] Aarea of Hyst.
[Nm] (Measured) (Target) Orifice 130.6 6.5 6.3 Air Spring
Oil Damper - (4.7) 5.0
Throttle 272.3 13.6 12.5
Oil Piping 1 67.2 3.3 2.0 Oil Piping 1 74.6 3.7 2.0 Rocking
Suppression Device
Friction 427.5 21.3 (3.0)
4.3.
Earthquake Wave Excitation Test4.3.1.
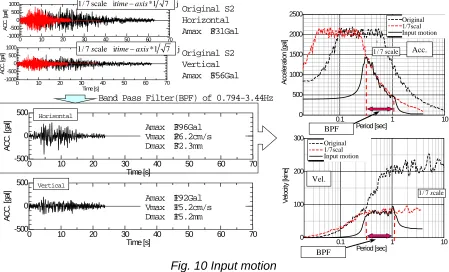
Input MotionThe input earthquake motion into a shaking table is taken as the greatest excitation S2 whose response spectrum of 5% of damping in a long period is 2 m/s. However, an input earthquake motion cuts a long period and a short period with a band path filter because of restrictions of the shaking table capability. (Refer to Fig. 10).
Original S2 Horizontal Amax F831Gal
Original S2 Vertical Amax F556Gal
Band Pass Filter(BPF) of 0.794-3.44Hz
0 10 20 30 40 50 60 70
-500 0 500
Time [s]
ACC. [gal]
0 10 20 30 40 50 60 70
-500 0 500
Time [s]
ACC. [gal]
Amax F396Gal Vmax F26.2cm/s Dmax F32.3mm
Amax F192Gal Vmax F15.2cm/s Dmax F15.2mm
0 10 20 30 40 50 60 70
-1000 -500 0 500 1000 Time [s] ACC. [gal]
0 10 20 30 40 50 60 70
-1000 -500 0 500 1000 Time [s] ACC. [gal ] j
i *1 7
scale 7 /
1 time−axis
j
i *1 7
cale 7 /
1 s time−axis
0.1 1 10
0 500 1000 1500 2000 2500 Period [sec] Acceleration [gal] Œ´”g ‘ŠŽ—‘¥(1/7)”g ‰Á U“ü—Í”g Acc. cale 7 / 1 s BPF
0.1 1 10
0 100 200 300 Period [sec] Ve lo ci ty [ki ne ] Œ´”g ‘ŠŽ—‘¥(1/7)”g ‰Á U“ü—Í”g Vel. cale 7 / 1 s BPF Horisontal Vertical Original 1/7scal Input motion Original 1/7scal Input motion
Fig. 10 Input motion
4.3.2. Test Cases
The cases of earthquake wave excitation test are summarized in Table 6. Though the wave that gave the band-pass filter processing was used in most cases, the tests that used the wave that gave the high-pass filter that left the high frequency element was executed in the case with the excitation only of the direction of Z. The band pass filter processing wave is the same as the test of the air springs alone .
Table. 6 Test Case of Earthquake Wave Excitation Test
Input Level Exciting Direction* Filter
S2 x 1.0 X, Y, Z, XY, XZ, XYZ 0.794-3.44 Hz BPF
S2 x 1.0 Z 0.3Hz HPF
S2 x 1.5 X, Y, Z, XZ 0.794-3.44 Hz BPF * ‘XY’ means earthquake wave in X and Y direction input simultaneously.
4.3.3. Isolation Performance
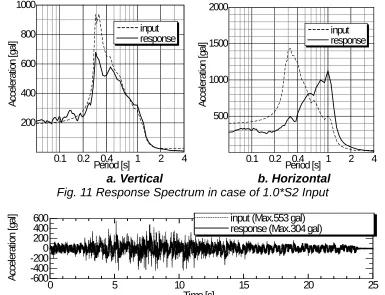
in case of that 1.0*S2 wave in X (horizontal) direction and Z (vertical) direction input simultaneously. In horizontal direction, the response under the period of 0.5 sec is isolated obviously. Similarly, the response acceleration in vertical direction under the period of 0.5 sec has been isolated, but vertical isolation performance is not as clear as that of horizontal direction because of the lower cut off frequency of band-pass filter, which is about 0.3 sec is close to 0.5 sec.
Figure 12 shows the time history of the response acceleration of the building model. As shown in Fig.12, maximum acceleration of input 553 gal was reduced to 304 gal.
0.1 0.2 0.4 1 2 4
200 400 600 800 1000
Period [s]
Acceleration [gal]
input response
0.1 0.2 0.4 1 2 4
500 1000 1500 2000
Period [s]
Acceleration [gal]
input response
a. Vertical
b. Horizontal
Fig. 11 Response Spectrum in case of 1.0*S2 Input
0 5 10 15 20 25
-600 -400 -2000 200 400 600
Time [s]
Acceleration [gal]
input (Max.553 gal) response (Max.304 gal)
Fig. 12 Time History of Response Acceleration in Vertical Direction (0.3Hz HPF input)
Figure 13 shows the response spectrum of the input acceleration and of response acceleration of the building model in vertical direction. It is confirmed that the response spectrum is greatly decreased in a low area of the period than 0.5 seconds as shown in Fig.13.
We can see that the isolation performance also appears well in vertical direction.
0.020 0.04 0.1 0.2 0.4 1 2 4
500 1000 1500
Period [s]
Acceleration [gal]
input response
Fig. 13 Response Spectrum in Vertical Direction (0.3Hz HPF input)
4.3.4. Health to Excessive Level of Earthquakethat 1.5*S2 wave in X (horizontal) direction and Z (vertical) direction input simultaneously. The shape of response spectrum in Fig.14 is almost similar to that in Fig.11 (which is that of 1.0*S2). Thus it is confirmed that the excessive level of earthquake input both in horizontal and in vertical direction does not affect the isolation performance.
0.1 0.2 0.4 1 2 4
0 500 1000 1500
Period [s]
Acceleration [gal]
input response
0.1 0.2 0.4 1 2 4
0 500 1000 1500 2000 2500
Period [s]
Acceleration [gal]
input response
a. Vertical
b. Horizontal
Fig. 14 Response Spectrum in case of 1.5*S2 Input
4.3.5. Independency of Performance in Horizontal and Vertical direction
Figure 15 shows the response spectrum in the case of the shaking table excited in X direction only, in X and Z direction and in X, Y and Z direction simultaneously. As shown in this figure, input condition does not affect the response spectrum both in horizontal direction and in vertical direction; in other words, isolation performance is almost independent from each other. This is a convenient characteristic to design the isolation performance.
0.1 0.2 0.4 1 2 4
0 500 1000
Period [s]
Acceleration [gal]
input direction Z XZ XYZ
0.1 0.2 0.4 1 2 4
0 500 1000 1500
Period [s]
Acceleration [gal]
input direction X XZ XYZ
4.3.6. Performance of Rocking Suppression
Figure 16 shows the vertical response displacement due to the rocking motion at the load-carrying cylinder under the input condition of that excited in X, Y and Z direction simultaneously. The response displacement due to the rocking motion is only 1.35 mm. It indicates the effect of the rocking suppression is remarkable under three-dimensional seismic excitation.
0
5
10
15
20
25
30
-3
0
3
Time [s]
Rocking Disp.
[mm]
around the X axis
Max. 1.35 mm
0
5
10
15
20
25
30
-3
0
3
Time [s]
Rocking Disp.
[mm]
around the Y axis
Max. 1.2 mm
Fig.16 Vertical Displacement due to Rocking Motion
CONCLUSION
Shaking table tests of the 3D seismic isolation system that combined air springs and hydraulic rocking suppression devices were executed. Following points became clear as the results of the tests.
# The device characteristics (natural frequency, damping factor, etc.) obtained from the test were almost equal to designed values.
# The maximum response values in the test were almost equal to results of the prediction analysis. # The hydraulic rocking suppression devices proved to be effective to three-dimensional input excitations. # It is quite possible to actualize the air spring the burst pressure of which exceeds 20MPa.
# In this isolation system, almost no interaction was observed between horizontal and vertical responses to 1.5 S2 input excitations.
# Effectiveness of the seismic isolation system was confirmed through the test result that response vertical acceleration spectra greatly decreased in short period domain if high-pass filtered vertical S2 wave, which was close to original S2 wave, was input.
As the results shown above, it is confirmed that the 3D seismic isolation device is applicable to a nuclear power plant.
ACKNOWLEDGMENT
This study is a part of project sponsored by the Japanese government (METI) and was conducted by the Japan Atomic Power Company in collaboration with Japan Nuclear Cycle Institute. The authors wish to express their profound appreciation to the project committee members.
REFERENCE
[1] Fujita, T., “Technology for Earthquake-Resistant Structures in the Twenty-First Century”, “Journal of the Japan Society of Mechanical Engineers, Vol.99, No.935, pp.59-64
[2] Tetsuya Hagiwara, et al. Three-Dimensional Seismic Isolation Device with Rolling Seal Type Air Spring, 20004ASME PVP, Seismic Engineering
[3] Takahiro Shimada, et al. Study on Three-Dimensional Seismic Isolation System for Next-Generation Nuclear Power Plant: Hydraulic Three-Dimensional Base Isolation System, 2004ASME PVP, Seismic Engineering
[4] Kato, M., et al. Design study of the seismic-isolated reactor building of demonstration FBR plant in Japan, 13th SMiRT, Aug.1995, pp579-584