D E V E L O P M E N T OF 3 - D I M E N S I O N A L BASE I S O L A T I O N S Y S T E M F O R
N U C L E A R P O W E R P L A N T S
Takahiro Somaki 1), Testundo Nakatogawa ~), Akinori Miyamoto 2), Koichi Sugiyama 2), Yoshihisa Oyobe 3) and Kaoru Tamachi 3)
1) Nuclear Facilities Division, Obayashi Corporation, Japan 2) Technical Research Institute, Obayashi Corporation, Japan 3) D a i d o P r e c i s i o n I n d u s t r y , Japan
A B S T R A C T
This paper describes the vertical isolation system for nuclear power plants, of which 3-dimensional base isolation system is composed, assuming that some horizontal base isolation system as laminated rubber bearings.
A horizontal base isolation system brings the drastic reduction effect on equipment/piping responses in the horizontal direction. However, vertical responses of equipment/piping tend to be greater than non-isolated building.
We developed the 3-dimensional isolation system for whole building, composed of laminated rubber bearings for the horizontal directions and coned disk springs for the vertical direction.
Considering the characteristics of vertical isolation devices by elemental tests in actual size, the precise seismic response analyses show that the drastic reduction of responses can be achieved.
INTRODUCTION
In Japan, some studies on application of 2-dimensional base isolation system to FBR or PWR plants have been continued for about 15 years. So the guideline for the design of base isolated nuclear power plants will be published soon. The aims of base isolation studies are the site-free design standardization of nuclear power plants.
The horizontal isolation system brings the drastic reduction effect on equipment/piping responses in the horizontal direction. However, in the horizontal isolated building the thickness of members/walls excepting for neutron shielding walls will be designed thinner for achieving construction cost reduction, the vertical equipment/piping responses tend to be greater due to amplification in the isolation layer and in the building structure.
The development of 3-dimensional isolation system is required from a viewpoint of further construction cost reduction of nuclear power plants.
OUTLINE OF 3-DIMENSIONAL BASE ISOLATION SYSTEM
Condition for development
On the occasion of developing the 3-dimensional base isolation system, it is a basic principle to add a vertical isolation system to the 2-dimensional horizontal isolation system.
For the high seismicity area, the isolation device was developed to satisfy with the following items.
1) Developing 3-dimensional isolation for whole building, with separating the devices in horizontal and vertical directions respectively to elongate the vertical eigenperiod and to be installed in the same layer space of horizontal isolation devices
2) Installing the prevention devices for the rocking behavior occurred by the horizontal motion
3) Reducing floor response spectra in the range of less than 0.4 sec, where there is the vertical 1 st eigenvalue of major equipment/piping
4) Causing no uplift force for vertical and horizontal devices
Outline of proposal 3-dimensional isolation device
The proposed 3-dimensional isolation system is composed of a couple of Devices A and B as a unit,
shown in Fig. 1. As for the role of each device during earthquake, the horizontal seismic force is mainly applied to the laminated rubber bearing of Device A, and the vertical seismic force is mainly applied to the vertical isolation of Device B.
Device A is that laminated rubber bearing and coned disk springs are arranged in series. The coned disk springs on the rubber bearing are set in order to isolate from the vertical force. The horizontal shear force (Maximum: 2MN)
J
SMiRT 16, Washington DC, August 2001 Paper # 1015
derived from the superstructure during earthquake is lead to the rubber bearing through the vertical sliding center guide
of coned disk springs. By using the characteristics of coned disk spring as shown in attached graph of Fig. 1, the
slightly fluctuating axial force is applied to the rubber bearing.
Device B is that coned disk springs and roller bearing are arranged in series. The roller bearing is connected to
the superstructure by the vertical sliding center guide of coned disk springs. However the shear force applied to Device
B during earthquake is negligible, as the friction coefficient of the roller bearing is only 0.005.
The total vertical design load in the couple of Devices A and B is 9.8MN. A ratio of the design vertical loads in
the Devices A and B is determined based on the fluctuating vertical load during earthquake. Device B is able to cover
the fluctuating vertical loads.
Design specification for actual nuclear power plants
Based on the conditions for development, the results by a preliminary analysis for $2 earthquake, the specification of the vertical isolation is determined to be 1.8Hz for the spring rate, 10% for damping factor a n d - 6 0 r a m to +60mm for the stroke.
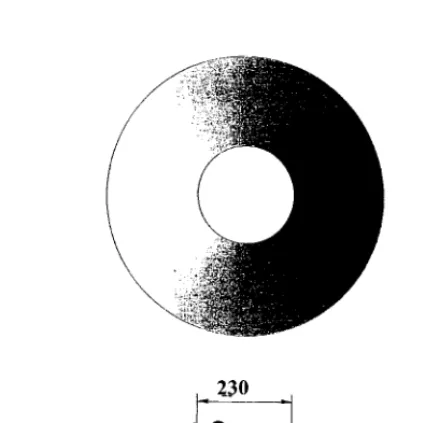
As shown in Fig. 2, the dimensions of the coned disk springs are 500ram in outer diameter, 230mm in inner
diameter, 14.7ram in thickness (t), 26.6mm in overall height and 11.9ram in dish height (h0). The size is determined
due to the manufacture and good dealing at maintenance. The material used for coned disk springs is SUP10 in
Japanese Industrial Standard, which is the same one as SAE 6150 in USA.
As the result of the trial design for the vertical isolation, the combinations of single coned disk stacking are the following.
Device A : 6 assemblies with 2 disks in parallel and 15 in series.
Device 13 : 6 assemblies with 11 disks in parallel and 12 in series.
The share ratio of vertical load (9.8MN/pair unit) in the Devices A and B is 17%(1.7MN) to 83%(8.1MN). In this
connection the fluctuating vertical load is 72% of total load.
Herein, as for the friction coefficient, which accounts for edge and inter-surface friction, since these values are
different from the coating specification, they should be investigated by test. And furthermore, though the disks with
h0/t=0.8 are used, it is necessary to verify the characteristics by test whether full height of h0 is available as the effective stroke or not.
9.8MN
~;,UJ.;L-.J
SPRING
I ROLLER BEAI~ING ii i ~ .~
/ / / / / ,, / / ,, ,, ,, ,, / / z " ' / / / / / / / / / / / : , ' / / 2 / i ' / , :
Device A Device B
Fig. 1 Illustration of 3-dimensional base isolation device
~_ 2_30
= 5 0 0 ... 14.7
Unit:mm Fig.2 Details of coned disk spring
TEST AND S I M U L A T I O N ANALYSES
Objective & Specimens
Static tests, which are elemental but in actual size, are conducted to investigate the characteristics of vertical
isolation device such as the load-displacement relationship. The friction coefficient for damping will be estimated by
The actual sizes of specimen are shown in Fig. 2. After presetting, the special coating (Molybdenum Disulfide) of disks is used for rust prevention, corrosion prevention and anti-wear out, which is the glaze coating with the lubricant solid-film.
P r o c e d u r e
Fig. 3 shows the loading schedule. The number of loading cycles is 16 in total with considering small amplitude
for small and semi-great earthquakes and large amplitude for great (ultimate) earthquake like $2 earthquake in Japan. The first cycle for setting (bottom-out) is to investigate the full stroke.
D i s p l a c e m e n t ( m m )
Setting ..$..1. ...
/|
+5*n Ill
...
9 10 11 12
i.~; ...
. . .
...
=============================
::::::::::::
:: :::::: : ::::::: :::::::::: : :: :::: ...
50°/(~Neutral), .... .2. .... .3. .... .4. . .
-5*n
Fig. 3 Loading Schedule(n • number of disks in series)
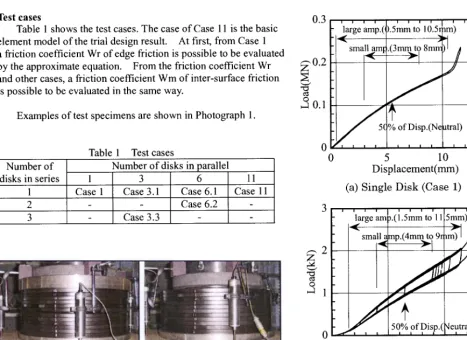
Test cases
Table 1 shows the test cases. The case of Case 11 is the basic
element model of the trial design result. At first, from Case 1
a friction coefficient Wr of edge friction is possible to be evaluated
by the approximate equation. From the friction coefficient Wr
and other cases, a friction coefficient Wm of inter-surface friction is possible to be evaluated in the same way.
Examples of test specimens are shown in Photograph 1.
Table 1 Test cases Number of
disks in series
Number of disks in parallel 11
1 Case 1 Case 3.1 Case 6.1 Case 11
2 - - Case 6.2 -
3 - Case 3.3 - -
0.3 ' I '
'large 'amp.(,).5nma to 10.5ram)
-0.2 -
- < )~
sma~_~,.(3mm,
~ [ t o
8mm y
% of Disp.(Ne atral)
i I I I I i i l
0 5 10
Displacement(mm)
o
~ 0 . 1
(a) Single D i s k (Case 1)
~ 2 -
O
! ! i !
large am
smai. ~
1
0 ~ " ~
("
1 ' ' ' I ' ' ' '~. .5mm to 11.5mm)
5o% ofpisp.(qeutral) , ,
0 5 10
Displacement(mm) (b) 11 Disks Stacked in parallel (Case 11)
15
15
Fig. 4 Typical Load-Displacement Curves
Test results
Typical load-displacement curves are shown Fig. 4. Since the stroke of disks measured to be about 1 l mm, it is
considered that the height of almost h0 is available as the effective stroke.
So the design stroke (-60mm to +60mm) in the case of 12 disks stacked in series is satisfied enough.
As for the surface of coating in the case of Case 11, it was observed that the coat was slightly wounded only at inside bearing flats after test.
However, the hysteresis behavior is considered to be very stable even if the coating was wounded.
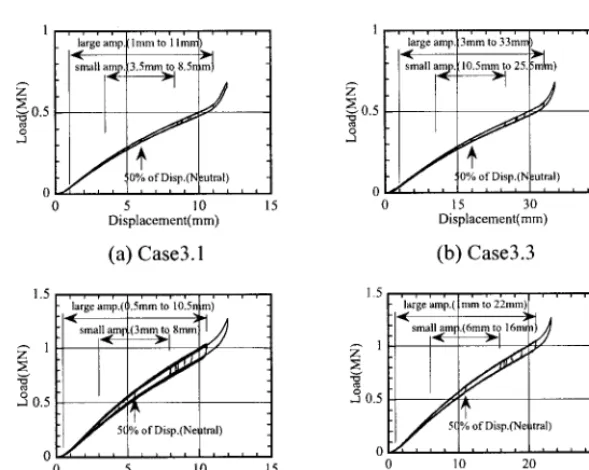
As for disks stacked in series, Fig. 5 shows the comparison of hysteresis loops between Case3.1 and 3.3 and between Case6.1 and 6.2, respectively.
In the case of disk stacked in series, the stroke is elongated in proportion to the number in series.
By the way, the vertical sliding center guide would be inevitably arranged in the case of disk stacked in series. Comparing between the test results of Case 3.1 and 3.2 and between Case6.1 and 6.2 respectively, the friction between the guide and disks is negligible in these tests.
1 , , , , , ,
large amp, I l m m ' t o '1 lmrc)
small , ~ ~ 8.5n ~mt
j
z~ 0 . 5
o ° • . ON o f Dlsp (Neutral)
0 ' '
0 5 10
Displacement(mm)
15 45
1 , , , , , , , , , , , , , large amp.(3mm to 33mm) , ~-~ "~.-J
small ; ~psi ~ o 25.~m~)
2
z~ 0 . 5
Oo • . 0 ¼ o f Drop (N mWai)
0 ~ . . . . .
0 15 30
Displacement(mm)
(a) Case3.1 (b) Case3.3
1.5
'large 'amp.((,.5mm to'10'.5n m) ' ' '
"-" 1 sma ~ - - ~ ' ( - ~ i 8mn~ ~
2 0.5
% of Disp.(Nel ttral)
0 l i , , , , , ,
0 5 10
Displacement(mm)
03
..-. 0.2 Z
~ 0 . 1
0
0 5 10
Displacement(mm)
(a) Single Disk (Case 1)
3
' ' ' C.o.Test(Casell) I i f ( i ( ( ( ( f i i l l
~ 2 •
,r
0
1.5 1. 'large amp.dmha to 22m'm)~ . . . .
l- smi
t~ o 5 ,
~ / t ° / ° ° f Disp.(Net tral )
0 | d l | | ! . . . . ' -- '
Displacement(mm)
0 5 10 15
15 0 10 20 30 Displacement(mm)
(c) Case6.1 (d) Case6.2
Fig. 5 Comparison of Hysteresis Loopsbetween Disks Stacked in Series
(b) 11 Disks Stacked in parallel (Case 11) Fig. 6 Comparison between
Curti-Orland and Test Results
Simulation Analyses
Fig. 6 shows the comparison between the approximate equation by Curti-Orland [ 1 ] and test results tor Case 1 and Case 11. In the case of n disks in parallel, the load-deflection curves at loading and unloading are calculated due to the equation by Niepage [2] with the function of friction coefficients.
It is possible to simulate the test results due to the equation by Curti-Orland, as the effect of friction according with the combination of disks stacking is able to be considered in these equations.
In this connection, the friction coefficients with best simulating test results are estimated to be Wr(edge)=0.085 and Wm(inter-face)=0.035 to 0.042.
As the design formula, the proposal approximate equation by Curti-Orland could be considered to be applicable to large-sized coned disk springs.
APPLICATION TO NUCLEAR P O W E R PLANTS
Analytical Conditions
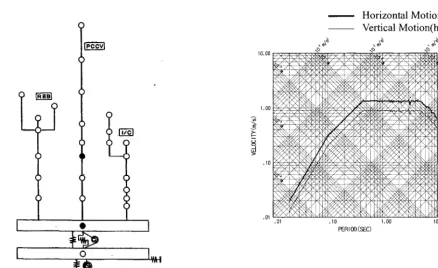
The soil building interaction model (shown in Fig.7) for horizontal and vertical seismic response analyses is subject to an imaginary 3-dimensional base-isolated nuclear power plant.
The dimensions of building are about 160m long and 100m width for the base-mat. The total weight of the superstructure is 6GN.
So about 600 couples of Devices A & B are installed in the isolation layer under the superstructure.
Fig. 8 shows the response spectra (h=5%) of the design earthquake $2. The vertical spectrum is related with 2/3times of the horizontal one. The input ground motions in both directions are the artificial motions with the same random phase.
The specification of the proposal 3-dimensional isolation system is the following.
1) Horizontal directions:
Initial period T 1 and isolation period T2 equal to 1.0sec.and 2.0sec. respectively, and the yield strength is 0.1W. (where W is the total weight of superstructure).
2) Vertical direction"
Initial period Tv equals to 0.56sec(fv=l.8Hz). loops.
The energy dissipation for damping is considered due to the hysteresis
I
t'?
- • I
l . . . . o I,:H
Horizontal Motion(h=5%) Vertical Motion(h-5%)
...,.~. . ?:.'.." v',.~, .* ,"..'. -. v." , . . . • . . . . ..--, .'L,..-, -...~ , ,:... )...., ....x, ,',t'
'!~:".,'~':.:" i'-.:"-,[':.i':~:-::~:,,i..';::,;-t:~-5,">'~ ",, " i'-:",,i"" ~:~9.:
. 1 0 1 ~ 5 " 5 " ' > " ~ " : " U " > : ~ " ; i " " ( : ~ . ~ _ . - : . : ! ~ = . : ! } : ~ ! ~ i i ~ i ) ! i ~ . ! : i ] . , . ' ~ , a : ' > ' ; < / ' , ~ : ' ' , £ , , , 7 , ' - : ' , i ' < ' - i l l i.~E.-'?.:,..".i-'..).~'.::-l.:{.a, ~ i i i.~.>
"..'..~. : >.': ...i;~.,'g:..2.F.. ",':," i ".-d..'.'i-'/;'.-,: "$'Lr¢-.'..;.( i :;,.'..'..',~.'. ~:;.~,
...>~,u.~ ,.'./. 2:.: r..¢, ;,~. "...:-U.~.F'-'." .-; X : :'.-,.'.:~,..'..~5~.Y'<.'-'. ..' >: }:,~:" > ~ "
• 01 • 10 1.00 1 0 . 0 0
PE~OO(SEC)
Fig. 7 Soil building interaction model Fig. 8 Response Spectra of Input Ground Motion
Fig. 9 shows the analysis model of the vertical isolation device, comparing with the curves based on the test results. The non-linearity at loading and unloading is considered in this model, being simulated by the Ramberg-Osgood model.
2 . 0 . . . ! . . . . 2 . 0
. . . ::__. ~ Analysis Model
i t i i i i i i i i t i i
5 0 1 0 0 1 5 0
Displacement(mm)
" .5
,..a 1.0
;~ 0 . 5 0
0 . 0 0
~ " 1.8
1.6
. . .
> 1.4
1.2 1 0 5
.i
"i
. . . Test
L i i i i i , i t
110 1
Displacement(mm)
(a) Hysteresis Loop (b) Detail Curves at unloading
Fig. 9 Comparison of Hysteresis Loop between test result and analysis model
Fig. 10 shows the details and location of the proposal 3-dimensional devices. for one couple of Devices A and B is 972.
(a) Device A
NN
m m l m . m
m l
r ~
3' (b) Device B
Fig. l0 Details and Location of 3-Dimensional Devices
Evaluation for Application
Fig. 11 shows the hysteresis behavior of the vertical isolation devices. The maximum responses of displacement
are 150mm in Device A and 125mm in Device B.
These responses are less than the ultimate displacement 165mm(=ll m m X 15) and 1 3 2 m m ( = l l m m X 12) respectively.
So it is confirmed that the seismic safety margin is secured for the uplift or setting.
2000 8000
~" 1500
2 lOOO
> 500
. . . . i . . . . I . . . . i . . . .
Ifiitial Displac:,ement Vertical'
Supported Load '
,' x . ~ ' IF _.~p:
" ~ , ' , d ~ , ~ ' - ,
' /
i
~" 6000
o o
o 4000
> 2000
0 . . . t . . . . I , , , , 0
0 50 100 150 200 0
Vertical D i s p l a c e m e n t ( m m )
(a) Device A
T T [ T
Vertical ]
S u p/ i p ° r tInitial D'isplacement ~ ~
50 100
Vertical D i s p l a c e m e n t ( m m )
(b) Device B
50
Fig. 11 Hysteresis Behavior of Vertical Isolation Devices.
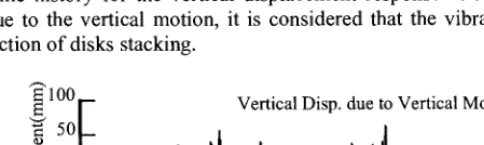
Fig. 12 shows the time history for the vertical displacement response at the isolation layer. As for the vertical
displacement response due to the vertical motion, it is considered that the vibrating off the origin at the beginning of responses is due to the friction of disks stacking.
E 1 0 0 _
E F Vertical Disp. due to Vertical Motion(l)
0
I - ' v v ' •
2-,0 l-
- I O O L _
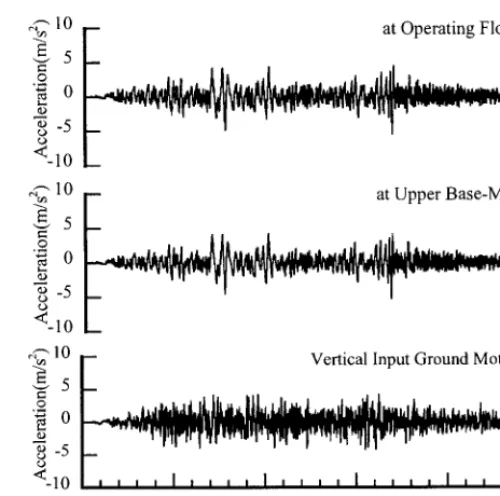
Fig. 13 shows the typical vertical building acceleration responses at the operation floor(EL23.9) and at the upper base mat(EL1.7), just on the vertical isolation device, comparing with the vertical input ground motion. The vertical building acceleration responses are reduced effectively for the input ground motion.
~ 510 ~ ~ ,i,ll latOperatingFl°°r
"~ 0 ~ I A '~-'~A"~"~' . . . . " ....
<-1o
,~10
r'qr. ~
o "= 0
-5
<-10
at Upper Base-Mat
~-~,10 ~ Vertical Input Ground Motion
- 5
O
<-101
. . . . I I i i i I i i i i I . . . . I i I l l I0 10 20 30 40 50
Time(sec) Fig. 13 Typical Time History for Vertical Acceleration Response.
Fig. 14 shows the typical vertical floor response spectra (FRS h=1%) at the operating, comparing with the case of the horizontal base isolated building without the vertical isolation.
At the beginning of development, it was worried that the friction behaviors of disks stacking would have influence on the equipment/piping response, as the friction behavior, which is the rigid non-linear characteristics, will excite the response in the short period range.
However, the response reduction effect on the design period of the equipment/piping is apparent.
100
¢"1o0
"~ 8o Z © 60 [.-
4o
.a 20 c..) <
0
[
Design r~nge o:f i i . . . . 3 - D I s o l a t i o n ( f v : l . 8 H z ) 2 D Isolatlon(fv 20Hz) / - ifiaj 6Ve@ip~iai/p~l~ii~g- 6t'-lSI~intg- ] . . . " =. . . • . . . . . . ~ I ' I
0.01 0.1 1
PERIOD(sec)
Fig. 14 Comparison of Typical Vertical FRS(h:I%) between 3-D Isolation and 2-D Isolation at Operating Floor. It is considered that the proposal 3-dimensional isolation system could be applicable to the nuclear plants.
CONCLUSION
We developed the 3-dimensional isolation system for whole building, which is composed of the laminated rubber bearings for the horizontal direction and the coned disk springs for the vertical direction.
However it is hoped that the various verification tests for the realization would be conducted.
References
1. Curti, G. und Orland, M.: Ein neues Berechnungsverfahren fur Tellerfedern, DRAHT 30-1, pp. 17-22, 1979