Volume 8, No. 5, May – June 2017
International Journal of Advanced Research in Computer Science RESEARCH PAPER
Available Online at www.ijarcs.info
Filter – PSO based approach for Feature Selection
Amit Saxena Dept. of CSIT
Guru Ghasidas Vishwavidyalaya Bilaspur, India
Madan Madhaw Shrivas Dept. of CSIT Guru Ghasidas Vishwavidyalaya
Bilaspur, India
Abstract: This paper presents a new approach to select reduced number of features in databases. Every database has a given number of features but it is observed that some of these features can be redundant and can be harmful as well as and can confuse the process of classification. The proposed method applies filter attribute measure and binary coded Particle Swarm optimization to select a small subset of features. The importance of these features is judged by applying K-nearest neighbor (KNN) method of classification. The best reduced subset of features which has high classification accuracy on given databases is adopted. The classification accuracy obtained by proposed method is compared with that reported recently in publications on Twenty eight databases. It is noted that proposed method performs satisfactory on these databases and achieves higher classification accuracy but with smaller number of features.
Keywords: Data Mining, Particle Swarm Optimization (PSO), K-nearest neighbor (KNN), Information Gain, Gain Ratio, ReliefF, Chi-Squared, Correlation Feature Selection (CFS), Classification, Feature selection, Leave-one-out cross validation (LOOCV).
I. INTRODUCTION
Nowadays due to growth of computer science and information industry the dimension of the database are increasing day by day in every organizations and institutions and produce highly dimension database/dataset. There is a problem in Highly Dimension [1] data creates the process of learning in data mining and machine learning task such as data analysis, information retrieval processing, and data/pattern classification process and it also make weak and slow the learning process. Since we know that the dataset design with features and instances in which some features are relevant and irrelevant. To identify these relevant and irrelevant features is very challenging task in generally research field. To solve this problem feature selection plays an important role to select the most relevant features and remove irrelevant, redundant features from feature space. In machine learning and data mining application includes feature selection [2] and classification [3] technique is used for data analysis and data identification process. This both technique are knows as the supervised technique. Feature selection is a preprocessing step that is used before classification process to computationally effective and efficient model. Feature selection techniques are used to identify the relevant features and remove irrelevant, redundant, noisy and harmful features from high dimension dataset or original set of features. It is also helpful to improve the classification performance, reduced computation time and deals understandable model. Supervised feature selection method include three types of searching strategies i.e. filter method [4], [5], [6], [7] wrapper methods [8], [9], [10] and embedded method. Filter methods select the most discriminative features with highest ranking from the dataset without using any learning algorithm. Wrapper method uses the intended learning/ classification algorithm itself to evaluate quality of important features. Embedded models perform features selection in the process of model construction [11]. Both wrapper and embedded are classifier dependent method. Feature selection is used in many applications such as machine learning [5], data mining [3],[6],[12] Pattern recognition [13] gene selection from microarray data [7] text categorization [14], multimedia information retrieval [15], [16], image processing [17], signal processing [18], and statistics [19], by using different feature
selection techniques to reduce the irrelevant and redundant features where there are huge amount of dataset and improve the classification accuracy of the model. Some author have also used various evolutionary computation (EC) technique for effectively solve feature selection problem which increase the optimization process. An example of these includes
Genetic Algorithms (GAs) [20],[21],[22] Genetic
programming (GP) [23], Particle Swarm Optimization (PSO) algorithms [24], Ant colony optimization (ACO) [25], Harmony search [26], Simulated Annealing (SA) [27], [28] and Differential Evolution (DE) [29].These techniques are well-known method and important for their good global search ability.
The main motive of this paper to reduce the dimension of the dataset to achieve the better classification accuracy with minimal number of features. In this paper we have proposed Filter-PSO based approach for feature selection called PSOFFS method. We choose new five popular filter based feature ranking and feature selection technique such as Information gain (InfoGainAttributeEval), Gain ratio (GainRatioAttributeEval), ReliefF (ReliefFAttributeEval), Chi-square (ChiSquaredAttributeEval), correlation feature selector (cfsSubsetEval) for select most relevant attributes from real – world dataset using weka (Waikato Environment for Knowledge Analysis) [30] software platform which select the top rank features based on its important and again particle swarm optimization (PSO) technique is used select the most informative feature with the K-nearest neighbor (KNN) wrapper method is used as a classifier to evaluate the classification accuracy of a particle. Some standard real – world datasets are selected to evaluate the proposed algorithm. The simulation results show that the proposed algorithm is superior in terms of both classification accuracy and computational performance.
the datasets with proposed model. In Section VII explanation and discussion of obtained results are provided. In the last Section VIII, conclusion of the whole paper is presented with future scope.
II. RELATED WORK
Recently, many authors have used different techniques for classification of data in which evolutionary algorithm are popularly used. They also used different feature selection techniques to reduce the number of features and enhance the efficiency performance of the models. A. Unler, A. Murat, [31] have proposed a discrete particle swarm optimization approach for feature selection in binary classification problems. L.-Yeh Chuang et al., [32] have presented catfish binary particle swarm optimization (CatfishBPSO) algorithm in which the catfish effect is applied to perform feature selection and improve the performance of binary particle swarm optimization (BPSO). The K-nearest neighbor (KNN) methods with Leave-one-out cross validation (LOOCV) was used to evaluate the quality of the solutions. CatfishBPSO was applied and compared to 10 classification problems taken from the literature. L. Chuang et al., [33] have presented a hybrid algorithm (CBPSOL) for selecting optimal feature subsets efficiently. This algorithm is based on CBPSO and local search. The 1-nearest neighbor (1-NN) method with leave-one-out cross-validation as a classier is used for evaluating classification accuracies. B. Sahu, D. Mishra, [34] have proposed a novel feature selection approach for the classification of high dimensional cancer microarray data, which used filtering technique such as signal to noise ratio (SNR) score and optimization technique as Particle swarm Optimization (PSO). K-nearest neighbor (KNN), Probabilistic Neural Network (PNN) and Support vector machines (SVM) are used as evaluators and leave one out cross validation approach is used for validation. M. Susana et al., [35] have proposed a modified binary particle swarm optimization (MBPSO) approach for feature selection with the simultaneous optimization of SVM kernel parameter setting, applied to mortality prediction in septic patients. H. Banka, S. Dara, [36] have presented a Hamming distance based binary PSO algorithm for feature selection and classification in gene expression data. The experimental results validate that the proposed HDBPSO performs better using Hamming distance as proximity measure for this problem. The experimental results on three benchmark datasets vis-á-vis colon cancer, defused B-cell lymphoma and leukemia data are evaluated by means of classification accuracies and validity indices as well. Indriyani et al., [9] have proposed a feature selection strategy based on Naive Bayes Multinomial (NBM), Genetic Algorithm (GA) and Particle Swarm Optimization (PSO) approach for Arabic Document Classification. G. Haixing , [37] have proposed a novel ensemble algorithm named of BPSO-Adaboost-KNN, which is designed to solve multiple class imbalanced data problems. This model use BPSO to select key feature of datasets so that the classifier can ignore more noise. Considering traditional classifiers gain a poor performance when facing imbalanced data, generate the Adaboost-KNN classifier by using boosting-by-resample strategy. Another contribute is in employing a novel measure AUC area as the criteria for selecting optimal sub-feature set. This metric not only has no bias toward the majority class are confuse to distinguish by analyzing the single AUC values. M. Masoud JAVIDI, N. EMAMI et al., [10] have proposed a wrapper feature selection algorithm for a classification that is based on chaos theory, binary particle swarm optimization, and
local search. In the proposed algorithm, the nearest neighbor algorithm is used for the evaluation phase. A. Moayedikia et al., [26] have introduces a novel feature selection approach called SYMON which uses symmetrical uncertainty and harmony search for high dimensional imbalanced class datasets. SYMON has a two stage algorithm, the first stage, feature weighting, measures the features' weights (or importance). In the second stage, known as feature selection, the top k features are selected based on their weights. W. Srisukkham et al., [38] proposed two modified BBPSO algorithms for feature optimization to enhance intelligent decision support system for acute lymphoblastic leukaemia (ALL) classification. S. Kar et al., [39] proposed a PSO adaptive KNN based gene selection technique to distinguish a small subset of useful genes that are sufficient for the desired classification purpose of microarray data and also proposed a heuristic for selecting the optimal values of K efficiently, guided by the classification accuracy. This proposed technique of finding minimum possible meaningful set of genes is applied on three benchmark microarray datasets, namely the small round blue cell tumor (SRBCT) data, the acute lymphoblastic leukemia (ALL) and acute myeloid leukemia (AML) data and the mixed-lineage leukemia (MLL) data. A. Saxena et al., [40] have proposed four approaches for feature selection in an unsupervised manner by using genetic algorithms. These methods do not use the class label information but select a set of features using a task independent criterion that can preserve the geometric structure (topology) of the original data in the reduced feature space. These approaches are tested on six real data sets with dimensionality varying between 9 and 60. The selected features are found to be excellent in terms of preservation topology (inter-point geometry), cluster structure and classifier performance.
III. PRELIMINARIES
A. Particle Swarm Optimization
Initialize population
While (number of generations, or the stopping criterion is not met)
For p = 1 to number of particles
If the fitness of Xp is greater than the fitness of Pbestp then Update pbestp = Xp
For k ∈ Neighborhood of Xp
If the fitness of Xk is greater than that of gbest then Update gbest =Xk
Next k
For each dimension d
vpdnew = w × vpdold + c1× rand1×�pbestpd− xpdold� + c2× rand2 × (gbestd− xpdold)
If vpd ∉ ( Vmin, Vmax) then
vpd = max(min� Vmax, vpd�, Vmin )
xpd = xpd+ vpd
Next d Next p
Next generation until stopping criterion
vpdnew and vpdold are the particle velocities, xpdold is the
current particle position (solution), and xpdnew is the updated particle position (solution). The values pbestpd and g
bestd are defined as stated above. The two factors rand1 and
rand2 are random numbers between (0, 1), whereas c1 and c2
= 2 are acceleration factors, usually c1 = c2 = 2. Particle
velocities of each dimension are tried to a maximum velocity Vmax. If the sum of velocities causes the total velocity of that
dimension to exceed Vmax, then the velocity of that
dimension is limited to Vmax.Vmax
Based on the rules of particle swarm optimization, we set the required particle number first, and then the initial coding alphabetic string for each particle is randomly produced. In our case we coded each particle to imitate a chromosome in a genetic algorithm; each particle was coded to a binary alphabetic string S = F
is a user-specified parameter.
1, F2…….….Fn, n=1, 2………..m; the
bit value {1} represents a selected feature, whereas the bit value {0} represents a non-selected feature. The adaptive functional values were data based on the particle features representing the feature dimension; this data was classified by a KNN to obtain classification accuracy; the KNN serves as an evaluator of the PSO fitness function. For example,
when a 10-dimensional data set (n=10) Sn =
(F1F2F3F4F5F6F7F8F9F10) is analyzed using particle swarm
optimization to select features, we can select any number of features smaller than n, i.e. we can chose a random 6 features, here Sn = (F1F3F5F7F9F10). When the adaptive
value is calculated, these 6 features in each data set represent the data dimension and are evaluated by the KNN. The fitness value for the KNN evolves according to the K-fold Cross-Validation Method [42], [43] for small sample sizes and according to the Leave-one-out cross validation (LOOCV) Method [42], [43] for big sample sizes. Using the K-Fold Cross-Validation Method, we separated the data into 10 parts {D1, D2 ……..D10}, and carried out training and
testing a total of 10 times. If every part Dn
Each particle renewal is based on its adaptive value. The best adaptive value for each particle renewal is pbest, and the best adaptive value within a group of pbest is gbest. Once pbest and gbest are obtained, we can keep track of the features of pbest and gbest particles with regard to their position and speed. In this study, a binary version of a PSO algorithm is used for particle swarm optimization [44]. The position of each particle is given in a binary string form that represents the feature selection situation. Each particle is updated according to the following equations.
, n=1, 2 …10 is processed as a test set, the other 9 parts will be training sets.
Following 10 times of training and testing, 10 classification accuracies are produced, and the averages of these 10 accuracies are used as the classification accuracy for the data set. When the LOOCV Method is used, the data can be divided into two parts, a training set part, which contains a larger amount of data, and a test set part, which contains relatively fewer data. We assumed that the obtained classification accuracy is an adaptive functional value.
vpdnew = w × vpdold + c1× rand1×�pbestpd− xpdold� + c2× rand2 × (gbestd− xpdold) (1)
S(vpdnew) = 1+𝒆𝒆−𝑣𝑣1
𝑝𝑝𝑝𝑝𝑛𝑛𝑛𝑛𝑛𝑛 (2)
If (rand<S (vpdnew)) then xpdnew = 1; else xpdnew = 0 (3)
The feature after renewal is calculated by the function S(vpdnew) (Eq. 2), in which the speed value is vpdnew. If S(vpdnew) is larger than a randomly produced disorder number that is within (0, 1), then its position value Fn, n=1, 2
….m is represented as {1} (meaning this feature is selected as a required feature for the next renewal). If S (vpdnew) is smaller than a randomly produced disorder number that is within {0~1}, then its position value Fn
B. Information Gain
, n=1, 2 … m is represented as {0} (meaning this feature is not selected as a required feature for the next renewal).
The Information Gain filter is one of the most popular univariate methods of evaluating attributes. This filter evaluates the features according to their Information Gain and consults a single feature at a time. It provides an orderly classification of all the features, and then a threshold is required to select a certain number of them according to the order obtained [45], [46], [48].
C. Gain Ratio
Gain ratio is aim to maximize the information gain of feature and minimize the number of its value. Gain ratio is the ratio between the information gain and intrinsic value defined as the following equation (4).
Gain Ratio = 𝛥𝛥𝑖𝑖𝑛𝑛𝑖𝑖𝑖𝑖 − ∑ ⃒𝐶𝐶𝑣𝑣⃒
⃒𝐶𝐶⃒log2 ⃒𝐶𝐶𝑣𝑣⃒
⃒𝐶𝐶⃒ 𝑘𝑘
𝑗𝑗=1
(4)
Where C is a collection of samples and Cv is the subset of collection C for attribute which has the value of v. k is the number of attribute values, information gain of features
𝛥𝛥𝑖𝑖𝑛𝑛𝑖𝑖𝑖𝑖= Entropy(C) − ∑ ⃒𝐶𝐶𝑣𝑣⃒
⃒𝐶𝐶⃒Entropy𝑐𝑐𝑣𝑣 𝑘𝑘
D. ReliefF
The filter ReliefF is an extension of the original Relief algorithm. The original Relief works by randomly sampling an instance from the data and then locating its nearest neighbor from the same and opposite classes. The values of the attributes of the nearest neighbors are compared to the sampled instance and used to update relevance scores for each attribute. The rationale is the useful attribute should differentiate between instances from different classes and have the same value for instances from the same class. ReliefF adds the ability of dealing with multiclass problems and is also more robust and capable of dealing with incomplete and noisy data. This approach may be applied in all situations has low bias, includes interaction among features and may capture local dependencies which other method miss [5], [46], [49].
E. Chi-Squared
Chi-Squared attribute evaluation evaluates a feature by computing the chi-squared statistic of the feature with respect to the class label. First the hypothesis H0
Where O
is assumed as the two features are unrelated. Then it is tested using the following equation (5).
𝑋𝑋2=� �(𝑂𝑂𝑖𝑖𝑗𝑗 − 𝐸𝐸𝑖𝑖𝑗𝑗)2 𝐸𝐸𝑖𝑖𝑗𝑗 c
j=1 r
i=1
(5)
ij is the observed frequency and Eij is the
expected (theoretical) frequency, the larger the value of 𝑋𝑋2 is, the more evidence to show that the hypothesis H0
F. Correlation based feature selection (CFS)
is true, [48], [50]
Correlation feature selection (CFS) is a simple type of multivariate filter algorithm that ranks feature subsets according to a correlation based heuristic evaluation function. The bias of the evaluation function is toward subsets that consist of features that are highly correlated with the class and uncorrelated with each other, so redundant and irrelevant features should be screened out [4], [46], [48].
G. K-nearest neighbour (KNN) method
K-nearest neighbor (KNN) are used as a classifier for classification purpose in machine learning, data mining and pattern recognition, which use distance metrics to predict those classes of instances that still are not seen. It is also known as “instance based learning” and “lazy learner”. In this approach an object is classified by a majority vote of its neighbors, with the object being assigned to the class most common amongst its k nearest neighbors (where k is some user specified constant). If k=1 then the object is simply assigned to the class of the single nearest neighbor. This approach is more suitable for numerical data; also it can deal with discrete value [46].
IV. PROPOSED METHOD
In this paper, we have proposed the Filter-PSO based approach for feature selection method with Leave-one-out cross validation (LOOCV) [42], [43] to improve the classification accuracy of supervised data set i.e. the datasets that contain classes. In both, the training set and the test set, K-nearest neighbor (KNN) technique with n fold cross-validation is employed to evaluate the classification accuracy. Firstly we use some popular ranking based filter attribute selection method, search for new informative features already available in Weka data mining tools such as
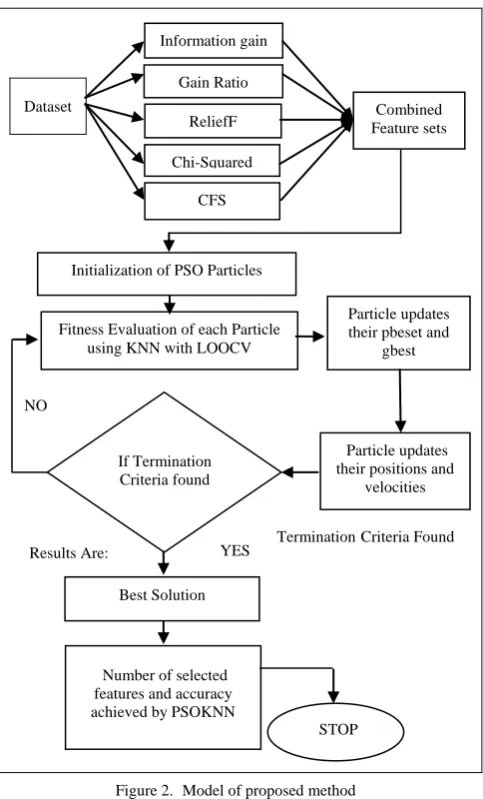
Information Gain, Gain Ratio, ReliefF, Chi-Squared, Correlation Feature Selection (CFS) and secondly we apply particle Swarm optimization for feature selection with KNN classification evaluator. In this process, we have first used the features of 28 datasets of UCI and KEEL repository then ranked the features of datasets using above five attribute selection methods. We have selected the most important top ranked features (like 10%, 20% or so on) of the dataset and combined these selected features of dataset in one set. Hence we find best new features sub set (a reduced feature set) by using different ranking based feature method We again apply the PSO feature selection technique on the new optimized set to achieve the better classification accuracy with even smaller feature subset. In this process first initialize randomly each particle by filling 0 or 1 in each of its dimension to represent presence of a feature (1) or absence of a feature (0). Number of dimensions (n) in each particle is equal to number of features in dataset. The value of each dimension is checked if it is 1 then corresponding feature is collected and kept in an array. In this manner a subset of features is obtained. Now this subset of features makes a reduced dataset and its goodness is checked using KNN classifier with LOOCV techniques. This process is repeated for every particle in the population. The best particle (i.e. a particle that gives best classification accuracy) is retained after running PSO for a given number of updating using selections of pbest and gbest operations of PSO or when satisfactory classification accuracy is obtained. Figure 1 shows the complete algorithm for the proposed method and Figure 2 shows model for the proposed method.
Accuracy = No . of samples correctly classified in test data
Total no .of samples in the test data × 100% (6)
D [m, n] (Where m number of patterns, n number of features)
// use filter based attribute selection measure (Information Gain, Gain Ratio, ReliefF, Chi-Squared, Correlation based feature selection(CFS)
// Combined feature set D [m, n] (Where m number of patterns, n number of features)
// use Particle Swarm Optimization for feature selection and KNN as classifier to evaluate goodness of each particle
Initialize particles randomly with binary value at each particle (number of particle is equal to number of features)
For 1: number of iteration
Calculate fitness of each particle using K NN classifier
(With LOOCV cross validation technique) Particle updates their positions and velocities using two operator
Select pbest Select gbest End
Finally we get accuracy and minimum number of features
Figure 1. Algorithm for proposed method
V. DATASETS
repository [51] and the KEEL dataset repository [52]. Table I. contains S.No., Dataset name, total number of features (excluding class attributes), total number of instances (records or rows), Missing values, total number of Classes and the corresponding repository. Table I. has Twenty eight datasets namely Audiology, Dermatology, Spambase, Arrhythmia, Ionosphere etc. For each dataset, we carried out a Leave one out cross validation. The outline of these databases can be seen in Table I.
Figure 2. Model of proposed method
VI. EXPERIMENTS
We performed our experiments on Intel i5 Processor with 4 GB RAM and 500 GB hard disk. MATLAB is used for development of code and experiment. Also PSO MATLAB code [53] is used for this study. In this paper first we have used some standard attribute selection measure such as InformationGain, GainRatio, ReliefF, Chi-square, Correlation based attribute evaluator to predict the most relevant features available in the Weka Software version 3.6 .12 [30],[54]. We have converted the datasets into csv file then this file was loaded into Weka explorer. We used leave one out cross validation technique to obtain robust classification accuracy. In this method the whole reduced dataset (combined features set) is decomposed in ten folds each having equal number of patterns (the last fold having remaining number of patterns if number of patterns is not a multiple of 10). One of these ten folds is used for testing while all other are used in training phase. Average of
accuracy obtained on each fold gives accuracy of our model. In this experiment we performed KNN classifier with Particle Swarm optimization based experiment.
VII. RESULTS AND DISCUSSION
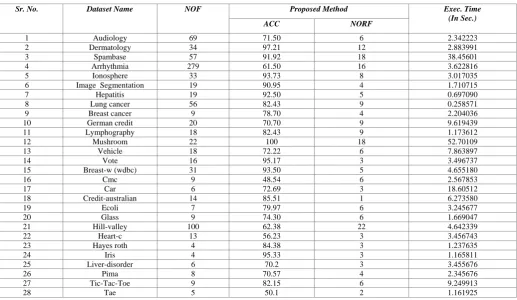
The proposed method is applied over the datasets listed in the Table I. Results of the experiment are displayed in the Table II. Table II has five columns. As shown in Table II. For PSOFFS method, Audiology dataset reduces to 6 relevant features out of 69 features and classification accuracy is 71.50. Dermatology dataset has 12 relevant features out of total 34 numbers of features and classification accuracy is 97.21. Spambase dataset has 18 selected features out of 57 numbers of features and classification accuracy is 91.92. Arrhythmia dataset has 16 selected features out of 279 features and classification accuracy is 61.50. Ionosphere dataset has 8 selected features out of 33 features and classification accuracy is 93.73. Image Segmentation dataset has 4 selected features out of 19 features and classification accuracy is 90.95. Hepatitis dataset has 5 selected features out of 19 features and classification accuracy is 92.50. Lung cancer dataset has 9 selected features out of 56 features and classification accuracy is 82.43. Breast cancer dataset has 4 selected features out of 9 features and classification accuracy is 78.70. German credit dataset has 9 selected features out of 20 features and classification accuracy is 70.70. Lymphography dataset has 9 selected features out of 18 features and classification accuracy is 82.43. Mushroom dataset has 18 selected features out of 22 features and classification accuracy is 100. Vehicle dataset has 6 selected features out of 18 features and classification accuracy is 72.22. Vote dataset has 3 selected features out of 16 features and classification accuracy is 95.17. Breast-w dataset has 5 selected features out of 31 features and classification accuracy is 93.50. Cmc dataset has 6 selected features out of 9 features and classification accuracy is 48.54. Car dataset has 3 selected features out of 6 features and classification accuracy is 72.69. Credit-Australian dataset has 1 selected feature out of 14 features and classification accuracy is 85.51. Ecoli dataset has 6 selected features out of 7 features and classification accuracy is 79.97. Glass dataset has 6 selected features out of 9 features and classification accuracy is 74.30. Hill-valley dataset has 22 selected features out of 100 features and classification accuracy is 62.38. Heart-c dataset has 3 selected features out of 13 features and classification accuracy is 56.23. Hayes-roth dataset has 3 selected features out of 4 features and classification accuracy is 84.38 Iris dataset has 3 selected features out of 4 features and classification accuracy is 95.33. Liver-disorder dataset has 3 selected features out of 6 features and classification accuracy is 70.2. Pima dataset has 4 selected features out of 8 features and classification accuracy is 70.57. Tic-Toc-Toe dataset has 6 selected features out of 9 features and classification accuracy is 82.15. tae dataset has 2 selected features out of 5 features and classification accuracy is 50.1.
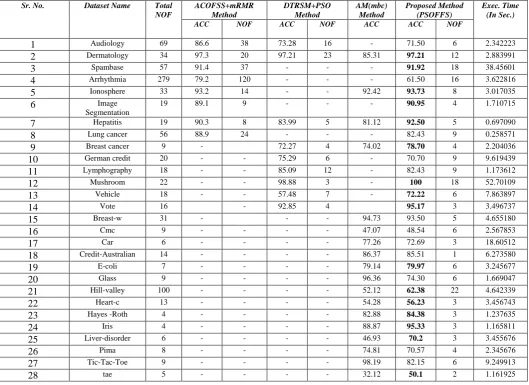
In Table III we compared results obtained by proposed method with the results obtained by other methods. Table III has eight columns, First column contains S.No., Second column contains dataset name, third column contains total number of features, Fourth column divided in two column which contains accuracy and number of features obtained by ACOFSS+mRMR method [55]. Fifth column divided in two columns which contains accuracy and number of features obtained by DTRSM+PSO method [56]. Sixth column contains accuracy obtained by AM (mbc) method [57]; Seventh column is also divided in two columns for accuracy
Dataset
CFS
Information gain
Gain Ratio
Combined Feature sets
Initialization of PSO Particles
Fitness Evaluation of each Particle using KNN with LOOCV
NO
Particle updates their pbeset and
gbest
Particle updates their positions and
velocities If Termination
Criteria found
YES
Number of selected features and accuracy achieved by PSOKNN
Best Solution
STOP
Termination Criteria Found Results Are:
ReliefF
[image:5.595.42.284.160.560.2]Table I. A Brief Description of the Datasets Used in This Experiment
Sr. No. Dataset Name NOF NOI MV NOC Data Source
1 Audiology 69 226 No 24 UCI
2 Dermatology 34 358(366) Yes 6 Keel
3 Spambase 57 4597 No 2 Keel
4 Arrhythmia 279 452 No 16 UCI
5 Ionosphere 33 351 No 2 Keel
6 Image
Segmentation
19 2310 No 7 UCI
7 Hepatitis 19 80(155) Yes 2 Keel
8 Lung cancer 56 32 No 3 UCI
9 Breast cancer 9 277(286) Yes 2 Keel
10 German credit 20 1000 No 2 Keel
11 Lymphography 18 148 No 4 Keel
12 Mushroom 22 5644(8124) Yes 2 Keel
13 Vehicle 18 846 No 4 Keel
14 Vote 16 232(435) Yes 2 Keel
15 Breast-w 31 569 No 2 UCI
16 Cmc 9 1473 No 3 Keel
17 Car 6 1728 No 4 Keel
18 Credit-australian 14 690 No 2 Keel
19 Ecoli 7 336 No 8 Keel
20 Glass 9 214 No 7 Keel
21 Hill-valley 100 606 Yes 2 UCI
22 Heart-c 13 297(303) No 5 Keel
23 Hayes-roth 4 160 No 3 Keel
24 Iris 4 150 No 3 Keel
25 Liver-disorder 6 345 No 2 Keel
26 Pima 8 768 No 2 Keel
27 Tic-Tac-Toe 9 958 No 2 Keel
28 Tae 5 151 No 3 Keel
NOF: Number of features, NOI: Number of instances, MV: Missing Value, NOC: Number of class
Table II Classification accuracy ( in percentage) and number of features selected by respective model for proposed method (PSOFFS)
Sr. No. Dataset Name NOF Proposed Method Exec. Time
(In Sec.)
ACC NORF
1 Audiology 69 71.50 6 2.342223
2 Dermatology 34 97.21 12 2.883991
3 Spambase 57 91.92 18 38.45601
4 Arrhythmia 279 61.50 16 3.622816
5 Ionosphere 33 93.73 8 3.017035
6 Image Segmentation 19 90.95 4 1.710715
7 Hepatitis 19 92.50 5 0.697090
8 Lung cancer 56 82.43 9 0.258571
9 Breast cancer 9 78.70 4 2.204036
10 German credit 20 70.70 9 9.619439
11 Lymphography 18 82.43 9 1.173612
12 Mushroom 22 100 18 52.70109
13 Vehicle 18 72.22 6 7.863897
14 Vote 16 95.17 3 3.496737
15 Breast-w (wdbc) 31 93.50 5 4.655180
16 Cmc 9 48.54 6 2.567853
17 Car 6 72.69 3 18.60512
18 Credit-australian 14 85.51 1 6.273580
19 Ecoli 7 79.97 6 3.245677
20 Glass 9 74.30 6 1.669047
21 Hill-valley 100 62.38 22 4.642339
22 Heart-c 13 56.23 3 3.456743
23 Hayes roth 4 84.38 3 1.237635
24 Iris 4 95.33 3 1.165811
25 Liver-disorder 6 70.2 3 3.455676
26 Pima 8 70.57 4 2.345676
27 Tic-Tac-Toe 9 82.15 6 9.249913
28 Tae 5 50.1 2 1.161925
Table III Comparison of accuracy obtained by different methods
Sr. No. Dataset Name Total
NOF
ACOFSS+mRMR Method
DTRSM+PSO Method
AM(mbc) Method
Proposed Method (PSOFFS)
Exec. Time (In Sec.)
ACC NOF ACC NOF ACC ACC NOF
1 Audiology 69 86.6 38 73.28 16 - 71.50 6 2.342223
2 Dermatology 34 97.3 20 97.21 23 85.31 97.21 12 2.883991
3 Spambase 57 91.4 37 - - - 91.92 18 38.45601
4 Arrhythmia 279 79.2 120 - - - 61.50 16 3.622816
5 Ionosphere 33 93.2 14 - - 92.42 93.73 8 3.017035
6 Image
Segmentation
19 89.1 9 - - - 90.95 4 1.710715
7 Hepatitis 19 90.3 8 83.99 5 81.12 92.50 5 0.697090
8 Lung cancer 56 88.9 24 - - - 82.43 9 0.258571
9 Breast cancer 9 - 72.27 4 74.02 78.70 4 2.204036
10 German credit 20 - - 75.29 6 - 70.70 9 9.619439
11 Lymphography 18 - - 85.09 12 - 82.43 9 1.173612
12 Mushroom 22 - - 98.88 3 - 100 18 52.70109
13 Vehicle 18 - - 57.48 7 - 72.22 6 7.863897
14 Vote 16 - 92.85 4 95.17 3 3.496737
15 Breast-w 31 - - - 94.73 93.50 5 4.655180
16 Cmc 9 - - - - 47.07 48.54 6 2.567853
17 Car 6 - - - - 77.26 72.69 3 18.60512
18 Credit-Australian 14 - - - - 86.37 85.51 1 6.273580
19 E-coli 7 - - - - 79.14 79.97 6 3.245677
20 Glass 9 - - - - 96.36 74.30 6 1.669047
21 Hill-valley 100 - - - - 52.12 62.38 22 4.642339
22 Heart-c 13 - - - - 54.28 56.23 3 3.456743
23 Hayes -Roth 4 - - - - 82.88 84.38 3 1.237635
24 Iris 4 - - - - 88.87 95.33 3 1.165811
25 Liver-disorder 6 - - - - 46.93 70.2 3 3.455676
26 Pima 8 - - - - 74.81 70.57 4 2.345676
27 Tic-Tac-Toe 9 - - - - 98.19 82.15 6 9.249913
28 tae 5 - - - - 32.12 50.1 2 1.161925
NOF: Number of features, ACC: Accuracy, Exec. Time: Execution Time and The bold value denote the highest value of proposed method
and number of features obtained by proposed method PSOFFS and eight column contains experiment execution time (in seconds). In case of Audiology dataset, the classification accuracy obtained by the proposed method PSOFFS is 71.50 (6) and it is compared with accuracy 86.6 (38) obtained by ACOFSS+mRMR proposed by A. Khan & A. Rauf Baig [55] and accuracy 73.28 (16) obtained by DTRSM+PSO proposed by S. Chebrolu, G. Sriram Sanjeevi [56] where values in brackets () shows number of features used to obtain this accuracy i.e. c_a(r_n) means classification accuracy obtained using r_n number of features. In case of Dermatology dataset, the classification accuracy obtained by the proposed method PSOFFS is 97.21 (12) and it is
compared with accuracy 97.3(20) obtained by
ACOFSS+mRMR method proposed by A. Khan & A. Rauf Baig [55], accuracy 97.21 (23) obtained by DTRSM+PSO methods proposed by S. Chebrolu, G. Sriram Sanjeevi [56] and accuracy 85.31 () obtained by AM (mbc) methods proposed by Z. Liang et al. [57] where values in brackets () shows number of features used to obtain this accuracy i.e. c_a(r_n) means classification accuracy obtained using r_n number of features. In the case of Spambase dataset the classification accuracy obtained by the proposed method PSOFFS is 91.92 (18) and it is compared with accuracy 91.4 (37) obtained by ACOFSS+mRMR method proposed by A. Khan & A. Rauf Baig [55] where values in brackets ( ) shows number of features used to obtain this accuracy i.e.
[image:7.595.34.564.87.472.2]Khan & A. Rauf Baig [55], accuracy 83.99 (5) obtained by DTRSM+PSO methods proposed by S. Chebrolu, G. Sriram Sanjeevi [56] and accuracy 81.12 obtained by AM (mbc) methods proposed by Z. Liang et al. [57] where values in brackets ( ) shows number of features used to obtain this accuracy i.e. c_a(r_n) means classification accuracy obtained using r_n number of features. In case of Lung cancer dataset the classification accuracy obtained by the proposed method PSOFFS is 82.43 (9) and it is compared with accuracy 88.9 (24) obtained by ACOFSS+mRMR method proposed by A. Khan & A. Rauf Baig [55] where values in brackets ( ) shows number of features used to obtain this accuracy i.e. c_a(r_n) means classification accuracy obtained using r_n number of features. In case of Breast cancer dataset the classification accuracy obtained by the proposed method PSOFFS is 78.70 (4) and it is compared with accuracy 72.27 (4) obtained by DTRSM+PSO methods proposed by S. Chebrolu, G. Sriram Sanjeevi [56] and accuracy 74.02 obtained by AM (mbc) methods proposed by Z. Liang et al. [57] where values in brackets ( ) shows number of features used to obtain this accuracy i.e. c_a(r_n) means classification accuracy obtained using r_n number of features. In case of German credit dataset the classification accuracy obtained by the proposed method PSOFFS is 70.70 (9) and it is compared with accuracy 75.29 (6) obtained by DTRSM+PSO methods proposed by S. Chebrolu, G. Sriram Sanjeevi [56] where values in brackets () shows number of features used to obtain this accuracy i.e. c_a(r_n) means classification accuracy obtained using r_n number of features. In case of Lymphography dataset, the classification accuracy obtained by the proposed method PSOFFS is 82.43 (9) and it is
compared with accuracy 85.09 (12) obtained by
DTRSM+PSO methods proposed by S. Chebrolu, G. Sriram Sanjeevi [56] where values in brackets ( ) shows number of features used to obtain this accuracy i.e. c_a(r_n) means classification accuracy obtained using r_n number of features. In case of Mushroom dataset, the classification accuracy obtained by the proposed method PSOFFS is 100 (18) and it is compared with accuracy 98.88 (3) obtained by DTRSM+PSO methods proposed by S. Chebrolu, G. Sriram Sanjeevi [56] where values in brackets ( ) shows number of features used to obtain this accuracy i.e. c_a(r_n) means classification accuracy obtained using r_n number of features. In case of Vehicle dataset, the classification accuracy obtained by the proposed method PSOFFS is 72.22 (6) and it is compared with accuracy 57.48 (7) obtained by DTRSM+PSO methods proposed by S. Chebrolu, G. Sriram Sanjeevi [56] where values in brackets ( ) shows number of features used to obtain this accuracy i.e. c_a(r_n) means classification accuracy obtained using r_n number of features. In case of vote dataset, the classification accuracy obtained by the proposed method PSOFFS is 95.17 (3) and it is compared with accuracy 92.85 (4) obtained by DTRSM+PSO methods proposed by S. Chebrolu, G. Sriram Sanjeevi [56] where values in brackets ( ) shows number of features used to obtain this accuracy i.e. c_a(r_n) means classification accuracy obtained using r_n number of features .In case of Breast-w dataset the classification accuracy obtained by the proposed method PSOFFS is 93.50 (5) and it is compared with accuracy 94.73 obtained by AM (mbc) methods proposed by Z. Liang et al. [57] where values in brackets ( ) shows number of features used to obtain this accuracy i.e. c_a(r_n) means classification accuracy obtained using r_n number of features. In case of Cmc dataset, the classification accuracy obtained by the proposed method PSOFFS is 48.54 (6) and it is compared with accuracy 47.07 ( ) obtained by AM (mbc) methods proposed by Z. Liang et
using r_n number of features. In case of Tic-Tac-Toe dataset, the classification accuracy obtained by the proposed method PSOFFS is 82.15 (6) and it is compared with accuracy 98.19 obtained by AM (mbc) methods proposed by Z. Liang et al., [57] where values in brackets ( ) shows number of features used to obtain this accuracy i.e. c_a(r_n) means classification accuracy obtained using r_n number of features. In case of tae dataset, the classification accuracy obtained by the proposed method PSOFFS is 50.1 (2) and it is compared with accuracy 32.12 obtained by AM (mbc) methods proposed by Z. Liang et al., [57] where values in brackets ( ) shows number of features used to obtain this accuracy i.e. c_a(r_n) means classification accuracy obtained using r_n number of features.
[image:9.595.317.555.55.239.2]It is evident that the classification accuracy obtained by proposed method on Twenty eight datasets is better than that obtained by other methods as shown in Table III. The results by the proposed method are shown as par with the
Figure 3. Graphical representation for Comparison of accuracy obtained
[image:9.595.41.277.260.441.2]by ACOFSS+mRMR and PSOFFS
Figure 4. Graphical representation for Comparison of accuracy obtained
[image:9.595.316.562.476.682.2]by DTRSM+PSO and PSOFFS
Figure 5. Graphical representation for Comparison of accuracy obtained
by AM(mbc) and PSOFFS
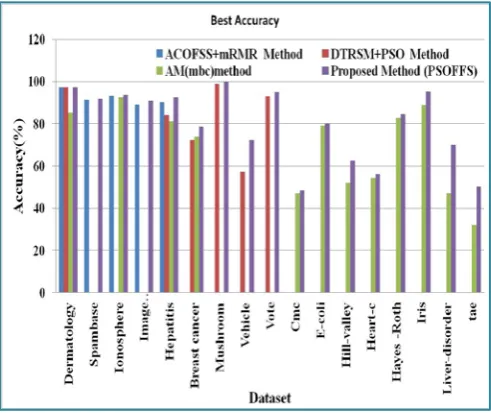
others in the graph chart as well in Figure 3, Figure 4, Figure 5 and Figure 6. The classification accuracy obtained by proposed method is shown by Figure 3 in a green bar and it is taller in each of the eight dataset compared to other methods shown by blue (ACOFSS+mRMR method) color. The classification accuracy obtained by proposed method is shown by Figure 4 in a green bar and it is taller in each of the nine dataset compared to other methods shown by red (DTRSM+PSO method) colors. The classification accuracy obtained by proposed method is shown by Figure 5 in a green bar and it is taller in each of the eighteenth dataset compared to other methods shown by purpal (AM (mbc) method) colors. The best classification accuracy obtained by proposed method is shown by Figure 6 in a purple bar and it is taller in each of the seventeenth datasets compared to other methods
shown by blue (ACOFSS+mRMR method), red
(DTRSM+PSO method), and green (AM (mbc) colors.
Figure 6. Graphical representation for Comparison of accuracy obtained
[image:9.595.37.272.484.669.2]VIII. CONCLUSION
In this paper, a new approach is presented to select small number of features from various databases. The leave one out cross validation (LOOCV) approach checks the performance of subset of features by taking one folder for testing due to cross validation. In this manner the performance of subset of features on each pattern is evaluated. The Audiology, Dermatology, Spambase, Arrhythmia, Ionosphere, Image Segmentation, Hepatitis, Lung cancer, Breast cancer, German credit, Lymphography, Mushroom, Vehicle, Housevotes (Vote), Breast-w, contraceptive (Cmc), Car, Credit-australian, E-coli, Glass, Hill-valley, Heart-c, Hayes-roth, Iris, Liver-disorder, Pima , Tic-Toc-Toe , Teaching Assistant Evaluation (tae), datasets are used for validation of proposed method. In each case, the classification accuracy which is taken as the measure of goodness of subset of features comes higher than the accuracy claimed by other recently reported techniques. Thus the LOOCV based feature selection method can be applied as another approach to select features. The databases used here have a moderate dimensions, it will be interesting to see the performance of the proposed method on high dimensional databases with other evolutionary algorithms.
IX. REFERENCES
[1] M. Raymer, W. Punch, E. Goodman, L. Kuhn, A. Jain, “Dimensionality reduction using genetic algorithms,” IEEE Trans. Evol. Comput.vol.4, No. 2, pp. 164-171, July 2000. [2] B. Rajen Bhatt, M. Gopal, “On fuzzy-rough sets approach to
feature selection,” Pattern Recognition Letters, vol. 26, pp. 965-975, 2005.
[3] T.Sousa, A.Silva, A.Neves, “Particle swarm based data mining algorithms for classification tasks,” Parallel Computing, Vol. 30, No. 5, pp.767–783, 2004.
[4] M.A. Hall. Correlation-based feature selection for machine learning. PhD thesis, The University of Waikato, 1999.
[5] M.Robnik- Sikonja, I. Kononenko, “Theoretical and empirical analysis of ReliefF and RReliefF,” Mach. Learn. Vol. 53, pp. 23-69, 2003.
[6] M. Dash, K. Choi, P. Scheuermann, H. Liu, “Feature selection for clustering-a filter solution,” in: Proceedings of the Second IEEE International Conference on Data Mining (ICDM’02), IEEE Computer Society, Washington, DC, USA, 2002, pp. 115–122.
[7] I. Guyon, A. Elisseeff, “An introduction to variable and feature selection,” J. Mach.Learn. Res. Vol. 3 pp. 1157–1182, 2003 .
[8] R. kohavi and G.h.john, “Wrappers for feature subset selection”, Artificial Intelligence, vol. 97, pp. 273-324, 315-333, 1997.
[9] I., W. Gunawan, A. Rakhmadi, “Filter-Wrapper Approach to Feature Selection Using PSO-GA for Arabic Document Classification with Naive Bayes Multinomial,” IOSR Journal of Computer Engineering (IOSR-JCE),Vol. 17, Issue 6, PP. 45-51,Ver. VI (Nov – Dec. 2015), e-ISSN: 2278-0661, p-ISSN: 2278-8727.
[10] M. Masoud JAVIDI, N. EMAMI, “A hybrid search method of wrapper feature selection by chaos particle swarm optimization and local search,” Turk J Elec Eng & Comp Sci, 2016 24: 3852 – 3861 c ⃝T¨UB˙ITAK doi:10.3906/elk -1404-220.
[11] Jianyu Miao, Lingfeng Niu, A Survey on Feature Selection, Procedia Computer Science , vol. 91, pp. 919 – 926, 2016.
[12] J. Han, M. Kamber, “Data Mining Concepts and Techniques,” Morgan Kaufmann Publishers, 2000 and 2006.
[13] P. Mitra, C.A. Murthy, S.K. Pal, “Unsupervised feature selection using feature similarity,” IEEE Trans. Pattern Anal. Mach. Intell. Vol. 24 , pp.301–312, 2002 .
[14] C.L. Huang, J.F. Dun, “A distributed PSO–SVM hybrid system with features selection and parameter optimization,” Appl. Soft Comput. Vol. 8, pp. 1381–1391, 2008.
[15] Y. Liu, F. Dellaert, “A classification based similarity metric for 3D image retrieval,” in: Proceedings of the IEEE International Conference on Computer Vision and Pattern Recognition, pp. 800–805, 1998.
[16] M.S. Lew, “Principles of Visual Information Retrieval," Springer-Verlag, London, 2001.
[17] J.S Tsai, W.B Huang, Y.H Kuo, MF Horng, Joint robustness and security enhancement for feature based image watermarking using invariant feature regions,” Signal Process., vol. 92, pp. 1431-1445, 2012.
[18] SI Choi, J Oh, CH Choi, C Kim. “Input variable selection for feature extraction in classification problem, Signal Process.,vol. 92: pp. 636-648, 2012.
[19] A Miller., Subset Selection in Regression. 2nd ed. Boca Raton, FL, USA: CRC Press, 2002.
[20] D.J. Monata, L. Davis, “Training feedforward neural networks using genetic algorithms,” in: 11th International Joint Conference on Artificial Intelligence, pp. 762–767, 1989.
[21] D. E. Goldberg, “Genetic Algorithms in Search,” Optimization and Machine Learning. (Reading, MA, USA: Addison- Wesley, New York, 1989.
[22] A. Saxena, M. Madhaw Shrivas, “Leave one out cross validated Hybrid Model of Genetic Algorithm and Naïve Bayes for Classification Problem,” Int. Journal of Engineering Research and Application, ISSN : 2248-9622, Vol. 6, pp.107-114, 2016.
[23] K. Neshatian and M. Zhang, “Improving relevance measures using genetic programming,” in European Conference on Genetic Programming (EuroGP 2012), ser. Lecture Notes in Computer Science, vol. 7244. Springer, pp. 97–108, 2012.
[24] B. Xue, M. Zhang, and W. N. Browne, “Particle swarm optimization for feature selection in classification: A multi-objective approach,” IEEE Transactions on Cybernetics, vol. 43, no. 6, pp. 1656–1671, 2013.
[25] M.H. Aghdam, N. Ghasem-Aghaee. M.E. Basiri, “Application of ant colony optimization for feature selection in text categorization,” in: Proceeding of 5th IEEE Congress on Evolutionary Computation, Hong Kong, 2008.
[26] A. Moayedikia, K.-Leong Ong, Y. Ling Boo, W. GS Yeoh, R. Jensen, “Feature selection for high dimensional imbalanced class data using harmony search,” Engineering Applications of Artificial Intelligence, vol. 57, pp. 38–49, 2017.
[27] S. Shaw, W. Kinsner, “Chaotic simulated annealing in multilayer feedforward networks,” in: Canadian Conference on Electrical and Computer Engineering, pp. 265–269, 1996.
[28] S.K. Chang, O.A. Mohammed, S. Y Hahn, “Detection of magnetic body using article neural network with modified simulated annealing,” IEEE Trans. Magn. Vol. 30 , 3644– 3647, 1994
[30] H. Lan. Written; E. Frank, A. Hall, “ Data Mining: Practical machine learning tools and techniques, 3 rd Edition”, 2011. [31] A. Unler, A. Murat, “A discrete particle swarm optimization
method for feature selection in binary classification problems,” European Journal of Operational Research vol. 206 , pp. 528–539, 2010
[32] L.-Yeh Chuang, S. -Wei Tsai, C. -Hong Yang , “Improved binary particle swarm optimization using catfish effect for feature selection,” Expert Systems with Applications vol. 38 , pp. 12699–12707, 2011.
[33] L. Chuang, C. Yang, J. Li, “Chaotic maps based on binary particle swarm optimization for feature selection.,” Appl. Soft Compu, vol. 11, pp. 239-248, 2011.
[34] B. Sahu, D. Mishra, “A Novel Feature Selection Algorithm using Particle Swarm Optimization for Cancer Microarray Data,” Procedia Engineering, vol. 38, pp. 27 – 31, 2012. [35] M Susana, F Vieira, Luís. Mendonc, Gonc¸ alo J. Farinha,
João M.C. Sousa, “Modified binary PSO for feature selection using SVM applied to mortality prediction of septic patients,” Applied Soft Computing ,vol.13, pp. 3494–3504, 2013.
[36] H. Banka, S. Dara, “A Hamming distance based binary particle swarm optimization (HDBPSO) algorithm for high dimensional feature selection, classification and validation,” Pattern Recognition Letters, vol. 52 , pp. 94–100, 2015 [37] G. Haixiang , L. Yijing, L. Yanan, L. Xiao, L. Jinling,
“BPSO-Adaboost-KNN ensemble learning algorithm for multi-class imbalanced data classification,” Engineering Applications of Artificial Intelligence, vol. 49, pp. 176–193, 2016.
[38] W. Srisukkham, L. Zhang,, S. Chin Neoh, S. Todryk, Chee Peng Lim, “Intelligent leukaemia diagnosis with bare-bones PSO based feature optimization,” Applied Soft Computing, vol. 56 , 405–419, 2017.
[39] S. Kar, K. Das Sharma, M. Maitra, “Gene selection from microarray gene expression data for classification of cancer subgroups employing PSO and adaptive K-nearest neighborhood technique,” Expert Systems with Applications , vol.42 , pp. 612–627, 2015.
[40] A. Saxena, N., Pal, M. Vora, “Evolutionary Methods for Unsupervised Feature Selection Using Sammon’s Stress Function,” Fuzzy Inf. Eng. , 2010, DOI 10.1007/s12543-010-0047-4.
[41] C. -Jui Tu, L. -Yeh Chuang, J. -Yang Chang and C. -Hong Yang, Member, IAENG, “Feature Selection using PSO-SVM,” IAENG International Journal of Computer Science, 33:1, IJCS_33_1_18.
[42] D. Arockia Vanitha, D.D, Venkatesulu M, “Gene Expression Data Classification using support vector machine and mutual information based gene selection, “procedia computer science ,vol 47, pp. 13-21, 2015.
[43]
[Online,Google search] .
[44] J. Kennedy, R.C.Eberhart, “A discrete binary version of the particle swarm algorithm”, Systems, Man, and Cybernetics, 1997. 'Computational Cybernetics and Simulation'., 1997 IEEE International Conference on Vol. 5, pp. 4104 - 4108 , 12-15 Oct. 1997.
[45] T. M. Cover and J. A. Thomas, Elements of information theory, 2nd ed. Hoboken, N.J.: Wiley-Interscience, 2006.
[46] V. Bolón-Canedo, N. Sánchez-Maro˜no, A. Alonso-Betanzos, “Distributed feature selection: An application to microarray data classification,” Applied Soft Computing, vol. 30 , pp. 136–150, 2015.
[47] T. M. Mitchell, Machine learning, Boston, WCB/McGraw-Hill, 1997.
[48] L. Feifei, P. Yongjun , L. Meijing, P. Minghao, K. Ho Ryu, Positive Impression of low-ranking microrn as in human cancer classification, David C. Wyld et al. (Eds) : CCSIT, SIPP, AISC, PDCTA, NLP - 2014 pp. 449–461, 2014. © CS & IT-CSCP 2014 DOI : 10.5121/csit.2014.4239. [49] K. Kira and L. A. Rendell, A practical approach to feature
selection, Proceedings of the ninth international workshop on Machine learning, Aberdeen, Scotland, United Kingdom, pp. 249-256,1992.
[50] H. Liu and R. Setiono, Chi2: Feature Selection and Discretization of Numeric Attributes, Proceedings of the Seventh International Conference on Tools with Artificial Intelligence, 1995.
[51] University of California at Irvine (UCI), Machine Learning Database, Center for Machine Learning and intelligent Systems, Online Available at :<
[52] Keel dataset repository
http://sci2s.ugr.es/keel/category.php?cat=clas) ,[online available].
[53] L. Randy. Haupt,Sue Ellen Haupt, Practicle genetic Algorithms, Wiley - Interscience, A john wiley & sons,Inc., Publication, Published by John Wiley & Sons, Inc., Hoboken, New Jersey. Published simultaneously in Canada.
[54] WEKA,http://www.cs.waikato.ac.nz/ml/weka.
[55] A. Khan & A. Rauf Baig, “Multi-objective feature subset selection using mRMR based enhanced ant colony optimization algorithm (mRMR-EACO)”, Journal of Experimental & Theoretical Artificial Intelligence, 3079. 1362-2015, ISSN: 0952-813X .
[56] S. Chebrolu, G. Sriram Sanjeevi, Attribute Reduction in Decision- Theoretic Rough Set Model using Particle Swarm Optimization with the threshold parameters determined using LMS training rule, Procedia Computer Science vol. 57 pp. 527-536, 2015.