DOI: http://dx.doi.org/10.26483/ijarcs.v8i7.4390
Volume 8, No. 7, July – August 2017
International Journal of Advanced Research in Computer Science
RESEARCH PAPER
Available Online at www.ijarcs.info
ISSN No. 0976-5697
A DISTANCE BASED ALGORITHM FOR NETWORK ANOMALY DETECTION
USING INITIAL CLASSIFICATION OF ‘PROTOCOL TYPE’ ATTRIBUTE
D. Ashok Kumar
Associate Professor, Department of Computer Science Government Arts College, Thuvakudimalai,
Tiruchirappalli, India
S. R. Venugopalan
Scientist, Information and Computing technologies Aeronautical Development Agency (Ministry of Defence)
Bangalore, India
Abstract: With the increased use of Internet and Internet of Things (IoT), data is being shared/generated instantaneously between/by various devices that range from small sensors to various appliances. Though this offers lots of tangible benefits, there are certain concerns such as the requirement of faster networks, higher bandwidth and huge storage etc., are there and the major concern is security of the data. The rate of information generation/exchange has increased the significance secure networks. As the network speed and bandwidth are ever increasing, Anomaly detection has attracted the attention of researchers to overcome the difficulties faced in signature based intrusion detection where detecting new attacks are not possible and the other factors which affect intrusion detection such as detection rate and the time required to detect intrusions. In this study a novel algorithm for network anomaly detection based on distance and initial classification of data based on 'protocol type' is proposed. The algorithm is tested with Kyoto University's 2006+ Benchmark dataset (new version of data). The results of the proposed algorithm outperform all the known/commonly used classification algorithms with respect to Detection Rate, False Alarm Rate, Recall and F-score.
Keywords: Anomaly Detection, KYOTO 2006+ Dataset, classification, norm, protocol type, network security
I. INTRODUCTION
Network Anomaly Detection has become a very popular topic of research in computer science. A Simple Google Search of ‘network anomaly detection’ has showed 20, 30,000 items and “scholar. Google” showed 323,000 items on July 22, 2017. The aim of Network Security is to protect the entire infrastructure of computer network and related services from unauthorized access [11].
A system deployed in a network is vulnerable to various attacks and needs to be protected against attacks [1]. Intrusion Detection Systems (IDS) play a vital role in protecting organization’s security. IDSs are classified into two types viz., signature-based and anomaly-based. A combination of these approaches will give a better solution. Signature based system use a well-defined pattern of attacks and compares it with the network traffic to detect attacks. Due to the increased bandwidth and speed of networks it is very difficult to compare each packet for malicious signatures and new attacks cannot be detected using this method. In Anomaly Detection normal the deviations in the normal usage behavior are identified to detect malicious activity. Data Miners see intrusion detection as a pure data mining problem without considering the semantics of the protocols such as TCP, UDP etc., and Statisticians see intrusion detection as pure statistical problem and Network Administrators view intrusion detection as a network problem and intrusion detection should be on protocol-based analysis. Various approaches like Data Mining, Soft Computing, Statistical Modeling, and Artificial Intelligence (AI) have been used for Network anomaly detection. Classification techniques are popular in Network Anomaly Detection. Classification algorithms include supervised learning and unsupervised learning, linear and nonlinear models, parametric methods and non-parametric methods,
and simple hypothesis tests and complex approaches such as Markov Models, Bayesian Models etc.
The organization of the paper is as follows: Section 2 gives the background and the literature surrounding IDS with necessary performance metrics. Section 3 describes the proposed approach and the algorithm development. In section 4 the dataset used in this study, data pre-processing, test dataset generation and experimental setup are discussed. The experiment and the results are discussed in section 5 followed conclusions future work in section 6.
II.LITERATUREREVIEW
and measures such as sensitivity and F-score are required. Kumar DA et al [2] presented an Adaptive Network Anomaly Detection Algorithm and tested the same with Kyoto 2006+ dataset [4].The proposed work combines the approaches proposed by Kumar DA et al [1, 2]] with little modifications. This work was test with the latest dataset i.e. the traces between 28th Dec 2015 and 31st Dec 2015 and there is no evidence of any research on anomaly detection which was carried out using this data.
Metrics for anomaly detection
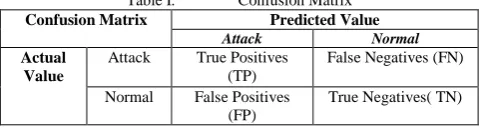
[image:2.595.38.280.231.295.2]The following Table I is the general confusion matrix used in Intrusion detection Evaluation. Most of the performance metrics are based on the Confusion Matrix. The values in the matrix represent the performance of the prediction algorithm.
Table I. Confusion Matrix
Confusion Matrix Predicted Value
Attack Normal
Actual Value
Attack True Positives (TP)
False Negatives (FN)
Normal False Positives (FP)
True Negatives( TN)
A good anomaly detection system have good recall rate, precision and low false alarms and should detect new attacks. The above mentioned factors are basic factors of performance and their trade-off can be analyzed by ROC curve. These factors are not sufficient to evaluate the performance. Other factors such as the environment where IDS is being deployed, the cost of missed detection and its maintenance & operating costs etc. are to be considered [12]. Anomaly Detection performance is increased by improving both precision and recall. F-Measure is a measure of test’s accuracy. The metrics are calculated in the following way
Precision/Detection Rate/ Positive Prediction Value: Proportion of the predicted positives which are actual positive (or) Fraction of test data detected as attack which is actually an attack.
Precision = TP/ (TP+FP)
Recall/Sensitivity/True Positive Rate: The fraction of attack class which is correctly detected (or) proportion of actual positives which are predicted as positives
Recall=TP/ (TP+FN)
False Alarm Rate: False positive rate (FPR) also known as false alarm rate (FAR), refers to the proportion that normal data is falsely detected as attack.
FAR=FP/ (FP+TN)
F-Score: F-score is defined as a measure of precision and recall
F-Score=2∗ * / (P+R)
III. PROPOSEDAPPROACH/
ALGORITHMDEVELOPMENT
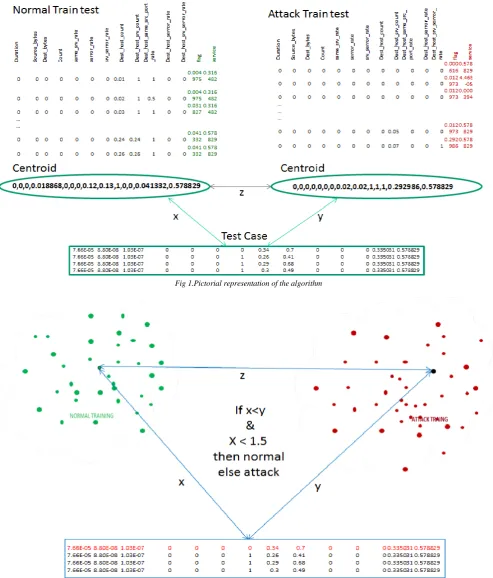
Kumar DA et al [1] has proposed the dataset to be initially classified based on protocol type yields better results with respect to detection rate and has tested Corrected KDDCUP 99 dataset with Naïve Bayes. All the intrusions or attacks that can be triggered on TCP cannot be trigged on UDP or ICMP since the nature of protocols are different and this can be observed in any dataset. The need for the new algorithm was established in section 2 and the Network Anomaly Detection Algorithm proposed in this study. The proposed algorithm initially classifies the data using ‘protocol type’ as suggested by DA Kumar et al and uses the simple statistical measures such as mean, median and norm to classify the data. The algorithm uses both attack and normal data for training and uses 2-norm as a distance measure given in Equation 1. This algorithm is tested using Kyoto University’s latest dataset. The results are compared with popular classifiers such as SVM. Naïve Bayes etc.
1 Algorithm
Fig 1.Pictorial representation of the algorithm
Fig 2. Pictorial representation of the algorithm
Network Anomaly Detection Algorithm (NADA)
Input: Training Dataset & Testing Dataset - attack training dataset (a), normal training dataset (n) and testing dataset (t).
Output: Anomaly Detection Performance metrics such as Detection rate, FAR, F-Score etc.
BEGIN // Start of Algorithm
1) Generate Initial Population/training Dataset that has equal number (5000) of attacks and normal traffic features.5000 attack records and 5000 normal records are used for training. Read the attack, normal and test traffic data.
2) Initialize the necessary variables and Read the attack normal traffic data.
attributes median is calculated. The centroids will be a set of values (mean and median).
4) Compute the distance between the test data and the centroid of the attack/normal dataset using 2.0 norm as given in equation 1.
5) If the test data is closer to normal centroid and the distance between test data and normal centroid is less than 1.5 times of the distance between the normal and attack centroid then it is labelled as normal else an attack.
6) Repeat the above steps (5 and 6) for all the test data. 7) Calculate the TP, TN, FP, FN, sensitivity, specificity,
FAR, Accuracy, detection rate, F-Score etc.
END //end of algorithm.
IV. DATASETANDEXPERIMENTALSETUP
This study uses the latest dataset of Kyoto University’s new version which was unveiled during Apr. 2017. In this section the dataset and data generation are discussed briefly.
KYOTO2006+ Dataset
Network Intrusion Evaluation/Detection dataset from Kyoto University popularly known as Kyoto 2006+ dataset [9], which was obtained from various honey pots from Nov. 01, 2006 - Dec. 31, 2015. Real network traffic traces were captured in this dataset. This data has 25 statistical features which includes 15 conventional features which were there in KDDCUP ’99[3] Dataset and 10 additional features for effective investigation. The protocol type feature which was missing in earlier versions of the dataset was added in this version. Earlier version had data from November 2006 to August 2009. This study uses the last four days of data (very latest in the dataset) .i.e. 28th Dec 2015 to 31st Dec 2015. This study uses the first 15 features (conventional features including ‘protocol type’ feature) and the label which indicates whether the session is an attack or not. This study does not distinguish between the known and unknown attack, both are represented as attack only. The unknown attacks in this dataset are very minimal and that is also another reason for not distinguishing known and unknown attack. The list of features is given below.
• duration: length (number of seconds) of the
connection
• service: network service on the destination, e.g.,
http, telnet, etc.
• src_bytes: number of data bytes from source to
destination
• dst_bytes: number of data bytes from destination to
source
• count: number of connections to the same host as
the current connection in the past two seconds
• same_srv_rate: % of connections in the count
feature to the same service
• serror_rate: % of connections in the count feature
that have ``SYN'' errors
• srv_serror_rate: % of connections whose service
type is the same to that of the current connection in the past two seconds that have “SYN” errors
• dst_host_count: among the past 100 connections
whose destination IP address is the same to that of the current connection, the number of connections whose source IP address is also the same to that of the current connection
• dst_host_srv_count: the number of connections in
the dst_host_count feature whose service type is also the same to that of the current connection
• dst_host_same_src_port_rate: % of connections in
the dst_host_count feature whose source port is the same to that of the current connection
• dst_host_serror_rate: % of connections in the
dst_host_count feature that have “SYN”
• dst_host_srv_serror_rate: % of connections in the
dst_host_srv_count feature that “SYN” errors • flag: normal or error status of the connection • protocol type: indicates the type of packets such as
TCP, UDP and ICMP.
• label: indicates whether the session is an attack or not
Data pre-processing
Data needs to be pre-processed before fed into any of the learning algorithm/model and the commonly used technique is normalization [5]. Network data consists of both numerical and categorical values. The numerical values and the categorical values need to be treated differently. The normalization increases the execution time by 15% [6], and it can be observed from various studies that there is only slight improvement in the performance. It needs to be investigated whether is it worth normalizing network data for intrusion detection at all. The general approach to normalize the Qualitative data is to replace the values with sequence numerical values such as 1, 2, etc. Though this seems simpler, it does not consider the semantics of the qualitative attributes. As an alternate way the following probability function is used to normalize the qualitative data.
[7] 2 Based on the above equation-2 the qualitative values are transformed into quantitative values within the range of [0-1]. Numerical data/attributes can be directly normalized using various techniques such as 1) Mean-range normalization 2) Frequency Normalization 3) Maximize Normalization 4) Rational Normalization 5) Ordinal Normalization and 6) Statistical Normalization7) Softmax Scaling [10] etc. But, this study does not normalize the numerical data.
Data generation
[image:4.595.333.526.657.720.2]The last four days of data Kyoto 2006+ new version of data is combined into single dataset and used for this study. There are 1188869 records for the four days. Out of which 49.1% (583809) of the records are duplicates and were removed and there are 607060 records. In 607060 records, there 92.9% of the records are attack and the remaining 43148 records are normal records. The following Table 2 gives the distribution of TCP, UDP and ICMP packets after removing the duplicates.
Table II. Distribution of records based on 'Protocol type' Protocol Type No. of Records Percentage
ICMP 3603 .6
TCP 415484 68.7 UDP 185973 30.7 Total 605060 100.0
records. Similarly in UDP, 83.5 %( 155363) of the records are attacks and the remaining 30410 records are normal records. From the above it can be observed that the attack records dominates the normal record by huge percentage. The reason for the above is the data was collected from honeypots which attract all the intrusions/attacks. In general scenario this may not be the case. There are 3 qualitative attributes i. e. flag and service, protocol type and all the other 12 attributes are quantitative See Appendix-1 for coding for ‘flag’ and ‘service’ attribute). Once the data is split based on ‘protocol type’, this attribute may not be required since the value is same and not going to change.
V.EXPERIMENTANDRESULTS
The experiments were carried out on a system with Intel Core i3 CPU M 380 @ 2.53 Ghz and 4GB RAM running Microsoft Windows version10 64-bit Operating System. As discussed in earlier section the categorical attributes are normalized and the numerical attributes are not normalized. 30% of the data is carved out from both TCP and UDP and is used for testing. In the remaining 70% of the data 5000 attack records and 5000 normal records are selectin in random for training. For normalization Microsoft Office Professional Plus 2010 was used and records were selected using SPSS Statistics V20.The proposed algorithm was implemented MATLAB Version 7.12.0.365 (R2011a) as a script. Other classification algorithms such as ONER, SVM, Naive Bayes and Logistic Regression were tested using WEKA [8] Version 3.7.10 (was configured to use the heap up to 4 GB). The performance results were recorded for both the datasets (TCP & UDP) separately. The experiment was carried out TCP and UDP separately and the weighted average is given below in Table III..
Table III. Distribution of records based on 'Protocol type'
No of Records 123918 55790
TCP UDP Weighted Average
Precision 0.9935 0.9650 0.9847
FAR 0.2042 0.1646 0.1919
F-Score 0.9877 0.9250 0.9682
Recall 0.9818 0.8882 0.9527
To compare the above results with the other classification algorithms (ONER, SVM, Naïve Bayes and Logitic Regression) the experiment was carried out with the same test and training dataset using WEK version 3.7.10 [8] and are given in the following Table IV and Figure 3.
Table IV. Comparison of NADA with other Classification Algorithms
Performance
Measure ONER
Naïve Bayes
SVM SMO
Logitic Regres
sion
NADA
Sensitivity or True Positive Rate(TP Rate) or
Recall 0.929 0.812 0.852 0.88 0.9527 False Positive
(FP) Rate or False Alarm Rate
(FAR) 0.051 0.064 0.074 0.061 0.1919 Precision or
Positive 0.961 0.943 0.945 0.95 0.9847
Prediction Value(Detection
Rate)
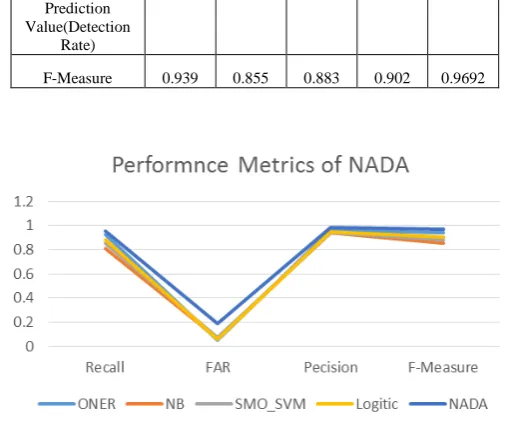
F-Measure 0.939 0.855 0.883 0.902 0.9692
Fig 3. Performance metrics of NADA
From Table IV and Figure 3, it can be observed that Precision, Recall and F-Score are higher and better in NADA than all the other classification algorithms. Whereas with regard to False Alarm Rate, ONER performs better. This study was carried out with the latest dataset available for evaluating Network Intrusion Detection System. This proposed algorithm can be improved by adding feature weights and can be made adaptive for the ever changing network traffic.
VI. CONCLUSIONS
In this research it is proposed to initially classify the results based on ‘protocol type’ and a new algorithm is proposed which uses basic statistic measures such as mean, median. The performance of the algorithm can be still improving by adding feature weights and normalizing numerical values. The algorithm outperforms the commonly used classification algorithms such as Naive Bayes, ONER, Logistic Regression and Support Vector Machines in terms of DR, Recall and F-Score.The future work shall focus on adaptive learning and normalization of attributes for in-band/real-time intrusion detection. The authors are trying to parallelize the algorithm for using GPGPU and adapt it for flow based records.
REFERENCES
[1] D. Ashok Kumar & S.R. Venugopalan, “Intrusion detection by initial classification-based on protocol type,” Int. J. Advanced Intelligence Paradigms, Vol. 9(2/3), pp. 122-138, 2017
[2] D. Ashok Kumar & S.R. Venugopalan , “A Novel algorithm for Network Anomaly Detection using Adaptive Machine Learning,” In Advanced Computing and Intelligent Technologies (ICACIE 16), December 2016.
[3]
(1999). Accessed 2 February 2014.
[image:5.595.315.568.55.269.2]of the First Workshop on Building Analysis Datasets and Gathering Experience Returns for Security, pp. 29-36, April 2011.
[5] Ammar, A., “Comparison of Feature Reduction Techniques for the Binominal Classification of Network Traffic,” Journal of Data Analysis and Information Processing, Vol. 3(02),2005, pp.11.
[6] Davidson, D., Smith, R., Doyle, N. and Jha, S., “September. Protocol normalization using attribute grammars,” In European Symposium on Research in Computer Security, Springer Berlin Heidelberg Sep 2009, pp. 216-231.
[7] Ihsan, Z., Idris, M. Y., & Abdullah, A. H.. “Attribute Normalization Techniques and Performance of Intrusion Classifiers: A Comparative Analysis,” Life Science Journal, Vol. 10(4), 2013.
[8] WEKA: Waikato Environment for Knowledge Analysis: Software for machine learning, The University of Waikato, Hamilton, New-Zealand
[9] Kyoto 2006+ New version data (Unvailed on Apr. 2017) [with IP addresses (sanitized), with Bro 2.4],
accessed on 02/06/2017.
[10] Chavez, A., Hamlet, J., Lee, E., Martin, M. and Stout, W.,.” Network randomization and dynamic defense for critical infrastructure systems,” Sandia National Laboratories Report—SAND2015-3324, 277 p.13 April 2015.
[11] Wang, Yun, .Statistical Techniques for Network Security: Modern Statistically-Based Intrusion Detection and Protection: Modern Statistically-Based Intrusion Detection and Protection. IGI Global, 2008.
[13] Panda, M. and Patra, M.R., “Network intrusion detection using naive bayes,” International journal of computer science and network security, Vol. 7(12), 2007, pp.258-263.
[14] Hussein, S. M., Ali, F. H. M., & Kasiran, Z.. “Evaluation effectiveness of hybrid IDs using snort with naive Bayes to detect attacks,” In Digital Information and Communication Technology and it's Applications (DICTAP), Second International Conference, pp. 256-260. IEEE, May 2012.
[15] Brar, R., & Sharma, N., “A Novel Density Based K-Means Clustering Algorithm for Intrusion Detection,”. Journal of Network Communications and Emerging Technologies (JNCET) www. jncet. org,Vol. 3(3), 2015.
APPENDIX -1
The following tables gives the details of the categorical attributes and their codlings using the probability function described earlier in this study.
A1.1 FLAG ATTRIBUTE CODING A1. TCP
Value Frequency New Value OTH 6255 0.0151
REJ 56341 0.1356 RSTO 69019 0.1661 RSTOS0 1372 0.0033 RSTR 1319 0.0032 RSTRH 682 0.0016 S0 206396 0.4968 S1 155 0.0004 S3 1 0.0000 SF 73611 0.1772 SH 2 0.0000 SHR 331 0.0008 Total 415484 1.0000 A1.2 SERVICE ATTRIBUTE CODING
Service Frequency New Value http 38 0.0001 other 282544 0.6800 rdp 1950 0.0047 smtp 3107 0.0075 ssh 127841 0.3077 ssl 4 0.0000 Total 415484 1.0000
Flag
A2. UDP
A2.1 FLAG ATTRIBUTE CODING
Frequency New Value OTH 10 0.0001
S0 40393 0.2172 SF 145124 0.7803 SHR 446 0.0024 Total 185973 1.0000 A2.2 SERVICE ATTRIBUTE CODING
Flag Frequency New Value Dhcp 8 0.0000