DOI: http://dx.doi.org/10.26483/ijarcs.v8i7.4525
Volume 8, No. 7, July – August 2017
International Journal of Advanced Research in Computer Science
RESEARCH PAPER
Available Online at www.ijarcs.info
ISSN No. 0976-5697
A FAST CORRELATION FILTER BASED GRADIENT BOOSTING CLASSIFIER
FOR DISEASE DIAGNOSIS
K.S.Thirunavukkarsu
Ph.D Research Scholar, Department of Computer Science, Research and Development Centre, Manonmaniam Sundaranar University and
Assistant Professor,
Sri Amman Arts and Science College, Erode, Tamilnadu, India.
Dr. Heren Chellam G.
Assistant Professor of Computer Science, Rani Anna Government College for women,
Tirunelveli, Tamilnadu.
Abstract: Disease diagnosis is the process to find the disease with specified details of a person's symptoms. Diagnosing the Disease is time consuming due to the need to analyze relevant microorganisms. Due to large growth in world’s population, Classification model receives a great deal in any domain of research and also a consistent tool for medical disease diagnosis. The domain of classification approach is used in the disease diagnosis, disease prediction, bio informatics and so on. However, an effective disease diagnosis model and the accuracy with the disease prediction were compromised. In order to obtain higher classification accuracy for heart and stroke disease diagnosis, a Fast Correlation Filter based Gradient Boosting Classifier (FCF GBC) technique is introduced. The main objective of the FCF-GBC technique is effectively performs disease diagnosis with two processing steps. Initially, Fast Correlation Filtering (FCF) algorithm is used to select the most relevant attributes (i.e. features) for disease diagnosis and filter out the irrelevant attributes in dataset. FCF uses symmetrical uncertainty to calculate the dependences of attributes and discovers the relevant attributes. After that, A Gradient Boosting Classifier is used for classifying and predicting the heart and stroke disease from the extracted attributes. Experimental evaluation is carried out using Statlog heart disease dataset and International Stroke Trial Database on the factors such as classification accuracy, classification time, error rate and true positive rate with respect to number of patients.
Keywords: Heart and stroke Disease diagnosis, Fast Correlation Filter, relevant attributes, irrelevant attribute, Gradient Boosting classifier.
1. INTRODUCTION
In the growth of the world’s current disease rate, exact disease diagnosis with the aid of medical data remains a significant task. Medical Data classification is a supervised learning technique which efficiently diagnosing the disease. The availability of medical datasets and data mining techniques are used for the researchers to recognize the disease with the collection of data and derives the decision rules for efficient disease diagnosis and prediction. Medical data classification is to help the surgeons for effective decision making and also improving the disease diagnosis effectively.
A rough-fuzzy classifier was introduced in [1] combined with rough set theory and fuzzy set. The rough-fuzzy classifier classified into two steps namely rule generation using rough set theory and prediction using fuzzy classifier. However, the prediction of the relevant features from the number of features for heart disease diagnosing remained unaddressed.
A support vector machine (SVM) classifier was designed in [2] and logistic regression for obtaining the high accuracy and perfect diagnosis of Parkinson’s disease (PD). However, an accurate diagnosis was critical as misdiagnosis direct to redundant medical examinations and therapies and related side-effects.
The different classification methods was developed in [3] for heart disease diagnosis. However, it failed to effectively diagnosis the stroke disease effectively. A Nearest neighbor (KNN) classifier was presented in [4] for
classifying heart disease but the detection of disease is major risk factors decline in the heart disease mortality.
A feature selection algorithm was designed in [5] using rough set theory but it failed to predict the decision rules which was extracted from a dynamic data. In [6], a medical big data was handled by computation intelligent system in neurological diseases diagnosis. However, it reduced the classification accuracy during the disease diagnosis.
An artificial neural networks-based (ANNs) diagnostic model was introduced in [7] for coronary heart disease (CHD) diagnosis. However, the relevant feature selections among multiple features were remained unsolved. Decision Tree and Naive Bayes using fuzzy logic was developed in [8] for identifying the presence of heart disease with minimum number of attributes accurately. But it takes more time to identify the disease patient.
The two systems models artificial neural network (ANN) and Neuro-Fuzzy approaches were designed in [9] to develop an automatic heart disease diagnosis. However, it failed to attain more exact outcomes. An investigation of the various data mining methods was introduced in [10] to improve heart disease diagnosis and prediction. However, the irrelevant feature reduction was not performed to attain better accuracy results.
Gradient Boosting Classifier (FCF-GBC) technique is developed.
The contribution of the research work is explained as follows, a Fast Correlation Filter based Gradient Boosting Classifier (FCF-GBC) technique is developed for diagnosing the medical disease. In FCF-GBC technique, two processing steps are used such as feature selection and classification. Initially, Fast Correlation Based Filter (FCBF) algorithm is applied to select the most relevant attributes for diagnosing the disease and filter out the irrelevant features through the symmetrical uncertainty measure. With the extracted features, the Gradient Boosting Classifier is applied to classify and predicts the heart and stroke disease. This helps to improve the classification accuracy with minimum time.
The structure of the research work is organized as follows: In Section 2, description of Fast Correlation Filter based Gradient Boosting Classifier (FCF-GBC) technique is presented for heart and stroke disease diagnosis with neat diagram. Section 3 presents the experimental settings and performance evaluation are presented in section 4. Section 5 discusses the reviews related to the research works to show the performance of proposed work. Conclusion of the research work is presented in Section 6.
2. FAST CORRELATION FILTER BASED
GRADIENT BOOSTING CLASSIFIER FOR DISEASE DIAGNOSIS
A Fast Correlation Filter based Gradient Boosting Classifier (FCF-GBC) technique is developed for medical disease diagnosis with the help of patient medical data information. The FCF-GBC technique considers two processes for effectively diagnosing the disease. At first, the Fast Correlation Filter approach is applied in FCF-GBC technique to select the relevant features (i.e. attributes) and filter out the irrelevant features. With the help of the relevant features, the FCF-GBC technique classifies the features related with patient information using Gradient Boosting Classifier. This classifier also helps to predict the outcomes from the testing data of patient. The gradient boosting is used for reducing the problem of regression and classification. In GBC algorithm, regression is the statistical process for estimating and analyzing many data to find the relationship between patient’s dependent data (i.e. physical condition to disease) and one or more independent data of same patient (i.e. age, gender, blood pressure, presence and absence of symptoms).
In medical, the FCF-GBC technique provides the effect of predicting the classification result for diagnosing the disease at an earlier stage. The GBC is presented to improve classification accuracy of the disease being detected. The following diagram clearly illustrates that the processing of the FCF-GBC technique.
Fig 1. Flow processing diagram of Fast Correlation Filter based Gradient Boosting Classifier technique
As shown in fig 1, the processing diagram of the proposed FCF-GBC technique is presented to diagnosis heart disease and stroke disease. The information is collected from the number of patient. Among the number of patient’s information, the relevant features are selected to perform classification for diagnosing the disease at an earlier stage. Then the gradient boosting classifier is applied in FCF-GBC technique to classify the patient who’s suffering from the heart or stroke disease. The brief explanation of FCF-GBC technique is presented in forthcoming section to improve the classification accuracy with minimum time.
I. Fast Correlation based Filtering approach for
selecting relevant feature and remove irrelevant feature
The first step in the design of the FCF-GBC technique is the selection of the relevant feature using Fast Correlation Filtering approach. The FCF (Fast Correlation Filtering) is a multivariate feature selection approach uses symmetrical uncertainty to investigate dependences of features and determines the most relevant feature. Symmetrical Uncertainty is normalized information theoretic measure which uses entropy and conditional entropy values to estimate the dependencies of features.
Let us consider a random features ‘ ’ and their probability is P ( ). The entropy of the feature ‘A’ is measured as follows,
Patient’s informati
on
Fast Correlation Based Filter
algorithm
Select relevant features and filter irrelevant
features
Gradient Boosting Classifier classify
disease patient
(1)
From (1), denotes entropy of the feature. Conditional uncertainty of A specified another random feature B. Therefore, average conditional entropy of feature A over B is described as follows,
(2)
From (2), where, P ( ) denotes a prior probabilities for all values of , and denotes a Posterior probabilities of ‘A’ specified the values of ‘B’. Therefore, the information gain of the two features is measured to calculate the dependency. The information gain is expressed as,
(3)
From (3), denotes an information gain of the two features. According to the information gain measure, a feature A is observed more correlated to feature B. Symmetrical uncertainty is measured as follows,
(4)
From (4), denotes the Symmetrical uncertainty. A Symmetrical uncertainty value of 1 indicates that using one feature other feature's value is absolutely dependent and value 0 indicates two features are totally independent. For each features from heart and stroke disease dataset, the Fast Correlation Filtering algorithm reducing the irrelevant attributes and selecting the relevant attributes through the Symmetrical uncertainty value. This helps to significantly reduce the classification time. The description of Fast Correlation Filtering algorithm is shown below.
Input : Set of features ‘ ’, B, Number of patient’s
Output: Select relevant features and remove irrelevant feature
Step 1: Begin
Step 2: For each attribute
Step 3: Measure theentropy of the feature ‘A’ using (1)
Step 4: Average conditional entropy of feature using (2)
Step 5: Measure Symmetrical uncertainty using (4)
Step 6: If Symmetrical uncertainty value 1 then
Step 7: Select relevant features
Step 8: else
Step 9: Remove irrelevant features
Step 10: End if Step 11:End for Step 12: End
Fig 2. Fast Correlation based Filtering algorithm
Fig 2. shows the Fast Correlation based Filtering algorithm for selecting the relevant features from the number of features in the dataset. For each feature, the symmetrical dependency between attributes is measured using Symmetrical uncertainty. The higher value of Symmetrical uncertainty provides the more relevant features. If the Symmetrical uncertainty value is 1 indicates the dependent features whereas ‘0’ indicates the independent features. As a result, the features are independent then it
rejects. This helps for selecting the high level features to diagnosis the heart and stroke disease effectively.
3. GRADIENT BOOSTING CLASSIFIER
TECHNIQUE
Once the relevant features are selected through the Fast Correlation Filtering algorithm, the classification is performed through the Gradient Boosting Classifier. Gradient boosting is a machine learning technique used for classification as well as prediction approach. The structure of the gradient boosting is the ensemble of weak prediction, generally using as decision trees. The gradient boosting classifier categorizes the patient who’s suffered from the heart or stroke disease or not. The GBC is iteratively learning an ensemble of weak classifier and combining them into a final strong classifier to provide the final results for disease diagnosing. This helps to predict the disease effectively.
In general, the regression trees are mostly used that the output real values are separated and the output is combined together to provide the more accurate results. Initially, the loss function is measured and it reduced for obtaining the higher classification accuracy with minimum time. Then the some class called base (or weak) learner fit into a pseudo residuals which is trained with training set. Finally, the output of the best gradient classifier is obtained to improve the disease diagnosis. Gradient boosting classifier assumes an approximation F(x) and in the form of a weighted sum of functions h(x). The gradient boosting classifier is shown in fig 3.
Fig 3. Gradient boosting classifier
Fig3. shows the gradient boosting classifier to categorize the patient, who is suffered from the heart and stroke disease.
As shown in figure, each regression tree h(x) perfectly predicts the training data and also useful for test data. In statistics, linear regression is a process for
Final strong classifier to diagnosis the disease
[image:3.595.328.554.404.699.2]determining the relationship between dependent features and independent features in the dataset. By using gradient boosting technique, a weak classification is carried out through the decision tree. Decision tree is a structure that consists of a root node, branches, and leaf nodes. Every inner node indicates a test on a features and the branch node denotes a result value. The leaf node in the tree holds a class label. The top node indicates a root node in the tree.
The gradient boosting classifier uses the prediction models and the shortcomings” are identified by gradients. Therefore, the prediction model considers the training set and the task is to fit a model to the function . Therefore, the prediction output of the proposed Gradient Boosting Classifier is expressed as follows,
(5)
From (5), denotes to predict the values and is the regression tree classifier output. In general, the gradient boosting loss function (i.e. squared error) is measured the difference between actual and predicted value. Therefore, the loss function is measured based on as follows,
(6)
From (6), the loss function ( the actual value ( and predicted value . Here is the classifier or regressor. is the number of relevant features to diagnosis the patient disease who’s suffered from heart or stroke disease. The weighted sum functions of the gradient classifier (i.e. strong classifier)
. Then fit a base learner to pseudo-residuals with training features. The pseudo-pseudo-residuals (R) function is expressed as,
(7)
From (7), the pseudo-residuals ( is measured. Then fit a regression tree to an input training set (i.e. features). Let us consider the output of the first predictive classifier with the training set,
(8)
(9)
Similarly, consider the output of the second weak classifier ,
(10)
The output of the last weak classifier is obtained as follows,
(11)
The above weak classifier output
are combined to provide the strong classifier for diagnosing the disease. Therefore, the predictor’s classifier function that reduces the total loss function . The
gradient boosting classifier classifies the patient correctly who suffered from the disease. The best gradient output is determined for predicting the heart disease and stroke disease. The best gradient descent step-size ( ) is determined as follows,
(12)
Finally, update the model to identify the disease patient,
(13)
Equation (13) denotes the target strong classifier output ( . The strong classifier output is used to classify the patient based on the objective function (i.e. threshold value). The final output of the classifier is denoted as to provide the positive result (i.e. ‘1’) indicates the classification of the patterns which is collected from the different patient. Otherwise, the patient is in normal condition. Therefore, an ensemble of weak classifier is used to make strong classifiers and performs the better classification until the accuracy of model is achieved. The algorithmic description of the Gradient boosting classifier is shown in fig 4.
Input : Number of relevant features, training sets
Output : Improve classification accuracy with Minimum time
Step 1: Begin
Step 2: For each training features in dataset
Step 3: Measure the loss function using (6)
Step 4: Measure the pseudo-residuals using (7)
Step 5: Fit a base learner to pseudo-residuals with training features using (8)
Step 6: Determine the best gradient descent step- size using (12)
Step 7: Update the model and provides output of the classifier using (13)
Step 8: If the Output function ( provides positive results ‘1’ then
Step 9: Identify the disease patient
Step 10: else
Step 11: The patient is in normal condition
Step 12: End if
Step 13: End for
Step 14: End
Fig 4. Gradient boosting classifier
. EXPERIMENTAL EVALUATION
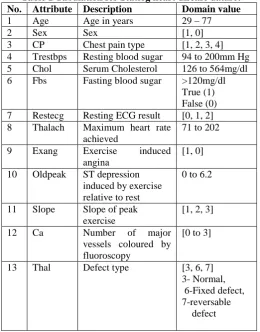
[image:5.595.29.290.201.534.2]An efficient Fast Correlation Filter based Gradient Boosting Classifier (FCF-GBC) technique is experimented using java language with two different datasets namely Statlog heart disease dataset is extracted from UCI repository and stroke disease database Baseline variables from International Stroke Trial Database to perform the experiments. The two different dataset are explained for conducting experiments in FCF-GBC technique is shown in table I and table II.
Table 1 Tabulation for Statlog heart disease dataset No. Attribute Description Domain value
1 Age Age in years 29 – 77
2 Sex Sex [1, 0]
3 CP Chest pain type [1, 2, 3, 4] 4 Trestbps Resting blood sugar 94 to 200mm Hg 5 Chol Serum Cholesterol 126 to 564mg/dl 6 Fbs Fasting blood sugar >120mg/dl
True (1) False (0) 7 Restecg Resting ECG result [0, 1, 2] 8 Thalach Maximum heart rate
achieved
71 to 202
9 Exang Exercise induced angina
[1, 0]
10 Oldpeak ST depression induced by exercise relative to rest
0 to 6.2
11 Slope Slope of peak exercise
[1, 2, 3]
12 Ca Number of major vessels coloured by fluoroscopy
[0 to 3]
[image:5.595.311.560.444.657.2]13 Thal Defect type [3, 6, 7] 3- Normal, 6-Fixed defect, 7-reversable defect
Table II Description of stroke disease database (Baseline variables from International Stroke Trial Database) No Attribute Domain value
1 Age 29 – 77 2 Sex [1, 0] 3 Arthritis [1, 0] 4 Hypertension [1, 0] 5 Heart disease [1, 0] 6 Diabetes [1, 0]
7 Alcohol Regular or occasional drinker, No drinks past 12 months
8 BMI class (Normal, Overweight, Obsese ) 9 Smoking
status
(Never, Smokes Daily, former smoker)
10 Physical activity
(Inactive, Active, Moderate)
These two different dataset are used to perform the experimental evaluation for diagnosing the disease
effectively. The FCF-GBC technique is compared with existing Rough Fuzzy Classifier [1] and SVM classifier [2]. Experimental evaluation is carried out on the factors such as classification accuracy, classification time, error rate and true positive rate with respect to number of patients.
5. RESULT ANALYSIS
The result analysis of Fast Correlation Filter based Gradient Boosting Classifier (FCF-GBC) technique is performed with existing Rough Fuzzy Classifier [1] and SVM classifier [2]. The experimental evaluation result is carried out with the various metrics such as classification accuracy, classification time, error rate and true positive rate compared to the state-of-the-art methods. Performance analysis is carried out based on following metrics with the help of tables and graph values.
A. Impact of classification accuracy
Classification accuracy is measured as the ratio of the number of patients (i.e. various data patterns are collected from different patient) are accurately classified the disease patient to the total number of patient. The Classification accuracy is measured as follows,
(14)
Classification accuracy is measured with respect to number of patients correctly classified as a stroke and heart disease. It is measured in terms of percentage (%).
Table III Tabulation for classification accuracy No.
of pat ien ts
Classification accuracy (%) for heart disease dataset
Classification accuracy (%) for stroke disease database
FCF-GBC
Rough Fuzzy Classif ier
SVM classi fier
FCF-GBC
Rough Fuzzy Classif ier
SVM classi fier
5 98.12 86.25 80.36 95.13 84.64 77.65 10 96.47 84.2 75.68 93.56 82.35 73.44 15 95.33 82.68 73.24 90.48 80.12 70.12 20 93.42 79.35 70.47 89.21 78.54 68.35 25 90.34 78.32 68.13 87.46 76.85 65.49 30 88.54 76.41 65.34 85.67 74.10 62.78 35 86.09 74.10 63.10 83.15 72.65 60.20 40 84.23 72.58 60.32 80.36 70.38 58.32 45 82.46 70.85 58.24 78.47 68.64 55.46 50 80.34 68.32 55.95 75.64 65.32 52.48
[image:5.595.30.274.566.747.2][image:6.595.42.263.78.200.2]
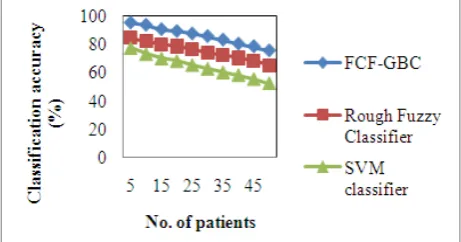
Fig 5. Measure of classification accuracy using heart disease dataset
Fig 5 shows the classification accuracy using heart disease dataset with respect to number of patients. From the figure, the classification accuracy using heart disease dataset is reduced in all the methods while increasing the number of patients. But comparatively, the FCF-GBC technique provides the higher classification accuracy. This is because; a gradient boosting classifier (GBC) is applied in FCF-GBC technique. The gradient boosting classifier algorithm correctly classifies the disease patient with relevant features selected from heart disease and stroke disease dataset. Gradient boosting classifier uses the regression analysis with decision tree. By applying gradient boosting, an ensemble of weak classifier to provide the strong classifier is to predict the disease effectively. Therefore, the classification accuracy is significantly improved using heart disease dataset by 16% and 34% compared to existing Rough Fuzzy Classifier [1] and SVM classifier [2].
Fig 6 . Measure of classification accuracy using stroke disease dataset
Fig 6 illustrates the classification accuracy using stroke disease database with respect to number of patients. For the experimental concern, the various patterns are collected from different patients for diagnosing the disease effectively. Therefore, the figure clearly shows that the improved results in classification accuracy. The gradient boosting classifier is applied and it provides the positive output classification results with training features then the disease patient is correctly identified. Otherwise, the patient is in normal condition. This helps to improve the classification accuracy. By using a stroke disease dataset, the classification accuracy is increased by 14% and 34%
compared Rough Fuzzy Classifier [1] and SVM classifier [2] respectively.
B. Impact of classification time
Classification time is measured as an amount of time required to classify the features for disease diagnosis based on the number of patients. The formula for classification time is expressed as follows,
(15)
[image:6.595.301.562.216.459.2]From (15), the Classification time ( ) is defined based on number of patients (N). it is measured in terms of milliseconds (ms).
Table IV Tabulation for classification time No.
of pati ents
Classification time (ms) for heart disease dataset
Classification time (ms) for stroke
disease database
FCF-GBC
Rough Fuzzy Classifi er
SVM classi fier
FCF-GBC
Rough Fuzzy Classifi er
SVM
Classi fier
5 4.10 5.12 7.28 4.65 5.68 8.12 10 5.23 8.24 10.24 6.48 8.15 11.87
[image:6.595.40.271.465.586.2]15 7.31 10.54 13.51 8.69 12.52 14.65 20 8.18 13.47 15.68 10.45 14.75 17.34 25 10.13 15.68 18.34 12.67 17.34 20.25 30 13.57 17.52 20.17 14.41 19.65 22.64 35 14.13 20.1 24.75 16.28 23.32 25.33 40 15.84 22.65 26.32 18.65 24.56 29.3 45 18.2 24.71 30.44 21.48 27.45 31.24 50 20.22 28.60 32.18 22.36 30.12 33.87
Table V shows the classification time with respect to two different dataset namely heart disease dataset and stroke disease dataset. The number of information is collected from the number of patients. While increasing the number of patients, the classification time gets reduced using FCF-GBC technique than the excising Rough Fuzzy Classifier [1] and SVM classifier [2].
Fig7. Measure of classification time using heart Disease Dataset
[image:6.595.319.559.563.699.2]comparatively the classification time is reduced using FCF-GBC technique than the existing methods. This is because, the classification time of the heart disease is observed to be less than the stroke disease dataset. Fast Correlation Filter technique is applied in FCF-GBC technique for disease diagnosis with the help of patient medical data information. The FCF-GBC technique considers two processes for effectively diagnosing the disease. In FCF-GBC, the symmetrical dependencies between attributes are identified to select the relevant feature. If the Symmetrical uncertainty value provides 1 indicates the dependent features whereas ‘0’ indicates the independent features. This helps to reduce the classification time. Therefore, classification time is considerably reduced by 30% and 42% compared to existing Rough Fuzzy Classifier [1] and SVM classifier [2] respectively.
Fig 8. Measure of classification time using stroke disease database
Fig 8 clearly illustrates the performance analysis of classification time using stroke disease database. The figure clearly obvious that the proposed FCF-GBC technique improves the performance result with minimum classification time. For the experimental consideration, 30 patients are considered for performing the classification to diagnosis the disease. While considering the 20 patient, the proposed FCF-GBC technique consumes minimum time i.e. 10.45ms using stroke disease database whereas 14.75ms for Rough Fuzzy Classifier and 17.34ms for SVM classifier. This is because, the relevant features are obtained using stroke disease database to perform classification. The gradient boosting classifier effectively classifies the patient who’s suffered from the disease. This obtains the maximum accuracy with minimum classification time. Therefore, the classification time is reduced by 25%and 38% compared to existing Rough Fuzzy Classifier [1] and SVM classifier [2] respectively.
C. Impact of error rate
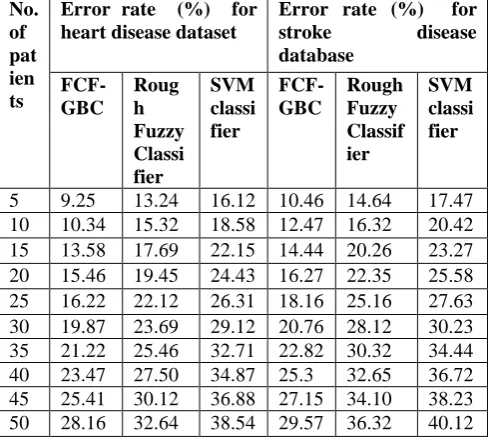
[image:7.595.40.274.252.374.2]The Error rate is defined as the difference between the actual and observed value during the classification. The error rate is measured using (6), with three different methods namely FCF-GBC technique, Rough Fuzzy Classifier [1] and SVM classifier [2]. The error rate is measured in terms of percentage (%).
Table V Tabulation for error rate
No. of pat ien ts
Error rate (%) for heart disease dataset
Error rate (%) for
stroke disease database
FCF-GBC
Roug h Fuzzy Classi fier
SVM classi fier
FCF-GBC
Rough Fuzzy Classif ier
SVM classi fier
5 9.25 13.24 16.12 10.46 14.64 17.47 10 10.34 15.32 18.58 12.47 16.32 20.42 15 13.58 17.69 22.15 14.44 20.26 23.27 20 15.46 19.45 24.43 16.27 22.35 25.58 25 16.22 22.12 26.31 18.16 25.16 27.63 30 19.87 23.69 29.12 20.76 28.12 30.23 35 21.22 25.46 32.71 22.82 30.32 34.44 40 23.47 27.50 34.87 25.3 32.65 36.72 45 25.41 30.12 36.88 27.15 34.10 38.23 50 28.16 32.64 38.54 29.57 36.32 40.12
Table V describes the error rate with respect to number of patients. The error rate is measured during the classification. Three different methods are used to perform the analysis namely FCF-GBC technique, Rough Fuzzy Classifier [1] and SVM classifier [2].
Fig 9. Measure of error rate using heart disease dataset
[image:7.595.323.554.372.497.2]
Fig 10. Measure of error rate using stroke disease Database
Fig 10 clearly describes the error rate using stroke disease database with the number of patients. As shown in fig 8, the error rate of the proposed and existing methods gets increased while increasing the number of patients. But comparatively, error rate is reduced in proposed FCF-GBC technique using stroke disease database. This is because; the gradient boosting classifier performs efficient classification with minimum loss function (i.e. error rate). From the loss measurement, the actual value and predicted values are measured to identify the differences. The boosting classifier is also used to classify the features for diagnosing the patient disease with minimum error rate. Therefore, the error rate is reduced by 25% and 34% compared to existing Rough Fuzzy Classifier [1] and SVM classifier [2] using stroke disease database respectively.
D. Impact of true positive rate
True positive rate (i.e. sensitivity) is measured as the ratio of correctly identified patient as a sick. It is measured in terms of percentage (%). The formula for true positive rate is defined as follows,
[image:8.595.39.272.67.197.2] [image:8.595.320.541.137.256.2]*100 (16) From (16), where is the true positive and denotes a false negative i.e. disease people incorrectly identified as healthy.
Table VI Tabulation for true positive rate No.
of pat ien ts
True positive rate (%) for heart disease dataset
True positive rate (%) for stroke disease database
FCF-GBC
Rough Fuzzy Classifi er
SVM classi fier
FCF -GBC
Rough Fuzzy Classif ier
SVM classif ier
5 81.54 68.35 65.31 79.57 66.38 63.45 10 82.46 71.32 67.57 80.65 70.20 65.69 15 83.65 73.65 69.31 81.57 71.65 68.46 20 85.20 75.86 71.54 83.68 73.68 70.24 25 86.12 78.83 73.69 85.24 75.84 72.59 30 88.47 80.10 75.64 86.78 77.65 73.52 35 90.12 81.32 77.85 88.32 78.13 75.98 40 92.45 83.45 79.31 90.12 80.24 78.16 45 94.12 85.20 81.45 92.36 82.68 80.68 50 95.36 88.15 83.14 93.43 84.69 82.46
Table VI explains the true positive rate based on number of patient with respect to two different dataset heart disease dataset and stroke disease database. The true positive rates of the two different datasets are tabulated. A performance result of the true positive rate is shown in fig 11.
Fig 11. Measure of true positive rate using heart
disease Dataset
Fig 11 depicts the performance analysis of the true positive using heart disease dataset. The above figure clearly describes the true positive rate using heart disease dataset is improved than the existing methods. Among the multiple features, the relevant features are selected and irrelevant features are filtered out using Fast Correlation filtering approach. This helps to improve the true positive rate. In addition, the gradient boosting classifier is applied to classify the patterns correctly for diagnosing the disease in the patient. The base learner classifiers are combined into a strong classifier to provide the efficient results in classification. Therefore, the true positive rate is considerably improved by 12% and 18% using heart disease dataset than the existing Rough Fuzzy Classifier [1] and SVM classifier [2] respectively.
Fig 12. Measure of true positive rate using stroke disease database
[image:8.595.318.557.479.588.2] [image:8.595.31.291.554.778.2]As a result, the proposed Fast Correlation Filter based Gradient Boosting Classifier (FCF GBC) technique effectively achieves higher classification accuracy for heart and stroke disease diagnosis.
6. RELATED WORKS
A hybrid classification system depends on the ReliefF and Rough Set (RFRS) approach was designed in [11] to diagnosis the heart disease. However, it failed to discover an optimal constraint values. The FCF-GBC technique performs effective classification with optimal features through fast correlation based filtering.
A hybrid intelligent system was designed in [12] for diagnosing breast cancer using rough set theory and k-nearest neighbor algorithm. However, it only used for breast cancer problem and other medical diagnosis applications was not used. The proposed FCF-GBC technique effectively utilizes the different medical diagnosis applications.
The various data mining classification techniques was introduced in [13] using CART (Classification and Regression Tree), ID3 (Iterative Dichotomized 3) and decision table (DT) to predict the heart diseases. But it does not provide an exact prediction list for heart patients. The FCF-GBC technique correctly predicts the patient who’s suffered from the heart and stroke disease.
Artificial Neural Networks (ANNs) was introduced in [14] using decision support system to recognize the heart diseases. But the sensitivity measurement during the classification was not performed. The GBC technique effectively improves the sensitivity to diagnosis the disease.
A biomedical-based system was introduced in [15] for classifying the heart sound signals using Artificial neural network (ANN). However, an efficient diagnosis process was not carried out. The proposed FCF-GBC technique improves the disease diagnosing through the classification.
Data Mining technique such as classification, logistic regression was introduced in [16] for predicting the Ischemic Stroke. However, accuracy of the classification was not improved. The FCF-GBC technique effectively improves the classification accuracy.
The ischemic stroke diagnosis was carried out in [17] in a National Health Insurance claims database. However, sensitivity during the disease diagnosis was not improved. The FCF-GBC technique correctly identifies the disease patient which helps to improve sensitivity during the classification.
A hybrid Meta heuristic technique was introduced in [18] using ant colony optimization (ACO) phase and a genetic algorithm (GA) phase. However, it failed to discover various parameter values for diagnosing the disease. The FCF-GBC technique effectively improves the disease diagnosing using parameters such as classification accuracy, true positive rate and time as well as error rate.
In [19], a hierarchical learning algorithm was introduced for classifying a number of scale patient records. However it failed to extract more relevant features for hierarchical classifier training. The FCF-GBC technique extracts the most relevant feature using fast correlation filtering approach.
A multivariate reconstructed phase space (MRPS) was designed in [20] for detecting the multivariate temporal patterns. However, Bayesian approach with first-order
Markov behavior was not used for heart disease diagnosis. The proposed FCF-GBC technique is used to diagnosis the disease efficiently using gradient boosting classifier.
7. CONCLUSION
An efficient Fast Correlation Filter based Gradient Boosting Classifier (FCF-GBC) technique is developed to obtain the better classification for diagnosing the heart and stroke disease. The objective of the FCF-GBC technique improves the accuracy of the classification with the selected relevant features. The relevant features are selected through the Fast Correlation Filtering (FCF) algorithm from the number of features. The FCF algorithm also filters out the irrelevant features. With the relevant feature, the classification is performed through the Gradient Boosting Classifier to classify the patterns collected from different patient for diagnosing the disease effectively. This helps to improve the classification accuracy with minimum time. Experimental evaluation is performed with two different dataset namely statlog heart disease dataset and stroke disease database. The performance results shows that the proposed FCF-GBC technique significantly improves the classification accuracy, true positive rate and also reduces the classification time as well as error rate than the state-of-the-art methods.
REFERENCES
[1] K. Srinivas, G. Raghavendra Rao, A. Govardhan, “Rough-Fuzzy Classifier: A System to Predict the Heart Disease by Blending Two Different Set Theories”, Arabian Journal for Science and Engineering, Springer, Volume 39, Issue 4, April 2014, Pages 2857–2868
[2] R. Prashanth, Sumantra Dutta Roy, Pravat K. Mandal, Shantanu Ghosh,” Automatic classification and prediction models for early Parkinson’s disease diagnosis from SPECT imaging”, Expert Systems with Applications, Elsevier, 2014,Volume 41, Issue 7, Pages 3333-3342
[3] Boshra Bahrami, Mirsaeid Hosseini Shirvani, “Prediction and Diagnosis of Heart Disease by Data Mining Techniques”, Journal of Multidisciplinary Engineering Science and Technology (JMEST), Volume 2, Issue 2, February 2015, Pages 164-168.
[4] Jabbar, M.A,Deekshatulu, B.Land Chandra,Priti, "Classification of Heart Disease Using K- Nearest Neighbor and Genetic Algorithm, “Procedia Technology, Elsevier, Volume 10, 2013, Pages 85-94
[5] Jiye Liang, Feng Wang, Chuangyin Dang, and Yuhua Qian,” A Group Incremental Approach to Feature Selection Applying Rough Set Technique”, IEEE Transactions on Knowledge and Data Engineering, Volume 26, Issue 2, 2014, Pages 294 - 308
[6] Siuly Siuly and Yanchun Zhang, “Medical Big Data: Neurological Diseases Diagnosis Through Medical Data Analysis”, Data Science and Engineering, Springer, Volume 1, Issue 2, 2016, Pages 54–64
[7] Oleg Yu. Atkov, Svetlana G. Gorokhova, Alexandr G. Sboev, Eduard V. Generozov , Elena V. Muraseyeva, Svetlana Y. Moroshkina , Nadezhda N. Cherniy, “Coronary heart disease diagnosis by artificial neural networks including genetic polymorphisms and clinical parameters”, Journal of Cardiology, Elsevier, Volume 59, 2012, Pages 190—194
International Journal of Computer Applications , Volume 54, Issue 17, September 2012, Pages 16-21
[9] Mohammad A. M. Abushariah, Assal A. M. Alqudah, Omar Y. Adwan, Rana M. M. Yousef, “Automatic Heart Disease Diagnosis System Based on Artificial Neural Network (ANN) and Adaptive Neuro-Fuzzy Inference Systems (ANFIS) Approaches”, Journal of Software Engineering and Applications, Volume 7, 2014, Pages 1055-1064
[10] Salha M. Alzahani, Afnan Althopity, Ashwag Alghamdi, Boushra Alshehri, and Suheer Aljuaid,” An Overview of Data Mining Techniques Applied for Heart Disease Diagnosis and Prediction”, Engineering and Technology, Information Theory, Volume 2, Issue 4, 2014, Pages 310-315
[11] Xiao Liu, Xiaoli Wang, Qiang Su, Mo Zhang, Yanhong Zhu, Qiugen Wang, and Qian Wang, “A Hybrid Classification System for Heart Disease Diagnosis Based on the RFRS Method”, Computational and Mathematical Methods in Medicine, Hindawi, Volume 2017, January 2017, Pages 1-11 [12] A. H. El-Baz, “Hybrid intelligent system-based rough set
and ensemble classifier for breast cancer diagnosis”, Neural Computing and Applications, Springer, Volume 26, Issue 2, 2015, Pages 437–446
[13] Vikas Chaurasia and Saurabh Pal, “Early Prediction of Heart Diseases Using Data Mining Techniques”, Caribbean Journal of Science and Technology, Volume 1, May 2013, Pages 208-217
[14] Sameh Ghwanmeh, Adel Mohammad, Ali Al-Ibrahim, “Innovative Artificial Neural Networks-Based Decision Support System for Heart Diseases Diagnosis”, Journal of
Intelligent Learning Systems and Applications, Volume 5, Issue 3, Aug 2013, Pages 176-183.
[15] Harun Uğuz, “A Biomedical System Based on Artificial Neural Network and Principal Component Analysis for Diagnosis of the Heart Valve Diseases,” Journal of Medical Systems, Volume 36, Issue 1, 2012, Pages 61-72.
[16] Balar Khalid and Naji Abdelwahab, “A Model for Predicting Ischemic Stroke Using Data Mining Algorithms”, International Journal of Innovative Science, Engineering & Technology , Volume 2, Issue 11, 2015, Pages 18-23 [17] Cheng-Yang Hsieh, Chih-Hung Chen, Chung-Yi Li,
Ming-Liang Lai, “Validating the diagnosis of acute ischemic stroke in a National Health Insurance claims database”, Journal of the Formosan Medical Association, Elsevier, Volume 114, 2015, Pages 254e259
[18] Sarab AlMuhaideb and Mohamed El Bachir Menai, “A new hybrid metaheuristic for medical data classification”, International Journal of Metaheuristics, Volume 3, Issue 1, 2014, Pages 59-80
[19] Kuizhi Mei, Jinye Peng, Ling Gao, Naiquan (Nigel) Zheng, Jianping Fan “Hierarchical Classification of Large-Scale Patient Records for Automatic Treatment Stratification”, IEEE Journal of Biomedical and Health Informatics, Volume 19, Issue 4, July 2015, Pages 1234 – 1245