Project Report
Development of Validation Protocol for
Activated Sludge Process in Water Recycling
A report of a study funded by the
Australian Water Recycling Centre of Excellence
Development of Validation Protocol for Activated Sludge
Process in Water Recycling
Project Leader
Partners
Dr Simon Toze University of New South Wales
Land and Water Flagship South East Water
CSIRO Queensland Urban Utilities
Ecosciences Precinct WA Water Corporation
42 Boggo Rd TasWater
Dutton Park Qld 4102 AUSTRALIA Telephone: +61 7 3833 5572
Contact: Dr Simon Toze [email protected]
About the Australian Water Recycling Centre of Excellence
The mission of the Australian Water Recycling Centre of Excellence is to enhance management and use of water recycling through industry partnerships, build capacity and capability within the recycled water industry, and promote water recycling as a socially, environmentally and economically
sustainable option for future water security.
The Australian Government has provided $20 million to the Centre through its National Urban Water and Desalination Plan to support applied research and development projects which meet water recycling challenges for Australia’s irrigation, urban development, food processing, heavy industry and water utility sectors. This funding has levered an additional $40 million investment from more than 80 private and public organisations, in Australia and overseas.
ISBN: 978-1-922202-69-7 Citation:
Sidhu, J.P.S., Ahmed, W., Hodgers, L., Smith, K., Palmer, A., Wylie, J., Low, J., Nichols, C. and Toze, S. (2015). Development of Validation Protocol for Activated Sludge Process in Water Recycling, Australian Water Recycling Centre of Excellence, Brisbane, Australia.
© Australian Water Recycling Centre of Excellence
This work is copyright. Apart from any use permitted under the Copyright Act 1968, no part of it may be
reproduced by any purpose without the written permission from the publisher. Requests and inquiries concerning reproduction right should be directed to the publisher.
Date of publication: December 2015
Publisher:
Australian Water Recycling Centre of Excellence Level 5, 200 Creek Street, Brisbane, Queensland 4000 www.australianwaterrecycling.com.au
This report was funded by the Australian Water Recycling Centre of Excellence through the Australian Government’s National Urban Water and Desalination Plan.
Disclaimer
i | Development of Validation Protocols for Activated Sludge Process in Water Recycling
Development of Validation Protocols for
Activated Sludge Process in Water
Recycling
NATVAL 2.2 Sub Project 3
Jatinder Sidhu, Warish Ahmed, Leonie Hodgers, Kylie Smith, Andrew Palmer et al.,
20th December 2015
Acknowledgments
iii | Development of Validation Protocols for Activated Sludge Process in Water Recycling
Contents
Acknowledgments ii
Executive summary xi
1 Background 1
2 Literature Review 4
2.1 Mechanisms which influence removal of pathogens during treatment at a wastewater treatment plant 4
2.1.1 Major factors which influence removal of pathogens ... 4
2.1.2 Bacterial removal mechanisms ... 5
2.1.3 Protozoa removal mechanisms ... 5
2.1.4 Virus removal mechanisms ... 6
2.2 Non-adsorption factors influencing pathogen removal ... 8
2.2.1 Temperature ... 8
2.2.2 pH... 9
2.2.3 Suspended Solids ... 9
2.2.4 Pathogen type ... 10
2.2.5 Biological Oxygen Demand ... 10
2.2.6 Ammonia ... 10
2.2.7 Hydraulic retention time ... 10
2.2.8 Solids retention time and mixed liquor suspended solids ... 11
2.2.9 Flocculation-aided sedimentation ... 11
2.2.10 Turbidity ... 11
2.2.11 Hydrophobicity ... 12
2.3 Correlation between physicochemical factors and pathogen removal ... 12
2.3.1 Bacteria removal ... 12
2.3.2 Enteric virus removal ... 13
2.3.3 Protozoa removal ... 13
2.4 Target pathogens and indicators/surrogates ... 13
2.4.1 Criteria used for selection of representative pathogens ... 13
2.4.2 Enteric viruses ... 14
2.4.4 Criteria used for selection of appropriate microbial indicator... 17
2.5 Pathogen and indicators occurrence and removal during wastewater treatment ... 17
2.5.1 Pathogen removal ... 18
2.6 Influence of wastewater treatment operational parameters on the removal of the pathogen numbers from the wastewater ... 20
2.7 Conclusions ... 22
3 Large Scale Activated Sludge Treatment Plant Physicochemical Data 23 3.1 Activated sludge treatment process ... 23
3.2 Selection of activated sludge treatment plants ... 23
3.2.1 Collection of operator supplied plant specific operational data... 24
3.3 Results 26 3.4 Discussion and Conclusions ... 28
4 General Materials and Methods 29 4.1 Microorganisms targeted in selected activated sludge treatment plants ... 29
4.2 Sample collection and processing ... 30
4.3 Sample storage, shipment and processing ... 30
4.4 Sample quality assurance and quality control ... 30
4.5 Calculation of Log Removal Value (LRV) ... 32
4.6 Statistical analysis ... 32
5 Removal of Bacteria 33 5.1 Methodology ... 33
5.1.1 Total coliform and E. coli quantification ... 33
5.2 Results 33 5.2.1 E. coli numbers in influent and effluent samples ... 33
5.2.2 Comparative distribution and removal of E. coli across sites ... 37
5.3 Discussion and conclusions ... 39
6 Removal of Viruses 40 6.1 Methodology ... 41
6.2 Results 41
v | Development of Validation Protocols for Activated Sludge Process in Water Recycling
6.2.2 Virus numbers in the influent and effluent of the Oxley Creek WWTP ... 41
6.2.3 Virus numbers in the influent and effluent of the Beenyup WWTP ... 43
6.2.4 Virus numbers in the influent and effluent of the Boneo WWTP ... 46
6.2.5 Virus numbers in the influent and effluent at the Rosny WWTP ... 48
6.3 Discussion and Conclusions ... 50
6.3.1 Virus numbers in influent and effluent ... 50
6.3.2 Log removal of enteric virus across sites... 51
7 Removal of Protozoan Pathogens 53 7.1 Methodology ... 53
7.1.1 Sample concentration ... 53
7.1.2 Detection of Cryptosporidium oocysts. ... 53
7.2 Results 54 7.2.1 Detection in raw and treated wastewater ... 54
7.3 Discussion and conclusions ... 55
8 Comparison of Microbial Log Reduction Value Between the Wastewater Treatment Plants 59 8.1 Discussion and Conclusions ... 63
9 Validation Protocol Development 64 9.1 Comparison of sampling on hydraulic retention time or simultaneous samples ... 64
9.1.1 Results of Sampling at HRT versus simultaneous samples ... 65
9.2 Assessment of Linkages Between Microbial LRVs and Physicochemical Results in Wastewater Treatment Plants ... 67
9.2.1 Rational for using Principal Component Analysis ... 68
9.3 Analysis of correlations at the Oxley Creek WWTP ... 68
9.3.1 PCA analysis of the combined data from all WWTPs ... 70
9.4 Discussion and conclusions ... 72
9.4.1 Sampling at HRT versus simultaneous sampling ... 72
9.4.2 Correlation between physicochemical factors and microbiological parameters .... 73
10 Summary and Recommendation 76 10.1 Validation of activated sludge plants ... 76
Appendix A. Pathogen removal during wastewater treatment 79
Appendix B. Summary statistics on historical data from four WWTPs 85
Appendix C. Detailed sampling and detection methodologies 93
Appendix D. PCA and PLS-DA analysis of data from WWTPs 101
vii | Development of Validation Protocols for Activated Sludge Process in Water Recycling
Figures
Figure 1-1. Research Stages ... 3 Figure 3-1. Schematic diagram of an activated sludge treatment plant. ... 23 Figure 4-1. Sampling sites at the Oxley Creek Wastewater Treatment Plant. ... 30 Figure 5-1. Comparative Escherichia coli numbers in the influent and effluent samples (n=40) at
Oxley Creek wastewater treatment plant... 34 Figure 5-2. Comparative E. coli numbers in the influent and effluent samples at Beenyup
wastewater treatment plant. ... 35 Figure 5-3. Comparative E. coli numbers in the influent and effluent samples at Boneo
wastewater treatment plant. ... 36 Figure 5-4. Comparative E. coli numbers in the influent and effluent samples at Rosny
wastewater treatment plant. ... 37 Figure 5-5. Comparative distribution of E.coli in influent and Effluent across all four sites. ... 38 Figure 6-1. Comparative adenovirus, polyomavirus and Microviridae numbers in influent and
effluent samples collected at the Oxley Creek WWTP. ... 42 Figure 6-2. Comparative distribution of adenovirus, polyomavirus and Microviridae numbers in
influent (Inf.) and effluent (Eff.) samples collected at the Oxley Creek WWTP. ... 43 Figure 6-3. Comparative adenovirus, polyomavirus and Microviridae numbers in influent and
effluent samples collected from the Beenyup WWTP. ... 44 Figure 6-4. Comparative adenovirus, polyomavirus and Microviridae numbers in influent (Inf.)
and effluent (Eff.) samples collected from the Beenyup WWTP. ... 45 Figure 6-5. Comparative adenovirus, polyomavirus and Microviridae numbers in influent and
effluent samples collected at the Boneo WWTP. ... 46 Figure 6-6. Comparative adenovirus, polyomavirus and Microviridae numbers in influent (Inf.)
and effluent (Eff.) samples collected from Boneo WWTP. ... 47 Figure 6-7. Comparative adenovirus, polyomavirus and Microviridae numbers in influent and
effluent samples collected from Rosny WWTP... 48 Figure 6-8. Comparative adenovirus, polyomavirus and Microviridae numbers in influent (Inf.)
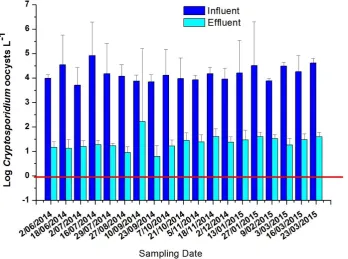
and effluent (Eff.) samples collected from Rosny WWTP. ... 49 Figure 7-1. Comparative numbers and log10 removal of Cryptosporidium oocysts in influent and
effluent samples from Beenyup WWTP. ... 56 Figure 7-2. Comparative numbers and log10 removal of Cryptosporidium oocysts in influent and
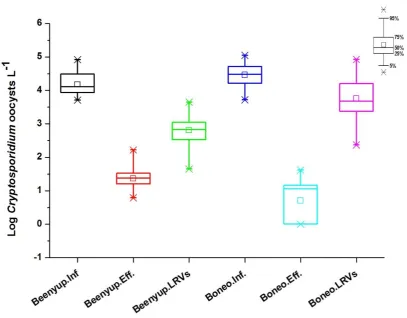
effluent samples at Boneo WWTP. ... 56 Figure 7-3. Comparative numbers and log10 removal of Cryptosporidium oocysts in influent and
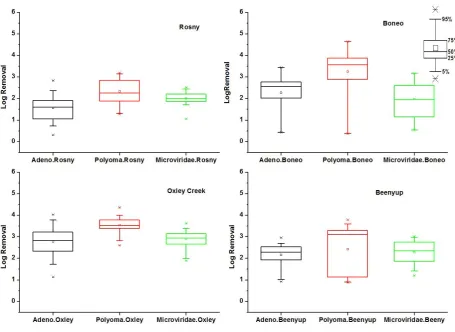
Figure 8-1. Comparative Log Reduction Values (LRVs) for adenovirus, polyomavirus and
Microviridae in Box and whisker plot at all four WWTPs. ... 60 Figure 9-1. Comparative Log Reduction Values (LRVs) observed from the simultaneous samples
(n=40) and paired samples (n=20) on Hydraulic Retention Time (HRT) from Oxley Wastewater Treatment Plant... 66 Figure 9-2. PCA Score Scatter Plot and Loading Scatter Plot comparing Oxley creek influent and
effluent samples. ... 69 Figure 9-3. PLS-DA Score Scatter plot and PLS-DA Loading Scatter plot of Oxley Creek influent
and effluent data. ... 70 Figure 9-4. PCA Score Scatter Plot and Loading Scatter Plot comparing all influent and effluent
samples. ... 71 Figure 9-5. PLS-DA Score Scatter plot and PLS-DA Loading Scatter plot of all influent and effluent
ix | Development of Validation Protocols for Activated Sludge Process in Water Recycling
Tables
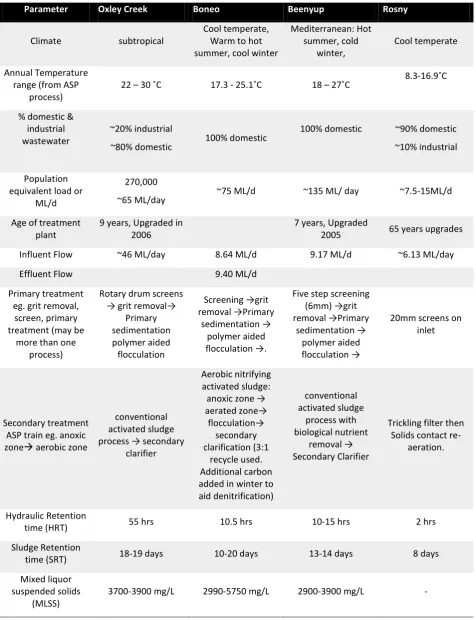
Table 3-1. Selected wastewater treatment plants in four climatic conditions of Australia. ... 24
Table 3-2. Detailed information on the selected wastewater treatment plants for the study. ... 25
Table 3-3. Physicochemical parameters (mean ± SD) for influent and effluent from four wastewater treatment plants in Australia (January 2014 – April 2015). ... 27
Table 4-1. Number of samples collected from ASP from all four sites (influent, effluent and LRVs). ... 29
Table 5-1. Descriptive Statistical analysis on E. coli numbers in influent and effluent samples detected in the four WWTPs. ... 34
Table 5-2. Descriptive statistical analysis of Escherichia coli log removal values (LRVs) across the four WWTPs. ... 38
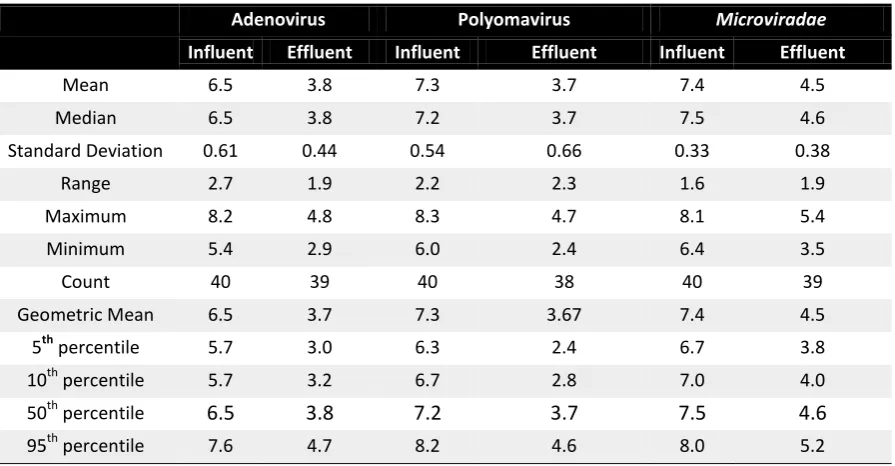
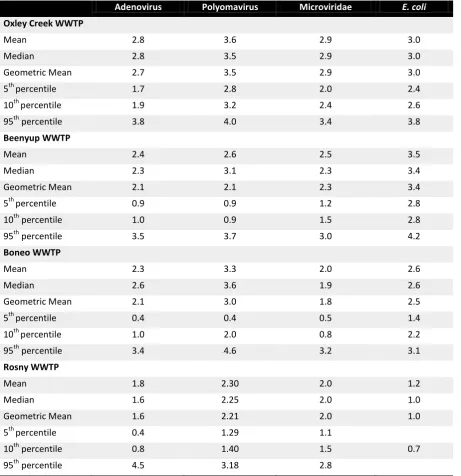
Table 6-1. Statistical analysis of data from the Oxley Creek WWTP. ... 42
Table 6-2. Statistical analysis of data from the Beenyup WWTP. ... 45
Table 6-3. Statistical analysis of data from Boneo WWTP. ... 47
Table 6-4. Statistical analysis of data from Rosny WWTP. ... 49
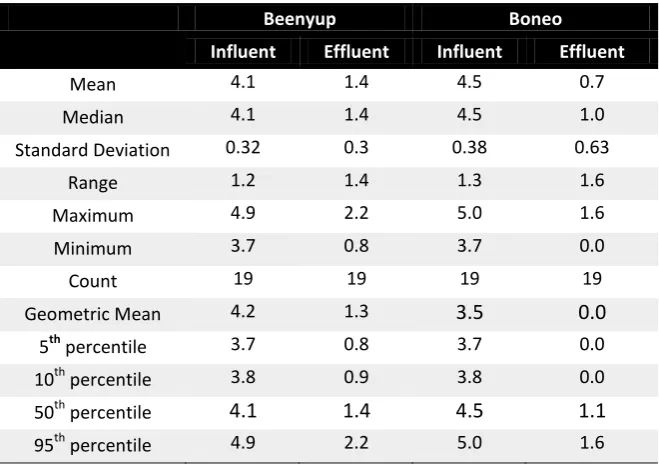
Table 7-1. Statistical analysis of data on Cryptosporidium oocyst numbers the influent and effluent of the Beenyup and Boneo WWTPs. ... 57
Table 7-2. Statistical analysis of data on average LRVs for Cryptosporidium oocyst numbers at the Beenyup and Boneo WWTPs. ... 57
Table 8-1. Summary of the estimated Log Reduction Values (LRVs) for adenovirus, polyomavirus, Microviridae and E. coli in the different WWTPs. ... 61
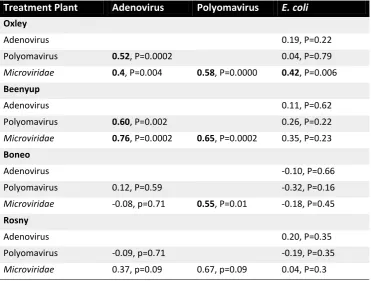
Table 8-2. Determined correlations between LRVs for adenovirus, polyomavirus, E. coli and Microviridae at each WWTP. ... 62
Table 9-1. Descriptive statistical analysis of the LRV data for simultaneous samples and samples collected on HRT at Oxley Creek WWTP. ... 65
List of Acronyms
AGWR Australian Guidelines for Water Recycling AS Activated sludge
ASP Activated sludge process BOD Biological oxygen demand COD Chemical oxygen demand DO Dissolved oxygen
HRT Hydraulic retention time ICC Integrated cell culture
IMS Immune-magnetic separation LLOQ lower limit of quantification LRV Log removal value
MBR Membrane bioreactor
MLSS Mixed liquor suspended solids PCA Principal Component Analysis PCR Polymerase chain reaction qPCR quantitative PCR
RT-PCR Reverse transcriptase-PCR SRT Sludge retention time SS Suspended solids TOC Total organic carbon
xi | Development of Validation Protocols for Activated Sludge Process in Water Recycling
Executive summary
Decreasing rainfall, frequent drought and population growth in urban environments along with an overall desire to achieve greater water sustainability have increased the demand for alternative water sources such as recycled water. This has resulted in an increased attention on the types of contaminants in wastewater and the need to protect the health of the public while implementing these water sustainability initiatives. One important means of safeguarding appropriate health standards is to ensure that contaminants are removed to appropriate levels in the treated water. This means that there needs to be the correct controls and monitoring of the treatment processes to continually meet the determined treatment requirements. One of the important initial steps is to be able to accurately validate what removal capacity a treatment process can achieve when it is operating optimally, and what conditions can cause failure in the established removal capacity. Many water recycling schemes use wastewater treatment plants (WWTPs) as a common treatment process. WWTPs have traditionally been designed and operated to maximise the removal of nutrients and suspended solids from municipal wastewater to prevent environmental contamination. These WWTPs are now frequently required to produce high quality water (alone or in conjunction with other treatment steps) that can be recycled for a variety of direct or indirect potable reuse, agricultural irrigation, managed aquifer recharge, industrial use, recreational use and environmental enhancement. A large majority of these WWTPs utilise the activated sludge process (ASP) as a major treatment process.
Due to the inherent complexity of the activated sludge process, to date data on the level of contaminant removal has been sparse and conflicting. In addition, differences in the design of the ASP process, the types of contaminants studied, along with variations in sampling and detection methodologies have made it difficult to gain an accurate understanding of the treatment capability of ASPs. This lack of adequate data precludes the development of adequate validation steps that can assist in establishing appropriate removal credits.
The potential public health risk associated with recycled water predominantly originates from the potential presence of enteric viruses and protozoan parasites due to their high infectivity and low dose. These pathogens are also recognised to have high environmental resistance and are commonly found in higher numbers in untreated municipal wastewater than in other environmental sources. The presence of viruses in treated water used for recycling may vary according to the type of treatment process, population size, geographical location and prevalence of disease in the community. This makes it difficult to generalise what and how much treatment a WWTP must achieve (Gerba et al., 2013). This means that any assessment of the treatment capacity of an ASP within a wastewater treatment train needs to be assessed on an individual basis, taking into account the common microbial constituents present in that wastewater, and how well the ASP performs under local conditions.
frequently recorded (and/or easily measured) physicochemical parameters. The identification of relationships would enable, through appropriate operational monitoring and verification, the demonstration that appropriate pathogen log removals were being achieved in these biological systems. It was also hoped that such relationships could also indicate when an ASP was not operating to specifications and therefore when pathogen removal could be impacted.
The study involved sampling three activated sludge treatment plants, Oxley Creek (sub-tropical), Beenyup (mediterranean), Boneo (cool temperate) and a trickling filter plant, Rosny (mild temperate oceanic). These WWTPs represented different geographical regions of Australia and different population sizes. The selected treatment plants also varied in design and operating conditions. The performance of each plant was assessed by measuring log reduction values (LRVs) and collecting a range of physicochemical parameters, both from historical records and during the current study. The historical records provided information on the stability of the plant operation and were used to demonstrate that the plant was operating to specifications during the time when microbial LRVs were assessed.
The physicochemical parameters monitored in the influent and effluent as well as the frequency of data collection varied across the treatment plants. This made it difficult to perform a direct comparison between treatment plants. The subsequent findings indicated that the design of the plant was as important as (if not more of an influence than) the geographical location of the plant. In fact, the Rosny trickling filter plant was so different that ultimately the results from this WWTP were not used for direct comparison with the three ASP WWTPs and was examined on its own as an example of the trickling filter technology.
Despite the differences noted between the WWTPs, the analysis of physicochemical parameters (temperature, pH, DO, BOD, COD) showed little variation within an individual treatment plant indicating that all plants were operating under stable conditions. The average effluent temperature at Oxley Creek treatment plant was the highest (26.9±3.0 °C) and Rosny the lowest (18.5±3.5 °C) and this significant difference (P < 0.05) in operational temperature between the two plants reflected the influence of ambient climatic conditions. Sludge parameters such as sludge retention time (SRT) and mixed liquor suspended solids (MLSS) varied in response to plant design and operation, seasonal variations in wastewater inflows, and ambient temperature.
The study of microbial removal efficiencies at each plant was done using selected microorganisms from the three major pathogen groups of concern in Australia, namely bacteria, viruses and protozoa. The bacteria were represented by E. coli as this bacterium is the most commonly used microbial indicator and has been used historically to inform the quality of treated effluent. It was also assumed that removal efficiencies for E. coli would be representative of other bacterial species. Three DNA viruses (adenovirus, polyomavirus and the Microviridae coliphage) were tested as potential viral surrogates. Adenovirus and polyomavirus were selected as it has been previously suggested that these viruses could potentially be suitable as representative indicator pathogens.
xiii | Development of Validation Protocols for Activated Sludge Process in Water Recycling
The results found that E. coli numbers were fairly constant in the influent throughout the year at all the WWTPs ranging from 7 to 9 log10 L-1. Effluent E. coli numbers were also constant in the
effluent from each of the WWTPs, with mean values from 5.3 to 5.9 log10 L-1. When these influent
and effluent numbers were used to calculate LRVs, it was demonstrated that the ASP plants could consistently achieve E. coli removal with LRV geometric means ranging from 2.5 to 3.4 log10.
The virus data from all four WWTPs suggest that human adenovirus was consistently present in detectable numbers in both influent (106 to 108 L-1) and effluent samples (103 to 105 L-1). The LRVs determined for adenovirus in the ASP WWTPs had geometric means from 2.1 to 2.7 log10
indicating that adenovirus is indeed suitable for use as a conservative viral surrogate in a validation protocol. LRVs were of comparable magnitude to LRVs measured for E. coli, however the site-specificity for all three viruses meant that validation would need to be undertaken for each individual WWTP in order to determine appropriate virus log removal credits.
The initial attempts to detect Cryptosporidium parvum oocysts was found to provide numbers that were inconsistent in the influent of all WWTPs. Further research determined that this was caused by a low detection limit and issues associated with the recovery of oocysts from raw influent. Changes to the detection methodology, including the volume of sample tested (decreased from 30 mL to 15 mL) and using Cryptosporidium sp. genus specific primers rather than C. parvum species specific primers, provided results in the case of Beenyup and Boneo WWTPs. These two WWTPs respectively presented average Cryptosporidium sp. numbers in influent of 4.1 and 4.5 log10 L-1 and
in effluent of 1.4 and 0.7 log10 L-1. The calculated mean LRVs were 2.8 for Beenyup WWTP and 3.8
log10 for Boneo WWTP. These initial removal rates are similar to those determined for viruses,
however these were only preliminary conclusions based on limited data. More testing would be needed from these and other WWTPs in order for more accurate conclusions to be reached on the ability of activated sludge plants to remove Cryptosporidium from wastewater.
A standardised sampling methodology is a key component supporting the development of a validation protocol, therefore a comparison was made between undertaking simultaneous influent and effluent sampling and a paired sampling strategy based on the calculated hydraulic retention time of the plant. Using the Oxley Creek WWTP as the test site, samples were collected using both strategies and compared. The results demonstrated that there were no statistically significant differences in calculated LRVs for adenovirus, polyomavirus or Microviridae using either sampling method (t test, P > 0.05). This suggested that the more practical simultaneous sampling strategy could be used as the preferred sampling methodology.
It was also considered important to determine the ideal number of samples required for validation purposes. The results suggested that the analysis of 10 samples was not sufficient to capture variations in LRVs while the mean and geometric means of 20, 30, and 40 samples were statistically similar and therefore, little additional benefit was obtained by collecting more than 20 samples. This result is consistent with literature data on representative sample sizes for validation purposes.
relationships could be identified. Future improvements in sensing technology and the testing of a large number of WWTPs over a longer time period may lead to the identification of significant links, allowing the monitoring of specific physicochemical parameters to be used to demonstrate pathogen removal.
Through a collaboration with the UNSW Water Research Centre, Bayesian Belief Network models were also used to investigate potential relationships between operating conditions, monitoring parameters and microbiological removal, and assess the capacity of these models to predict ASP performance. Similar to the PCA analysis, there were limited links found between the microbial LRVs and the physicochemical parameters using the Bayesian Network modelling. The Bayesian Network analysis, however, did find potential links of low LRVs being closely associated with high concentrations of reduced nitrogen, and higher LRVs associated with much lower than average NH4+-N and TN concentrations. This suggests that, while these physicochemical parameters may
still not be directly correlated to pathogen removal, they may be able to be associated with monitoring that demonstrates that ASP processes are performing adequately.
This study has found that activated sludge plants are able to reduce the numbers of bacteria, viruses and protozoan by 2 log10 or more. No seasonal impacts were observed, but design and
1 | Development of Validation Protocols for Activated Sludge Process in Water Recycling
1
Background
The production of safe and sustainable recycled water relies on the effectiveness of treatment barriers, one of which is frequently a conventional wastewater treatment plant (WWTP). It is therefore not uncommon for these biological systems to form one of, if not the major treatment component of a water-recycling scheme. This is particularly the case for small-scale and regional water recycling schemes. In larger water recycling schemes the biological system often provides a significant initial treatment stage within a multi-barrier scheme.
Virtually all WWTPs across Australia use a form of biological treatment such as activated sludge as a major component of the treatment of wastewater (NRMMC, 2006). The activated sludge process is a commonly used biological wastewater treatment in both Australia and around the world. The primary objective of these plants has traditionally been the removal of bio-degradable organic matter and suspended solids. Therefore, performance of the WWTP has customarily been measured on the basis of physicochemical parameters such as sludge retention time (SRT), Mixed Liquor Suspended Solids (MLSS), BOD, COD and nutrient removal (Carducci and Verani, 2013). Because of this emphasis on nutrient reduction, and the fact that the final treated effluent was discarded to the environment, the ability of activated sludge systems to reduce microbial pathogens has been of secondary concern.
The increased focus on recycling treated wastewater to improve water sustainability of communities has placed more emphasis on ensuring appropriate health standards are maintained to protect the health and wellbeing of local communities. This means that there now needs to be a greater understanding of the capability of different treatment components to reduce or remove microbial pathogens from wastewater. Due to the innate complexity of activated sludge plants, however, there remains a paucity of data on their ability to reduce pathogen numbers, how to assess any removal, or how to ensure there is a consistent level of removal. The Australian Guidelines for Water Recycling (2006) (AGWR) provide an indicative log removal value (LRV) of 0.5 to 2 log10 for viruses and 0.5 to 1.0 log10 for Cryptosporidium (NRMMC, 2006). This data has been
derived from the literature much of which, however, is out of date (because of changes in detection capabilities) or being obtained from studies in the northern hemisphere which may, or may not be relevant to WWTPs operating in an Australian climate. In addition, there are only a limited number of international studies that have examined the efficiency of pathogen removal in activated sludge plants (Carducci et al., 2008; Costan-Longares et al., 2008; Gantzer et al., 1998; Rose et al., 1996). In Australia there is a paucity of specific information on pathogen removal in activated sludge with only a limited number of studies specifically investigating pathogen removal by biological treatment plants (Flapper et al., 2010; Keegan et al., 2013; McAuliffe and Gregory, 2010; Toze et al., 2012). These studies have predominantly investigated pathogen removal at a laboratory scale or within a single climatic zone with relatively small sample size.
In the absence of appropriate local LRV data the setting of default values (commonly 0.5 log10 for
to claim additional log credits for an activated sludge plant, there is no recognised standard validation protocol available to achieve recognition of these log credits. It still remains to be determined what would be the best mechanism for validating biological processes in Australia. The primary objective of the NatVal project has been to establish a national validation framework for different treatment systems commonly used in recycling schemes and this sub-project was focused on treatment by Activated Sludge Processes (ASP). There is evidence, however, suggesting that geographical regions and differences in climatic conditions can produce different removal efficiencies for biological systems in Australia (Keegan et al., 2013; McAuliffe and Gregory, 2010; Toze et al., 2012). The direct study of changes in pathogen numbers across a biological system can be complex, time consuming and prohibitively expensive, particularly for the high risk pathogens such as viruses and protozoa. There is a range of physical parameters within activated sludge plants, such as hydraulic retention times and sludge age that can also impact on the accuracy and measurement of pathogen removal rate. As a result of these complexities, the use of surrogates or indicators that can be correlated to the efficiency of pathogen removal is considered to be a suitable alternative to direct measurement of pathogens. In addition, if any physicochemical parameters (SS, BOD, COD and NO3) could be found to consistently correlate with the presence or
removal of pathogens then these could also be used for the ongoing operational monitoring and validation of treatment plants. Some physicochemical parameters could be monitored at low cost and rapidly or even measured in real-time.
A number of studies have explored the correlation between different physicochemical and microbiological parameters (Flapper et al., 2010; Keegan et al., 2013; Muela et al., 2011; Rolland
et al., 1983). There is currently no consensus among the reported literature with some studies reporting some correlations between microbiological and physicochemical parameters (Flapper et al., 2010; Rolland et al., 1983) while other studies have found no relation between microorganism removal and physicochemical parameters (Carducci and Verani, 2013; Muela et al., 2011).The aim of this project was therefore to determine the pathogen removal efficiency of a number of ASP-based WWTPs and to provide data that could be used to develop a validation protocol for assessing pathogen removal by activated sludge plants. The data needs to enable the validation protocol to be able to be used in the different geographical regions of Australia.
Key Aims
To provide appropriate data that can be used in the development of a protocol to validate activated sludge plants for their ability to reduce microbial pathogen numbers. The data will be obtained from activated sludge plants located in different regions of Australia. The final additional aim is to attempt to determine if there are physicochemical parameters that can indicate that activated sludge plants are operating adequately and can achieve the validated log reduction values.
Objectives
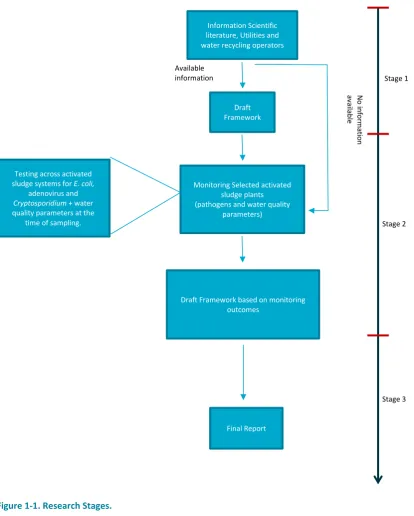
The scope of the research required the work to be undertaken in 3 distinct logical stages (Figure 1) and included the following tasks:
3 | Development of Validation Protocols for Activated Sludge Process in Water Recycling
Obtain information from the scientific literature, and obtain any available internal and non-published reports on any research undertaken that can assist on assessing pathogen removal across biological systems.
Using the outcomes of the survey, develop a draft protocol for validating biological systems that can be tested and further refined.
Test the draft validation guidelines using a selection of established biological systems to obtain baseline information on pathogen removal and determine what target microorganisms and operational parameters (e.g., suspended solids, temperature, and dissolved oxygen) could be used for validation of these systems.
Figure 1-1. Research Stages.
Available information
N
o
in
fo
rm
at
io
n
av
ai
lab
le
Information Scientific literature, Utilities and water recycling operators
Draft Framework
Monitoring Selected activated sludge plants (pathogens and water quality
parameters)
Draft Framework based on monitoring outcomes
Final Report Testing across activated
sludge systems for E. coli,
adenovirus and
Cryptosporidium + water quality parameters at the
time of sampling.
Stage 1
Stage 2
2
Literature Review
Recycled water derived from wastewater treatment plants (WWTPs) is increasingly used for a variety of purposes in cities for alleviating water shortages. Inadequately treated recycled water can contain significant numbers of pathogens, which pose unacceptable health hazards. The required level of treatment is based on the intended use of recycled water, and the risk of exposure (NRMMC, 2006). Recycled water with a high probability of human contact requires the highest level of treatment due to end uses that carry a high risk of direct human exposure through intentional or incidental ingestion.
This project consisted of four major tasks:
To carry out a literature review on pathogen and indicator reduction by ASPs;
To collate and analyse data sets that report pathogen and indicator removal by ASPs to determine anticipated log removal values (LRVs);
To determine mechanisms of pathogen and indicator reductions and their relationships with physicochemical parameters; and
To determine the usefulness of physicochemical parameters for pathogen reduction by ASPs by collection and analysis of through a series of experiments and data analysis. The literature review summarises studies and findings regarding pathogen monitoring approaches, pathogen reduction processes and their influencing factors, activated sludge data associated with bacterial, protozoan and virus reduction, and studies that have considered combined pathogen reduction, and correlation with operating parameters.
2.1
Mechanisms which influence removal of pathogens during treatment
at a wastewater treatment plant
The removal of pathogenic microorganisms during wastewater treatment is variable depending upon the treatment process and factors such as hydraulic retention time, retention of solids, dissolved oxygen concentration, pH, temperature and the efficiency in removing suspended solids (Tyagi et al., 2011). Microbial cell adsorption onto porous media (suspended solids) is expected to be influenced by the content of organic matter, ionic strength, pH, temperature, water flow, hydrophobicity, biofilm development and bacterial numbers in the wastewater (Stevik et al., 2004). The mechanisms behind the removal or inactivation of pathogens are less understood or studied as compared to the mechanisms involved in retention or adsorption. Available literature on the identified pathogen removal mechanisms within the ASP is summarised below:
2.1.1 Major factors which influence removal of pathogens
5 | Development of Validation Protocols for Activated Sludge Process in Water Recycling
bacterial pathogens and, to a certain extent, viral pathogens from wastewater matrices. The influence of these factors is expected to vary with the type of pathogen present and on plant operational conditions. During wastewater treatment, a number of plant specific physicochemical parameters such flocculation agents, pH, temperature, dissolved oxygen and turbidity may also influence pathogen removal. All these factors have complex interactions with each other and it is extremely difficult to pinpoint the exact mechanism of pathogen removal. Hence, there remains limited information in the literature on this subject. In this literature review, available information related to removal has been compiled for three microbial groups (bacteria, protozoa and viruses).
2.1.2 Bacterial removal mechanisms
The mechanisms behind the removal of E. coli in mixed liquor at laboratory scale (using seeded
E. coli) was investigated by Van der Drift et al. (1977). They reported that a rapid adsorption of
E. coli onto sludge flocs occurred followed by a slow removal through grazing by ciliated protozoa. Approximately one Log10 removal was observed in the first two hours due to
adsorption, followed by an additional one log10 reduction after 6 hours. Similarly, 10-60% of
faecal coliforms were reported by George et al. (2002)to be removed during the settling of wastewater sludge. However, they noted that the proportion of coliforms associated to settleable particles varied from one sample to another. In addition, they found no significant relationship between settleable particles and faecal coliform removal during settling. Despite this, they reported that the (de)nitrification step favoured removal of faecal coliforms due to protozoa grazing, competition with the indigenous microflora and sedimentation with flocs. The influence of wastewater protozoa grazing on biofilm, on the removal of bacteria was studied in a laboratory set up by Chabaud et al. (2006). Protozoa in the presence of biofilm were reported to be responsible for 60% of the bacterial removal. Grazing is a common mode of feeding by ciliates such as Vorticella, Opercularia or Carchesium and Paramecium. It is most likely to occur in the biofilms where bacterial density is greater compared to the heavily aerated sludge produced during the activated sludge process.
The removal of bacterial indicators and pathogens in ASP can therefore be assumed to be a sum of the following mechanisms: die-off, sedimentation, adsorption and filter feeding.
2.1.3 Protozoa removal mechanisms
Due to the size of protozoa (oo)cysts, sedimentation is an important mechanism involved in removal. Another important mechanism is natural decay or the trophozoites within the (oo)cysts. Natural sedimentation velocities of protozoa (oo)cysts were investigated in Hanks balanced salt solution at constant temperature of 23°C and were reported to be 0.35 m/s for
the sedimentation rate. Unabsorbed protozoa (oo)cysts are not expected to be removed by sedimentation alone.
Particle concentration is also reported to be a factor in the attachment of (oo)cysts. No attachment of C. parvum oocysts to soil particles was observed at suspended solids concentration of < 2mg/L (Dai and Boll, 2003). In comparison, in water samples of varying turbidity significant attachment of (oo)cysts has been reported to occur at 105-216 mg/L suspended solids (Feng et al., 2003). Feng et al. (2003) also reported that particle associated oocysts settled up to 50 times faster than un-attached oocysts. Similarly, Searcy et al. (2005) reported that in the presence of suspended charged inorganic particles (iron oxide or kaolinite), considerably higher removal of oocysts was observed compared to removal with illite suspension (as illite had a considerably more negative zeta potential than either kaolinite or iron oxide at neutral pH). They concluded that as
Cryptosporidium oocysts are negatively charged, the electrostatic repulsive forces increased as the inorganic particles (illite) surface charge become more negative. Changes in pH and ionic strength of solution have also been found to play a significant role in the attachment for illite but not kaolinite or iron oxide (Feng et al., 2003). This suggests that particle type (ie, charge on the particle) is more important than solution chemistry in (oo)cyst-particle attachment.
For biological floc removal of Cryptosporidium, removal of Cryptosporidium oocysts at a laboratory scale (jar tests) using mixed liquor from an activated sludge plant was investigated by Suwa and Suzuki (2001). They observed a rapid initial removal of oocyst (1-2 Log10) after 1 hour of aeration
followed by a slow decline of a further 1 Log10 for 8 hour of incubation. This suggested that
adsorption followed by sedimentation was the main mechanism behind the initial removal, but no significant further removal could be expected post 8h of incubation. Therefore, the authors suggested that in large scale treatment processes, there may be an accumulation of infectious oocysts in the sludge, especially during disease outbreaks. This may then eventually reduce the removal capacity of the activated sludge process by as much as 20% or more if the sludge is returned to the reactor after completion of a batch process.
The above studies suggest that adsorption to solids is an important mechanism for the removal of protozoa pathogens in the activated sludge process. However, natural decay due to environmental factors such as temperature, oxidation of (oo)cysts during aeration, and mechanical disruption of (oo)cysts are also expected to play a major role in the removal process. It has been reported that temperature is a significant factor in inactivation of metabolically active Cryptosporidium oocysts, with higher inactivation occurring at a temperature of higher (King et al., 2005).
2.1.4 Virus removal mechanisms
7 | Development of Validation Protocols for Activated Sludge Process in Water Recycling
important for the ability to remove viruses through adsorption to particles. For viruses, their isoelectric point has a major influence on adsorption. The isoelectric point is the pH at which a virus capsid has no net electric charge. Viruses are positively charged below their isoelectric point, whereas above that pH; the viruses have a net negative charge (Templeton et al., 2008). Each enteric virus has a different isoelectric point and due to this variability, there is no universal virus or pH point which can be used to assess viral removal or inactivation through treatment processes. It has been reported that due to different isoelectric points of tested poliovirus and bacteriophage, no single bacteriophage could accurately predict the adsorption of poliovirus to charged particles in wastewater (Moore et al., 1975). In general, acidic conditions (pH 5 or less) are expected to increase the adsorption of viruses to charged particles in wastewater. This suggests that in large scale activated sludge processes, pH and the presence of divalent and trivalent cations determine the adsorption of enteric virus and any differences in adsorption is due to varying isoelectric points of different enteric viruses.
Adsorption of enteric viruses to suspended solids in wastewater is a major mechanism behind the removal of virus via sedimentation. Conditions which favour adsorption of seeded poliovirus and coliphages (T2, T7 and f2) in sewage, activated sludge process and treated effluent were studied by Moore et al. (1975). Optimum conditions for viral adsorption to both organic and inorganic content were found to be favoured in the presence of a divalent cation (Ca2+), which can act as a bridge at low pH (5.5-6.5). They also determined that in the neutral pH range (6-8), low adsorption of the phage and poliovirus to the suspended solids (1-17%) occurred in the secondary effluent. Mechanisms of poliovirus 1, coxsackievirus B-1 and coliphage removal during laboratory scale activated sludgetreatment process were also studied by Glass and O’Brien (1980). They found that rapid adsorption of the viruses (20-50 min) to suspended solids occurred, followed by a slower rate of inactivation while attached to the suspended solids. An additional part of this study showed that viruses associated with the solids were found to remain infective. This suggested that virus removal through adsorption to suspended solids is not an inactivation processes, and therefore, does not reduce health risks from contact with untreated sludge.
water from heavy rain and snowmelt events (Keiding and Nielsen, 1997). Similarly, ionic strength has been reported as the major factor which leads to detachment of bound bacteria to the sludge flocs (Zita and Hermansson, 1994). Omura et al.(1989), observed increased numbers of coliform and Enterococcus spp. in primary sedimentation effluent of an activated sludge plant as compared to influent. The increased numbers of bacteria in the effluent was attributed to desorption from the excess sludge returned to the primary sedimentation tank.
In a study of ASP systems in France, influent and secondary effluent samples were taken over 24, 48 and 72 hours intervals using 24 hours composite samples and 2-3 hour grab sampling (Rolland et al., 1983). The WWTP involved had a theoretical hydraulic retention time of approximately 6 hours. On the basis of grab samples, enteric virus removals on the four sampling days was variable ranging between 83% (0.77 log), 98% (1.7 log), 83% (0.77 log) and 87% (0.89 log) respectively, while faecal coliform removals were comparatively higher at 92% (1.09 log), 99% (2 log), 96% (1.4 log) and 99% (2 log). The authors also reported that there were limited correlations between virus numbers in the final effluent and other parameters such as chemical oxygen demand, suspended solids or faecal coliforms (calculated using the linear regression model for all flux parameters, 0.05 < P < 0.10). Virus removal exceeded the removal of suspended solids, chemical oxygen demand and turbidity. In addition, they determined that the virus removals estimated from grab samples were very similar to automatic composite samples.
2.2
Non-adsorption factors influencing pathogen removal
The degree of removal of pathogens during activated sludge treatment (which commonly occurs at mesophilic temperatures) is influenced by a variety of interacting operational variables and conditions. These can vary between WWTPs and may often deviate from the ideal parameters. These parameters include the level of aeration, mixing and seasonal temperature variations. A number of studies have focused on understanding these factors and their influence on the removal of pathogens during wastewater treatment.
2.2.1 Temperature
Temperature of the mixed liquor is an easily monitored parameter and therefore would make an ideal performance indicator if appropriate. A study of the incubation of E. coli in soil at 5°C, 10°C, 20°C and 37°C showed that the best survival occurred at 5°C (Sjogren, 1995). High temperatures (> 55˚C) have been observed to be required for the rapid inactivation of pathogens such as parasite eggs, which are more resistant to heat that other microbial pathogens (Carrington et al., 1991). Since thermal inactivation is a function of time and temperature, better removal of pathogens can be achieved at higher temperatures and hydraulic retention time. Mesophilic anaerobic digestion (35°C) was reported to result in 2-3 log10 reduction in the number of faecal indicator bacteria,
9 | Development of Validation Protocols for Activated Sludge Process in Water Recycling
2.2.2 pH
As previously descried above, pH affects the sorption (low pH) and desorption (high pH) of viruses and bacteriophage to the matrix (Sobsey et al., 1980). Enteric viruses have different isoelectric points and due to this variability in the isoelectric point, variability in the removal of during the treatment processes is expected. Acidic conditions (low pH ~4) result in increased adsorption of viruses to the suspended solids. pH can also influence the sorption of bacteria. In a study on Pseudomonas movement through soil columns, Gammack et al. (1992) found higher number of cells in the effluent at pH 7.5 than at pH 4.5.
Generally, enteric pathogens are expected to survive better at near neutral pH. Rapid inactivation of bacteriophage (MS2 and Q beta) were observed to occur at pH <6 or >8, whereas both bacteriophage were found to be relatively stable at near neutral pH (6-8) (Feng
et al., 2003). At extreme pH values, hydrogen and hydroxyl are the predominant ions and have been reported to cause oxidation of viral proteins (Feng et al., 2003; Nuanualsuwan and Cliver, 2003). Ward and Ashley reported that the change in pH affected the ionic states of viral capsid proteins, which ultimately determines the stability of viral cells (Ward and Ashley, 1979).
2.2.3 Suspended Solids
Viruses are negatively charged at neutral pH and tend to adsorb to suspended solids (inorganic and organic solids), and this adsorption is highly dependent on factors such as solids concentration, pH, and metal ion composition (Schaub and Sorber, 1976). In general, virus adsorbed onto suspended solids in the influent as well as virus that are secondarily adsorbed to mixed liquor-suspended solids are removed during clarification process (Hejkal et al., 1981). In a wetland receiving untreated wastewater, a good correlation for the removal of Giardia cysts and turbidity was reported by Quinonez-Diaz et al. (2001). Hirata and Hashimoto (1997) also examined removal of Giardia cysts and typically found poor correlations between various parameters and
Giardia removal except for a correlation between turbidity reduction and a reduction of Giardia
2.2.4 Pathogen type
Pathogen removal during wastewater treatment is pathogen type specific. In general, bacterial pathogens are more sensitive to environmental stress compared to protozoa and viral pathogens. There is even variation within pathogen types. For example, Adenoviruses 40 and 41 were found to be more resistant to inactivation than poliovirus in wastewater and to be significantly more resistant than both Hepatitis A virus and poliovirus in seawater and tap water samples (Enriquez et al., 1995).
2.2.5 Biological Oxygen Demand
Biological oxygen demand (BOD) is an indicator of the extent of organic matter reduction and stabilisation during wastewater treatment. Low BOD signifies well-stabilised organic matter. Efficient mixing and organic matter stabilisation have been reported to be the main factors controlling the rate of inactivation of microorganisms under mesophilic conditions (Smith et al., 2005). For coliphages, a positive correlation was found between coliphage removal during biological treatment and the reduction of CBOD5 and total suspended solids. Rose et al. (1996)
found no correlation, between the reduction of ammonia and coliphage. Both coliphage and enterovirus removal, however, was positively correlated to CBOD5 during biological treatment. In
another study of ASP at the laboratory scale, lower removal of coliforms, E. coli, Enterococcus
spp., and Cryptosporidium were reported in the presence of high alkalinity and CBOD5 (Flapper et al., 2010). In the same study, an opposite effect was observed, however, for the removal of bacteriophage, Giardia and sulphite reducing Clostridia (Flapper et al., 2010).
2.2.6 Ammonia
Free ammonia (NH3) is very reactive and effective in the inactivation of bacteria, virus and
bacteriophage (Cramer et al., 1983). Ammonia is produced during the degradation of nitrogen containing organic acids during wastewater treatment and its production is favoured under low pH conditions (Taylor et al., 1978).
2.2.7 Hydraulic retention time
11 | Development of Validation Protocols for Activated Sludge Process in Water Recycling
influencing bacterial removal rates since it allows other changes in the lagoonenvironment, such as pH, temperature, etc. to affect bacterial die-off.
2.2.8 Solids retention time and mixed liquor suspended solids
Sludge retention time (SRT) is the average time the activated sludge solids remain in the digester. SRT is the single most important design and operating parameter affecting the performance of activated sludge systems (Metcalf, 2003). SRT is usually a function of the waste composition, reactor type, operating temperature and other process details (Buekens, 2005). In general, it can be assumed that a longer SRT will allow for more stabilisation of organic matter and pathogen inactivation compared to a shorter SRT under the same operating conditions (Loge et al., 2002). In a 2010 study on ASP, 1.9 log10 reduction of Salmonella was
reported with a SRT of 12 days which improved to 3.75 log10 reduction at an SRT of 25 days at
the same temperature (Chen et al., 2012). No further reduction in Salmonella, however, was observed at SRT higher than 25 days.
The mixed liquor suspended solids (MLSS) influences the SRT as it is the concentration of suspended solids in the aeration tank. MLSS is adjusted based on the inflow of wastewater to ensure that there is sufficient quantity of active biomass to digest organic matter in the aeration tank. The traditional method to control SRT during the activates sludge process is to manually adjust the sludge wasting rate based on the food-to-microorganism (F/M) ratio or mixed liquor suspended solids (MLSS) concentration. The SRT often depends upon the temperature and wastewater flow into the treatment e.g., during wet periods SRT is usually lower compared to the dry period.
2.2.9 Flocculation-aided sedimentation
The addition of chemical coagulants such as Fe2Cl3 is reported to improve the efficacy of both
primary and secondary treatment for removing microorganisms (Zhang and Farahbakhsh, 2007). They found that the use of coagulants significantly increased the removal of bacterial indicators (faecal coliforms, Enterococcus spp. and sulphite-reducing clostridia) and bacteriophages by various primary and secondary wastewater treatment processes in several geographical areas. Lucena et al. (2004) also demonstrated that treatment processes such as lime-aided flocculation could have different influences on different microorganisms with faecal coliforms having the highest reduction and spores of sulphite-reducing clostridia and bacteriophages infecting B. fragilis the lowest.
2.2.10Turbidity
In a pilot plant study, the removal of particles > 2 µm was correlated to turbidity reduction and the removal of Cryptosporidium oocysts (Hendricks, 2000).
2.2.11 Hydrophobicity
Several non-wastewater treatment experiments have shown that hydrophobic microorganisms adhere more effectively to hydrophobic substrate than hydrophilic microbes (Fattom and Shilo, 1984; Stenström, 1989). In a study of migration through porous soils, hydrophobic bacteria were found to move slower than hydrophilic bacteria. This was shown to be due to the increased adhesion of the hydrophobic bacteriato soil particles (Lance and Gerba, 1984). Similar results have been observed in other similar experiments (McCaulou et al., 1994; Stenström, 1989). In contrast, Gannon et al. (1991) found no correlation between hydrophobicity and bacterial transport in soil porous media. Fattom and Shilo (1984) also observed that bacteria become more hydrophobic under high growth rates or during exponential growth (such as can occur in an ASP system) which could increase their removal.
2.3
Correlation between physicochemical factors and pathogen removal
Physicochemical parameters, BOD5, COD and suspended solids have been reported as useful for the control of wastewater treatment process while other parameters, such as conductivity or nitrate content have been found to be inadequate (Howard et al., 2004). A number of studies have tried to correlate physicochemical and microbiological parameters with varying degree of success. Atlas and Bartha (1998) identified BOD as the only parameter of wastewater quality after treatment that could be related with microbiological quality. A good correlation between BOD and SS with respect to total and faecal coliforms has also been reported in two studies by Katmi et al. (2008) and Williams et al. (1995). Conversely, in a year-long study on an activated sludge treatment plant in Spain, Muela et al. (2011) found no significant correlations between physicochemical parameters (COD, BOD, SS, TKN, and NO3) and microorganism presence.
Similarly, in Membrane bioreactor (MBR) and upflow anaerobic sludge blankets (UASB), no physicochemical parameter (NH4, PO4, COD, BOD, TOC, and SS) was able to predict the presence of
enterovirus genome in the effluent (Ottoson et al., 2006a).
2.3.1 Bacteria removal
Rose et al. (1996) examined the removal of bacteria in an activated sludge treatment plant with associated nitrification in Florida. The average removal of total coliforms and faecal coliforms through biological treatment with clarification was 1.75 log10 and 2.06 log10 respectively. No
correlation was observed between bacterial removal and any of the physicochemical parameters (including CBOD5, organic nitrogen, total nitrogen, suspended solids or turbidity) across the
activated sludge process. In a following study, Rose et al. (2004) investigated the microbial quality of wastewater at 6 wastewater treatment facilities in the USA. The observed bacterial removal through the activated sludge plants was 1.39-3.0 log10 with lower Clostridium removal of 1.17-2.69
log10. The highest removal was observed in a plant with enhanced biological phosphorus removal
13 | Development of Validation Protocols for Activated Sludge Process in Water Recycling 2.3.2 Enteric virus removal
In a study from France on ASP process, limited correlations were found between virus numbers in the effluent and physicochemical parameters such as chemical oxygen demand, suspended solids (Rolland et al., 1983). In addition, virus removals were reported to exceed suspended solids, chemical oxygen demand and turbidity removals. Similarly, in a year-long study on an activated sludge treatment plant in Spain, PCA of data indicated no significant correlations between physicochemical (COD, BOD, SS), TKN, and NO3) and microbiological parameters (Muela et al.,
2011). In another study, on enteric pathogens and indicators removal during membrane bioreactor (MBR) and up-flow anaerobic sludge blankets (UASB), Ottoson et al. (2006a) found that no physicochemical parameter (NH4, PO4, COD, BOD, TOC, and SS) was able to predict the
presence of enterovirus genome in the effluent samples.
2.3.3 Protozoa removal
A significant link between total alkalinity, organic matter, turbidity and NO3 and Cryptosporidium
and Giardia removal was reported from a laboratory scale experiment after applying PCA analysis (Flapper et al., 2010). Furthermore, suspended solids, turbidity, TKN and COD were reported as major negatively correlated factors linked to LRVs. Bonadonna et al. (2002) investigated the occurrence of Cryptosporidium in secondary treated effluent samples from a municipal wastewater treatment plant. Their data analysis showed no correlation between Cryptosporidium
numbers and measured physicochemical parameters such as pH, redox potential and total organic carbon and that of the other microorganisms.
A study by Rose et al. (2004) also examined the impact of loading conditions, process design, and operating parameters (MCRT and MLSS) on the removal of protozoa. Increased parasite removal biological nutrient removal facility was found to be associated with MCRT of 8.7-13.3 days.
Cryptosporidium oocysts removal was least effective in the conventional and enhanced biological phosphorus removal facilities with MCRTs of 3-5 days and 8-16 days respectively. Conversely, most effective removal of oocysts was observed in biological nutrient removal facility with MCRT of 8.7-13.3 days. However, no correlation between process variables (MCRT and MLSS) and pathogen and indicator removals was observed.
2.4
Target pathogens and indicators/surrogates
Enteric viruses and protozoa are more significant from an Australian public health point of view than bacteria in recycled water due to their low dose, high infectivity and greater resistance to most treatment processes. Therefore, in this study viruses and protozoa are the focus as target pathogen groups for validation.
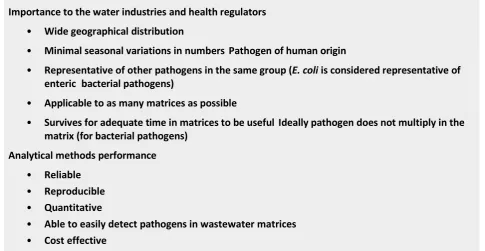
2.4.1 Criteria used for selection of representative pathogens
evaluated for their potential to be used as representative pathogen(s). The criteria used for the selection of representative pathogens were adapted from the WERF report by Monis and Blackbeard (2010). The main selection of factors which need to be considered are listed in Table 2-1.
Table 2-1 Selection criteria for representative pathogens.
Selection Criteria
Importance to the water industries and health regulators
• Wide geographical distribution
• Minimal seasonal variations in numbers Pathogen of human origin
• Representative of other pathogens in the same group (E. coli is considered representative of enteric bacterial pathogens)
• Applicable to as many matrices as possible
• Survives for adequate time in matrices to be useful Ideally pathogen does not multiply in the matrix (for bacterial pathogens)
Analytical methods performance
• Reliable • Reproducible • Quantitative
• Able to easily detect pathogens in wastewater matrices • Cost effective
Adapted from Monis and Blackbeard (2010).
2.4.2 Enteric viruses
Viral pathogens are the major cause of gastroenteritis worldwide. There are a wide variety of viruses that can be found in wastewater (Moni and Blackbeard, 2010) with the presence of specific enteric viruses and their removal during treatment processes varying depending on a range of factors including local community conditions, the WWTP design and geographical and climatic conditions.
Adenovirus
Human adenovirus are ubiquitous pathogens that can cause a variety of diseases ranging from respiratory illness and keratoconjunctivitis to gastroenteritis (Sidhu et al., 2013b). There are at least 57 known human adenovirus serotypes which are organized into six subgroups (A–F). Adenovirus serotypes 40 (Ad 40) and 41 (Ad 41) are the second most common etiological agents of gastroenteritis in children (Buckwalter et al., 2012).
Level of importance to the industry:
15 | Development of Validation Protocols for Activated Sludge Process in Water Recycling
thermostable and UV stable than other enteric viruses such as Norovirus and rotavirus (Enriquez et al., 1995; Gerba et al., 2002).
Geographical distribution:
Widely distributed in wastewater matrices (Gerba et al., 2002; Reynolds, 2004)
Representative of other pathogens in the same class:
On the basis of high stability in the environment, absence of adenovirus in human wastewater will indicate absence of other human pathogens. Adenoviruses have been shown to be more resistantthan enteroviruses to wastewater treatment processes and other environmental factors and considerably more so than polioviruses and feline caliciviruses (Tree et al., 2005).
Presence in multiple matrices:
Present in most moderate-sized populations and excreted in stools. Adenovirus can therefore be expected to be present in wastewater matrices.
Numbers In influent:
102.8 L-1 cytopathic units (He and Jiang, 2005)
<100-102L-1 plaque forming units (Sedmak et al., 2005) 106 L -1 PCR detectable units (He and Jiang, 2005)
Numbers in effluent:
6 × 10² L-1 cytopathic units (He and Jiang, 2005) 8 × 10⁵ L-1 PCR detectable units (He and Jiang, 2005)
Analytical methods:
Several detection and quantification approaches are available: (i) cell culture (ii) PCR, (iii) integrated cell culture (ICC) PCR or reverse transcriptase (RT)-PCR. Cell culture with RT-PCR only detects the results of virus infection (Ko et al., 2005). Cromeans and Sobsey (2004) used RT-PCR to detect replicative forms in cell culture which suggested that cytopathic effect studies underestimated infection. PCR based detection generally results in higher numbers than CPE due to the detection of all DNA from both infective and non-infective adenovirus particles (He and Jiang, 2005).
2.4.3 Protozoa
Unlike enteric bacteria and viruses, there are only two enteric protozoa (Cryptosporidium and
Giardia) that are of significant concern in wastewater in Australia. The protozoan pathogen of most concern and importance to the water recycling industry is Cryptosporidium spp. oocysts.
Cryptosporidium is the most resistant to inactivation, and is therefore the target protozoan pathogen for validation purposes.
Cryptosporidium parvum, Cryptosporidium hominis
High, as oocysts are recognised to be more resistant to inactivation by chlorine than most other pathogens including Giardia cysts (Fayer et al., 2000). It is one of the microorganisms used by health regulators to assess the safety of recycled water. Furthermore, the infectious dose has been estimated to be as low as 30 oocysts (Fayer et al., 2000). Several outbreaks of cryptosporidiosis and giardiasis have been attributed to contamination of water supplies with (oo)cysts (Baldursson and Karanis, 2011).
Geographical distribution:
Widely distributed, a common parasite of humans and other mammals. Cryptosporidium spp. and Giardia spp. cause diarrheal diseases in human and animals worldwide (Rimhanen-Finne et al., 2004).
Representative of other pathogens in the same class:
Probably not. Generally more resistant to disinfectants compared to Giardia. Removal through wastewater treatment, in particular filtration, is poorly correlated with Giardia. Due to their smaller size, removal of Cryptosporidium oocysts during filtration is lower than Giardia
(Harwood et al., 2005). During aerobic digestion of sludge, a higher reduction in
Cryptosporidium numbers has been observed (2.96 Log10) compared to Giardia (1.40 Log10)
(Chauret et al., 1999). No reduction was observed in Giardia numbers during anaerobic digestion of sludge (Chauret et al., 1999).
Presence in multiple matrices:
Yes, there are many reports of occurrence in wastewater and sludge/biosolids.
Numbers: In raw sewage:
101-102 L-1 (Harwood et al., 2005)
101-102/1 L (Montemayor et al., 2005)
In effluent:
100-101 L-1 (Harwood et al., 2005) 100.3-101.2 L-1 (Montemayor et al., 2005)
Detection method:
Matrix determines the primary concentration step for Cryptosporidium oocysts. Concentration methods have included centrifugation and filtration. The primary concentration step is usually followed by the purification by immune-magnetic separation (IMS). Direct counts can be made by fluorescent microscopy or real-time PCR. Infectivity can be measured by cell culture. Molecular tests are required for species/genotype identification.
Method performance: